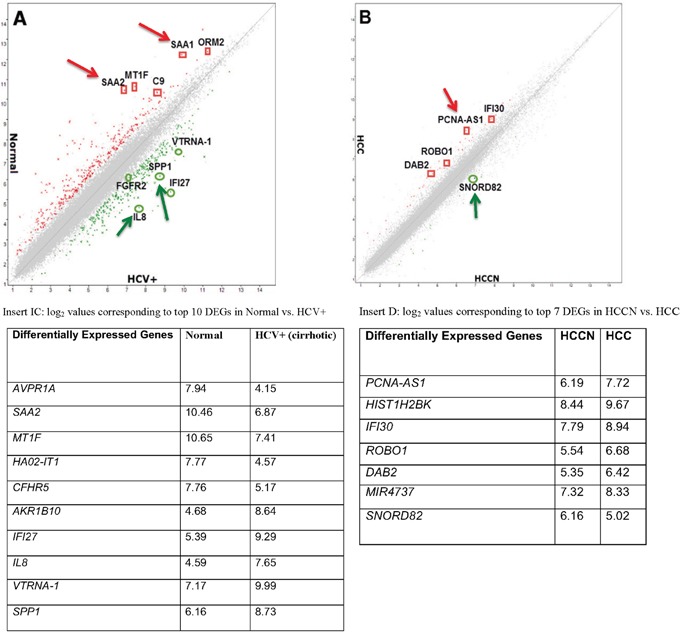
Figure 1. Global gene expression profiling data of hepatitis C tissue samples.

(A): Scatter plot presenting the values of log2 for each gene in the normal (Y-axis) vs. HCV+ cirrhotic samples (X-axis). (B): Scatter plot presenting the values of log2 for each gene in the HCCN (X-axis) vs. HCV+HCC tumor samples (Y-axis). Insert (C): Table indicating the log2 values corresponding to top 10 DEGs in normal vs. HCV+ samples. Insert (D): Table indicating the log2 values corresponding to top 7 DEGs in HCCN vs. HCV+ HCC samples.
