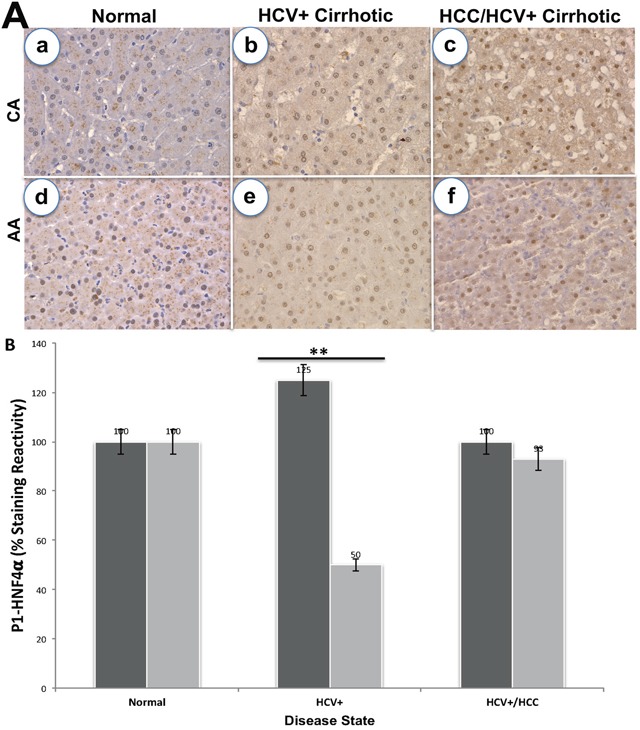
Figure 3. Immunohistochemical staining of P1-HNF4α.

(A) Staining in normal, HCV+ and HCC for CA (a-c) and AA (d-f) tissue samples. (B) Bar graphs = % staining reactivity (Y-axis) vs. disease state (X-axis) for CA, black bar and AA, grey bar (n=3 – 4 tissue sections from 24 paraffin embedded tissue blocks ± S.E; *p<0.05; **p<0.001).
