

Abstract
Objective:
The aims of this study were to evaluate the efficacy of cone beam CT (CBCT) in the study of the patellar tilt angle and rotational alignment of the femoral/tibial component after total knee arthroplasty and to estimate how metallic artefacts impaired detection of periprosthetic bone structures and bordering tendon–muscle structures.
Methods:
20 symptomatic total knee arthroplasties were examined using CBCT by three independent observers. The patellar tilt angle and rotational alignment of femoral and tibial components were measured in relation to the femoral flange, transepicondylar axis and tibial tuberosity, respectively. A four-score scale, ranging from “many metallic artefacts” (the structure cannot be identified) to “no metallic artefacts” (the structure can be perfectly identified), was used to judge every structure.
Results:
The patellar tilt angle and rotational alignment of the prosthetic components showed very high intra- and interobserver agreements (intraclass correlation coefficient values 0.895–0.975 and 0.891–0.948, respectively). Bone and tendon–muscle structures cannot be identified in the distal part of the femoral component, whereas they can be well identified in the proximal part of the femoral component and in the proximal/middle third of the tibial stem.
Conclusion:
CBCT was an effective tool, providing reproducible measurements of the patellar tilt angle and the rotational alignment of the femoral/tibial component. Furthermore, it allowed bone and tendon–muscle structures analysis with little impediments from metal artefacts.
Advances in knowledge:
CBCT allows easy and accurate measurements on the rotational axial plane, unburdened by image quality impairment due to metal artefacts.
INTRODUCTION
Total knee arthroplasty (TKA) is a common orthopaedic procedure with a high rate of satisfactory results.1 However, a small percentage of patients will experience residual pain and functional disability.2 TKA procedures have shown an increment in the number of revisions in recent years, and this is expected to continue increasing in the future (by 2030, the demand for primary or revision TKAs is projected to be 55–62%).3
Among the various most common complications of TKA such as patella–femoral/tibial–femoral malalignment or instability, loosening, infection and polyethylene wear with or without osteolysis, the incorrect alignment of prosthetic components is a possible cause of residual symptoms.4
A stepwise approach to the evaluation of painful TKA is recommended, including history, physical examinations, radiographs and blood testing. Radiographs are routinely used for the study of prosthetic components in the frontal and lateral planes but do not permit analysis in the axial plane.5 Periprosthetic bone lesions identified using radiographs may also require a more extensive characterization.6 Therefore, a CT scan is usually suggested to determine the rotational alignment of the prosthetic components and to evaluate the bone structures.7
CT examines the knee in all reconstruction planes but is considerably affected by metal artefacts.8 Recently, a new three-dimensional (3D) imaging technique called cone beam CT (CBCT) is emerging.9 CBCT imaging is accomplished using a rotating gantry to which an X-ray source and detector are fixed. It utilizes a conic/pyramidal X-ray beam hitting a two-dimensional (2D) detector (image intensifier or flat panel)10 for image capture by a lengthy only-one rotation (5.4–40 s).11 CBCT emits low radiation dose relatively to multislice spiral CT (MSCT),12 is only moderately affected by metal artefacts,13 offers high spatial resolution (0.075- to 0.4-mm isotropic voxel)14 and allows accurate 2D/3D measurements.15 Furthermore, it has proven to produce adequate image quality for soft tissue visualization16 and to perform well in the volumetric study of bone structures.17
These features cause CBCT to be increasingly used in the assessment of the extremities.16 So far, only few studies18–21 have been published about the assessment of the knee via CBCT, and none have addressed TKA.
The purpose of this retrospective study is to investigate the efficacy of CBCT in patients with symptomatic TKA by means of (i) the measurement of the patellar tilt angle and the rotational alignment of the femoral and tibial components and (ii) how metallic artefacts impaired the analysis of the periprosthetic bone structures and bordering tendon–muscle structures.
METHODS AND MATERIALS
Patients and device
20 patients (mean age 73 ± 9 years) with symptomatic TKA were examined via CBCT volumetric imaging. The study was approved by the research ethics committee of our institution. The current study was carried out in accordance with the standards set out in the Code of Ethics of the World Medical Association (Declaration of Helsinki) for experiments involving humans. The research procedures were approved by the responsible institutional committee on human experimentation. Informed consent was obtained for experimentation with human subjects. Scans were performed using NewTom™ 5G CBCT (QR srl, Verona, Italy), equipped with amorphous silicon flat-panel detector (20 × 25 cm). The patient lay in the supine position with the foot kept vertical and the knee joint flexed approximately 10° by a radiolucent wedge placed below the popliteus pit. No means of restraint were used to immobilize the knee. The contralateral leg was kept outside the gantry. The same protocol—called “Standard Regular” by the producer—was used for all examinations. It provided 110 kV, 3.56–6.11 mA, field of view of 18 × 16 cm, scan time of 18 s and exposure time of 3.6 s with the acquisition of 360 images (1 image for each rotation degree). All CBCT volumes were reconstructed with 0.3-mm isometric voxel size. Images were displayed with a medical monitor, 3-MP Barco display, 20-inch, 2048 × 1536 resolution (Barco, Kortrijk, Belgium). The software originally supplied with the system was employed for the image evaluation. Neither metal artefact reduction algorithms nor additional measurement software for analysing data were utilized.
Evaluation of the patellar tilt and rotational alignment of the prosthetic components
Alignment of the patella and rotational alignment of the femoral and tibial components are intimately related.22
Patellar tilt was measured in an axial plane at the mid-point of the patella (Figure 1). The tilt angle was obtained between the line connecting the patellar axes and the femoral flange axes (Figure 2).
Figure 1.

Lateral scout view showing reference planes used for the study of patellar tilt angle, rotational alignment of the prosthetic components, bone structures and tendon–muscle structures. In this case the UFP only includes the patellar bone, therefore the quadriceps tendon was not analysed. LFP, lower femoral plane (approximate depiction, since it can be exactly identified only in the axial CBCT plane); LTP, lower tibial plane; PMP, patellar mid-point plane; UFP, upper femoral plane; UTP, upper tibial plane.
Figure 2.
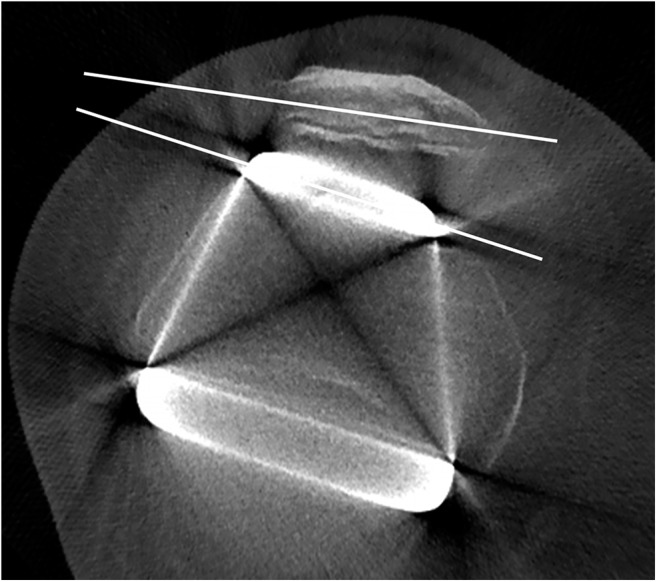
Cone beam CT axial plane corresponding to the patellar mid-point used to measure the patellar tilt angle.
The rotational alignment of the femoral component was measured by the angle between the line tangent to the posterior femoral condyles and the transepicondylar axis7 (Figure 3). The transepicondylar axis is the line drawn across the lateral epicondyle and the medial epicondylar sulcus.
Figure 3.

Cone beam CT axial plane corresponding to the transepicondylar axis, used to measure the femoral component rotational angle. Note the photon starvation artefacts which hamper the detection of the femoral bone. They manifest as obvious alternated hypo-/hyperdense streaks, radiating from the metal prosthesis and opening-up in a fan-like manner. BF, biceps femoris muscle; GL, gastrocnemius lateral muscle; GM, gastrocnemius medial muscle; SA, sartorius muscle; SM, semi-membranosus muscle.
The rotational alignment of the tibial component23 (Figure 4) was measured by drawing Line A tangent to the posterior aspect of the tibial tray, and Line B perpendicular to Line A and passing through the centre of the stem. Finally, Line C was drawn from the centre of the stem to the centre of the most prominent portion of the tibial tuberosity. The angle between Lines B and C indicated the rotation of the tibial component.
Figure 4.

Cone beam CT axial planes corresponding to the tibial component tray (a) and the tibial tuberosity (b), both necessary to measure the tibial component rotational angle (black arch). In this case, the plane of the tibial tuberosity corresponds to the lower tibial plane in the assessment of the periprosthetic bone and muscles. PO, popliteus muscle; GM, gastrocnemius medial muscle; GL, gastrocnemius lateral muscle; SO, soleus muscle; TA, tibialis anterior muscle.
The angular differences between the maximum and minimum values for each angle were calculated.
Evaluation of periprosthetic bone and tendon–muscle structures
Bone evaluation was performed at Points 2, 5 and 10, and 15 mm from the metallic surface, along eight sunburst lines, each drawn at 45° from the centre of the metallic structure (Figure 5). This evaluation was repeated in four axial images, as follows:
– upper femoral plane, passing through the mid-point between the upper margins of the femoral flange and the posterior femoral condyles (Figure 1)
– lower femoral plane, corresponding to the transepicondylar axis. Bone structure was analysed at both femoral flange and posterior femoral condyles, separately (Figures 1 and 3)
– upper tibial plane, marked 5 mm below the tibial component tray in order to skip areas of bone loss caused by shielding stress (Figures 1 and 5)
– lower tibial plane, passing through the mid-point of the tibial stem (Figures 1 and 4b).
Figure 5.

Cone beam CT axial plane corresponding to the upper tibial plane. The eight dotted lines are drawn at 45° to one another and measure 15 mm from the metallic surface. Note beam hardening artefacts which manifest as hypodense streaks that gradually diminish from the metallic region towards the periphery. GL, gastrocnemius lateral muscle; GM, gastrocnemius medial muscle; PL, patellar ligament; PO, popliteus muscle.
In addition, patellar bone structure was analysed in the femoral planes. Obviously, points outside any bone structure were not analysed.
The evaluation of tendon–muscle structures was carried out by manually adapting the bone algorithm window (no specially designed software algorithm was implemented) in the same four aforementioned axial planes. The following muscle–tendon structures were observed in each plane:
– upper femoral plane: quadriceps tendon, vastus medialis, vastus lateralis, biceps femoris, sartorius, semi-membranosus and semi-tendinous muscles
– lower femoral plane: biceps femoris, sartorius, semi-membranosus, gastrocnemius medial and gastrocnemius lateral muscles (Figure 3)
– upper tibial plane: patellar ligament, popliteus, gastrocnemius medial and gastrocnemius lateral muscles (Figure 5)
– lower tibial plane: popliteus, gastrocnemius medial, gastrocnemius lateral, soleus and tibialis anterior muscles (Figure 4b).
With reference to the location of the patella, in the upper femoral plane, the quadriceps tendon was detected in only 12 patients, therefore in the remaining 8 patients the patellar bone was analysed instead (Figure 1). A visual grading of the previously determined structures was attributed for both bone and tendon–muscle structures. The score ranged from 0 to 3 and described the extent to which metallic artefacts impaired the detection of the normal anatomical structures analysed by CBCT. It should be underlined that this scoring system did not represent an assessment of image quality in absolute terms but only an assessment of how much artefacts determined image worsening.
– G0, many artefacts: the structure cannot be identified;
– G1, moderate artefacts: the structure can be identified but fine detail cannot be appreciated;
– G2, little artefacts: the structure can be well identified in most of its details;
– G3, no artefacts: the structure can be perfectly identified.
Observers and statistical analysis
All examinations were evaluated by three independent observers, one orthopaedic surgeon skilled in knee imaging (28 years' experience) and two radiologists experts on CBCT imaging (19 and 11 years' experience, respectively). The assessment was carried out twice by each observer, with an interval of 3 months.
Collected data were analysed using the SPSS® v. 23.0 statistical analysis software (IBM Corp., New York, NY; formerly SPSS Inc., Chicago, IL).
Intra- and interobserver reliabilities were determined for each designated parameter (tilt/rotational angle and bone/tendon–muscle structures), for the following in particular:
– for continuous variables used to analyse the location of the prosthetic components, the intraclass correlation coefficient (ICC) was used. The ICC values of 0.00–0.10, 0.11–0.40, 0.41–0.60, 0.61–0.80 and 0.81–1.0 represented no, slight, fair, good and very good agreement, respectively.
– for categorical variables used to analyse bone and tendon–muscle structures, Cohen's kappa was calculate. Kappa values of 0.01–0.20, 0.21–0.40, 0.41–0.60, 0.61–0.80, 0.81–0.99 and 1 represented slight, fair, moderate, substantial, almost perfect and perfect agreement, respectively.
Association between the visual grading and the distance from the metallic surface by different imaging axial planes was assessed using χ2 test and Spearman correlation analysis.
For each analysis, a p-value ≤ 0.05 was considered to be statistically significant.
RESULTS
Observer agreement
With regard to the periprosthetic bone and tendon–muscle structures, both intra- and interobserver reliabilities were good, with kappa values ranging from 0.60 to 1.00—from moderate to perfect agreement—(p < 0.05). Moreover, with regard to the patellar tilt and the alignment of the prosthetic components, an almost perfect agreement was found, both within each single observer (intraobserver reliability) and between three observers (interobserver reliability), with ICC values ranging from 0.895 to 0.975 and from 0.891 to 0.948 (p < 0.05), respectively.
Patellar tilt and rotational alignment of femoral/tibial components
Anatomical landmarks for the measurements of all angles were identified in 100% of cases. The mean differences between maximum and minimum values among the observers for patellar tilt and rotational alignment of femoral/tibial components were 1.3°, 1.1° and 2.8°, respectively (Table 1).
Table 1.
Angular differences between the maximum value and minimum value for each angle in each patient, calculated on all six measurements (two measures for each operator)
| Alignment | Patient |
||||||||||||||||||||
|---|---|---|---|---|---|---|---|---|---|---|---|---|---|---|---|---|---|---|---|---|---|
| #01 | #02 | #03 | #04 | #05 | #06 | #07 | #08 | #09 | #10 | #11 | #12 | #13 | #14 | #15 | #16 | #17 | #18 | #19 | #20 | Mean | |
| Patellar tilt | 1.0° | 1.7° | 1.2° | 1.2° | 1.9° | 0.9° | 2.2° | 1.3° | 0.6° | 0.9° | 0.9° | 1.1° | 1.8° | 1.3° | 2.0° | 2.1° | 0.8° | 0.9° | 0.7° | 1.4° | 1.3° |
| RAFC | 0.9° | 1.4° | 1.1° | 1.2° | 0.6° | 1.0° | 1.1° | 1.4° | 0.6° | 1.8° | 1.0° | 1.0° | 1.3° | 1.3° | 0.9° | 1.3° | 0.7° | 0.9° | 1.7° | 1.2° | 1.1° |
| RATC | 3.0° | 3.2° | 2.9° | 3.4° | 1.9° | 3.2° | 3.3° | 1.9° | 3.3° | 3.3° | 3.1° | 2.8° | 3.1° | 3.5° | 1.8° | 3.1° | 3.3° | 2.0° | 3.3° | 2.1° | 2.8° |
RAFC, rotational alignment of the femoral component; RATC, rotational alignment of the tibial component.
Bone structures
G2 + G3 were 20.2%, 47.8%, 71.6% and 69.1% at 2, 5, 10 and 15 mm, respectively (Table 2).
Table 2.
Visual grading of the bone structure relating to the distance from the metallic surface
| Visual grading | 2 mm |
5 mm |
10 mm |
15 mm |
||||
|---|---|---|---|---|---|---|---|---|
| n | % | n | % | n | % | n | % | |
| G0 | 1652 | 51.2 | 974 | 29.8 | 720 | 22.0 | 720 | 29.1 |
| G1 | 924 | 28.6 | 730 | 22.4 | 212 | 6.4 | 44 | 1.8 |
| G2 | 492 | 15.2 | 1108 | 33.9 | 966 | 29.5 | 188 | 7.6 |
| G3 | 160 | 5.0 | 452 | 13.9 | 1378 | 42.1 | 1520 | 61.5 |
| Total | 3228 | 100.0 | 3264 | 100.0 | 3276 | 100.0 | 2472 | 100.0 |
n, total number of observations (two observations for each of the three operators).
In the upper femoral plane, upper tibial plane and lower tibial plane, G2 + G3 was 74.3%, 59.5% and 69.1%, respectively (Table 3), whereas in the lower femoral plane, G0 was predominant. It was 36% and 100% in the evaluation of the anterior and posterior components, respectively; however, analysis of merely femoral bone tissue—thus excluding the patella—was always G0 (100%). Furthermore, all G0 (100%) at 10 and 15 mm were localized in the lower femoral plane.
Table 3.
Visual grading of the bone structure relating to the four reference axial planes
| Visual grading | Upper femoral plane |
Lower femoral plane (*) |
Lower femoral plane (†) |
Upper tibial plane |
Lower tibial plane |
|||||
|---|---|---|---|---|---|---|---|---|---|---|
| n | % | n | % | n | % | n | % | n | % | |
| G0 | 108 | 6.1 | 490 | 36.0 | 1440 | 100.0 | 542 | 15.4 | 520 | 16.3 |
| G1 | 346 | 19.6 | 216 | 15.9 | 0 | 0.0 | 884 | 25.1 | 464 | 14.6 |
| G2 | 474 | 26.9 | 424 | 31.1 | 0 | 0.0 | 926 | 26.2 | 930 | 29.1 |
| G3 | 836 | 47.4 | 232 | 17.0 | 0 | 0.0 | 1176 | 33.3 | 1278 | 40.0 |
| Total | 1764 | 100.0 | 1362 | 100.0 | 1440 | 100.0 | 3528 | 100.0 | 3192 | 100.0 |
n, total number of observations (two observations for each of the three operators).
The lower femoral plane was evaluated for both anterior (*) and posterior (†) femoral prosthetic components.
The study of the patellar bone showed G0, G1, G2 and G3 of 0%, 20.3%, 36.7% and 43.0%, respectively.
There were no significant differences in the visual grading of the bone structure pertaining to its location (anterior, posterior, medial and lateral) in relation to the metallic prosthesis.
Figure 6 described the distribution of the visual grading of the bone structure relating both to the four reference axial planes and to the distance from the metallic surface. For each axial plane, a statistically significant association (χ2 test: p < 0.001) was observed between the visual grading and the distance. In each plane, the bigger the distance from the metallic surface, the lesser the artefacts affected the bone structure image (Spearman correlation analysis: p < 0.001).
Figure 6.

Visual grading of the bone structure of the four reference axial planes relating to the distance from the metallic surface. The values are expressed as a percentage. For each axial plane, p < 0.001 (χ2 test; Spearman correlation analysis). (*) In the lower femoral plane, only the bone structure close to the anterior femoral prosthetic component was shown because all observations (100%) of the bone structure close to the posterior femoral prosthetic component were G0.
Tendon–muscle structures
G2 + G3 were 94.0%, 3.7%, 60.6% and 99.3%, in the upper femoral plane, lower femoral plane, upper tibial plane and lower tibial plane, respectively (Table 4). Quadriceps tendon, vastus medialis and vastus lateralis muscles were G2 in about two-thirds of the cases, whereas the patellar ligament, semi-tendinous, soleus and tibialis anterior muscles were almost always G3 (at least 90.0%). No G0 was observed in any of the above-mentioned structures.
Table 4.
Visual grading of all tendon–muscle structures relating to the four reference axial planes
| Visual grading | Upper femoral plane |
Lower femoral plane |
Upper tibial plane |
Lower tibial plane |
||||
|---|---|---|---|---|---|---|---|---|
| n | % | n | % | n | % | n | % | |
| G0 | 2 | 0.2 | 506 | 84.3 | 78 | 16.7 | 0 | 0.0 |
| G1 | 46 | 5.8 | 72 | 12.0 | 106 | 22.5 | 4 | 0.7 |
| G2 | 206 | 25.6 | 18 | 3.0 | 32 | 6.8 | 26 | 4.2 |
| G3 | 550 | 68.4 | 4 | 0.7 | 252 | 53.8 | 582 | 95.1 |
| Total | 804 | 100.0 | 600 | 100.0 | 468 | 100.0 | 612 | 100.0 |
n, total number of observations (two observations for each of the three operators).
Biceps femoris, sartorius and semi-membranosus muscles were G3 in 100% in the upper femoral plane, whereas in the lower femoral plane were predominantly G0 (at least 55.1%). Gastrocnemius medial and gastrocnemius lateral muscles were G0 in 100% in the lower femoral plane but were G3 in around 50% and 100% in the upper tibial plane and lower tibial plane, respectively.
No motion artefact was found.
DISCUSSION
As mentioned in the introduction, there are various complications of TKA. CT (especially dual-energy CT) provides good diagnostic assessment for every problem. However, we propose this study after having considered technical costs of each examination (around €150 and €60 for unenhanced CT and CBCT, respectively24,25). Moreover, dual-energy devices are not widespread and are preferably used for more complex contrast-enhanced examinations due to their high performances. Therefore, in the current study, CBCT was used because it is a novel and emerging volumetric imaging technique that has proven to have very good spatial resolution and relatively low radiation dose, cost and metal artefacts.12–14,17,24,25
Measurement of component position is important in the evaluation of a symptomatic TKA.5 Alignment of the components in the frontal and sagittal planes can be assessed with radiographic long films, whereas rotational alignment requires an axial CT plane. A large number of articles investigated rotational alignment of the femoral and tibial components after TKA by means of measurements via MSCT.26 Their primary purpose was to determine the range of rotation, from which a normal or deviating rotation can be defined. On the contrary, just some articles tested the intra- and interobserver reliabilities.7,27–32 Most of them reported a good or excellent reliability,27–32 but one stated that the reliability was poor.7
The ideal imaging technique should provide reproducible 2D/3D measurements with high-quality images and without drop by metal artefacts. CBCT proved to be effective for this purpose: measurements of rotational alignment of femoral and tibial components showed an almost perfect intraobserver agreement (ICC values ranging from 0.895 to 0.975) and interobserver agreement (ICC values ranging from 0.891 to 0.948). A lower intra- and interobserver agreements were found in the rotational alignment of the tibial component than that of the femoral component. This was probably because three lines had to be drawn to measure that angle, and it may be difficult to identify clear and reliable landmarks for those lines. In fact, there is no agreement among authors7,8,23,27,33 on the optimal landmarks to be used in the evaluation of tibial component rotation. In the upper femoral plane and tibial planes, periprosthetic bone and tendon–muscle structures can be well or perfectly identified (59.5–99.3%). Conversely, detection of the femoral bone and muscles in the lower femoral plane (where the metallic material amount is maximum) was almost never good or perfect (0–3.7%). Therefore, artefacts did not generally impair (three out of four planes) the assessment of the periprosthetic bone and bordering tendon–muscle structures, even with a substantial amount of metallic material.
The smaller the distance from the metallic surface, the more the artefacts affect the bone structure image because data in voxels are calculated from a smaller number of 2D radiographic projections.34 Sometimes these data are insufficient to get a correct reconstruction. In fact, bone structure can be mainly not identified, at least identified and well or perfectly identified at a distance of 2, 5 and 10–15 mm from the metal, respectively.
Metallic prosthesis affects the X-ray beam in such a way that the criteria for proper image reconstruction via CBCT back projection is not respected.34 Therefore, photon starvation and beam hardening artefacts arise (Figures 3 and 5).
In TKA as in maxillofacial CBCT, anatomical structures located between two or more metallic areas on the same axial plane cannot be evaluated due to major artefacts, such as the detection of the femoral bone in the lower femoral plane case (G0 = 100%) (Figure 3). However, in TKA imaging, deterioration of bone structures measured at every 45° angle around the metallic surface was essentially the same, whereas the artefacts in maxillofacial CBCT show a characteristic location dependent on the position of the metal within the mouth.35 This is probably related to the various differences of morphological, dimensional and structural characteristics between oral and knee prosthesis. In the other three planes where only one metallic area existed (upper femoral plane and tibial planes), bone structure could generally be well or perfectly identified. This proved the efficacy of CBCT in periprosthetic bone study in patients with TKA. Bone structure of the patella can also be always, at least, identified.
Analysis of tendon–muscle structures was also dependent on the axial plane considered.
The visual grading of these structures was superior in the axial sections that included lower amounts of metal and showed progressive improvement as the radial distance from the metallic surface increased (from 2 to 15 mm). The lower femoral plane included two metallic areas situated on the anterior and posterior femoral surfaces next to the tendon–muscle structures, respectively. Biceps femoris, sartorius and semi-membranosus muscles usually could not be identified on such a plane because of their proximity to the sizeable metallic mass on the posterior femoral condyles. In the upper femoral plane and in both tibial planes, muscular and tendon structures could be well or perfectly identified for the most part, since they were distant from the small metallic area located on the anterior femoral surface and within the tibia. Two exceptions were observed: in the upper femoral plane, the quadriceps tendon, vastus medialis and vastus lateralis muscles usually could be well identified despite their closeness to the small amount of metal that filled the patellofemoral joint. The evaluation of those upper tibial plane structures located in close proximity to the bone (popliteus, gastrocnemius medial and gastrocnemius lateral muscles) was sometimes unsatisfactory.
In general, CBCT appeared to be a volumetric imaging technique capable of assessing the patellar tilt and the alignment of prosthetic components in the rotational axial plane. In addition, CBCT allows a low-dose examination. Therefore, CBCT could not only be a useful and efficient complement to 2D radiographic imaging, but it could even replace MSCT, a high-dose technique currently considered as the volumetric imaging gold standard. Moreover, CBCT could even become the first non-contrast-enhanced CT imaging technique to be used in symptomatic TKA. It should be considered that a standard knee radiographic examination (anteroposterior and lateral–lateral projections) entails an effective dose of 3 µSv, whereas it amounts to 12.6 µSv with CBCT and 32.9 µSv with MSCT.18 No examination had to be repeated due to the presence of motion artefacts, unlike what sometime occurs in maxillofacial imaging,13,36 probably because unintentional movements of the knee are a less common event. This is an important factor since one weak point of CBCT is represented by its long scan time, ranging from 5.4 to 40 s11 (18 s in our study). Unfortunately, the size of flat-panel detector of NewTom 5G sets a maximum field of view of 18 × 16 cm. It is more than enough to include the whole prosthesis but not the entire lower limb at one time. Some authors24,37–39 affirmed that it is necessary to scan the entire limb in order to achieve a correct assessment of the prosthetic alignment in the frontal and lateral planes. Patients in our research were studied in the supine position because NewTom 5G did not allow different positioning. However, it has recently become possible to obtain images of the knee joint in weight-bearing position (i.e. under load) by an upright CBCT.40
The main weakness of our study was that there were not enough patients for a definite judgment about the efficacy of CBCT in TKA. However, this study was performed in order to understand whether additional researches with wider population samples are required or whether there is no role for CBCT in TKA. Another weakness was that no assessment about resolution of CBCT for detecting periprosthetic bone complications (fracture, osteolysis, periostitis and loosening) and soft tissues infection has been performed; nevertheless, no patient showed clinical signs of failed osteointegration of the knee prosthesis.
Furthermore, no comparison between CBCT and MSCT (gold standard 3D technique) has been carried out, but it should be underlined that comparative studies where both techniques use ionizing radiation are ethically difficult to justify.
CONCLUSIONS
Our results showed that CBCT after TKA was a volumetric imaging technique able to (i) accurately measure the patellar tilt angle and the rotational alignment of the femoral and tibial components and (ii) analyse bone and tendon–muscle structures with little impediments from metal artefacts in all imaging planes, except for the lower femoral level where two metallic areas were situated on the same axial plane.
Contributor Information
Cosimo Nardi, Email: cosimo.nardi@unifi.it.
Roberto Buzzi, Email: roberto.buzzi@unifi.it.
Roberto Molteni, Email: robertodocmolteni@yahoo.com.
Carlo Cossi, Email: carlo.cossi@gmail.com.
Chiara Lorini, Email: chiara.lorini@unifi.it.
Linda Calistri, Email: linda.calistri@unifi.it.
Stefano Colagrande, Email: stefano.colagrande@unifi.it.
REFERENCES
- 1.Graves S, Davidson D, de Steiger RN. Australian Orthopaedic Association National Joint Replacement Registry Annual Report; 2013.
- 2.Beswick AD, Wylde V, Gooberman-Hill R, Blom A, Dieppe P. What proportion of patients report long-term pain after total hip or knee replacement for osteoarthritis? A systematic review of prospective studies in unselected patients. BMJ Open 2012; 2: 000435. doi: https://doi.org/10.1136/bmjopen-2011-000435 [DOI] [PMC free article] [PubMed] [Google Scholar]
- 3.Kurtz SM, Lau E, Ong K, Zhao K, Kelly M, Bozic KJ. Future young patient demand for primary and revision joint replacement: national projections from 2010 to 2030. Clin Orthop Relat Res 2009; 467: 2606–12. doi: https://doi.org/10.1007/s11999-009-0834-6 [DOI] [PMC free article] [PubMed] [Google Scholar]
- 4.Fehring TK, Odum S, Griffin WL, Mason JB, Nadaud M. Early failures in total knee arthroplasty. Clin Orthop Relat Res 2001; 392: 315–18. doi: https://doi.org/10.1097/00003086-200111000-00041 [DOI] [PubMed] [Google Scholar]
- 5.Harman MK, Banks SA, Kirschner S, Lützner J. Prosthesis alignment affects axial rotation motion after total knee replacement: a prospective in vivo study combining computed tomography and fluoroscopic evaluations. BMC Musculoskelet Disord 2012; 13: 206. [DOI] [PMC free article] [PubMed] [Google Scholar]
- 6.Math KR, Zaidi SF, Petchprapa C, Harwin SF. Imaging of total knee arthroplasty. Semin Musculoskelet Radiol 2006; 10: 47–63. doi: https://doi.org/10.1055/s-2006-934216 [DOI] [PubMed] [Google Scholar]
- 7.Konigsberg B, Hess R, Hartman C, Smith L, Garvin KL. Inter- and intraobserver reliability of two-dimensional CT scan for total knee arthroplasty component malrotation. Clin Orthop Relat Res 2014; 472: 212–7. doi: https://doi.org/10.1007/s11999-013-3111-7 [DOI] [PMC free article] [PubMed] [Google Scholar]
- 8.Ho KC, Saevarsson SK, Ramm H, Lieck R, Zachow S, Sharma GB, et al. Computed tomography analysis of knee pose and geometry before and after total knee arthroplasty. J Biomech 2012; 45: 2215–21. doi: https://doi.org/10.1016/j.jbiomech.2012.06.004 [DOI] [PubMed] [Google Scholar]
- 9.Mozzo P, Procacci C, Tacconi A, Martini PT, Andreis IA. A new volumetric CT machine for dental imaging based on the cone-beam technique: preliminary results. Eur Radiol 1998; 8: 1558–64. doi: https://doi.org/10.1007/s003300050586 [DOI] [PubMed] [Google Scholar]
- 10.Scarfe WC, Farman AG. What is cone-beam CT and how does it work?. Dent Clin North Am 2008; 52: 707–30. doi: https://doi.org/10.1016/j.cden.2008.05.005 [DOI] [PubMed] [Google Scholar]
- 11.Nemtoi A, Czink C, Haba D, Gahleitner A. Cone beam CT: a current overview of devices. Dentomaxillofac Radiol 2013; 42: 20120443. doi: https://doi.org/10.1259/dmfr.20120443 [DOI] [PMC free article] [PubMed] [Google Scholar]
- 12.Ludlow JB, Ivanovic M. Comparative dosimetry of dental CBCT devices and 64-slice CT for oral and maxillofacial radiology. Oral Surg Oral Med Oral Pathol Oral Radiol Endod 2008; 106: 106–14. doi: https://doi.org/10.1016/j.tripleo.2008.03.018 [DOI] [PubMed] [Google Scholar]
- 13.Nardi C, Borri C, Regini F, Calistri L, Castellani A, Lorini C, et al. Metal and motion artifacts by cone beam CT (CBCT) in dental and maxillofacial study. Radiol Med 2015; 120: 618–26. doi: https://doi.org/10.1007/s11547-015-0496-2 [DOI] [PubMed] [Google Scholar]
- 14.Watanabe H, Honda E, Tetsumura A, Kurabayashi T. A comparative study for spatial resolution and subjective image characteristics of a multi-slice CT and a cone-beam CT for dental use. Eur J Radiol 2011; 77: 397–402. doi: https://doi.org/10.1016/j.ejrad.2009.09.023 [DOI] [PubMed] [Google Scholar]
- 15.Liang X, Lambrichts I, Sun Y, Denis K, Hassan B, Li L, et al. A comparative evaluation of cone beam computed tomography (CBCT) and multi-slice CT (MSCT). Part II: on 3D model accuracy. Eur J Radiol 2010; 75: 270–4. doi: https://doi.org/10.1016/j.ejrad.2009.04.016 [DOI] [PubMed] [Google Scholar]
- 16.Demehri S, Muhit A, Zbijewski W, Stayman JW, Yorkston J, Packard N, et al. Assessment of image quality in soft tissue and bone visualization tasks for a dedicated extremity cone-beam CT system. Eur Radiol 2015; 25: 1742–51. doi: https://doi.org/10.1007/s00330-014-3546-6 [DOI] [PMC free article] [PubMed] [Google Scholar]
- 17.Liang X, Jacobs R, Hassan B, Li L, Pauwels R, Corpas L, et al. A comparative evaluation of cone beam computed tomography (CBCT) and multi-slice CT (MSCT). Part I. On subjective image quality. Eur J Radiol 2010; 75: 265–9. doi: https://doi.org/10.1016/j.ejrad.2009.03.042 [DOI] [PubMed] [Google Scholar]
- 18.Koivisto J, Kiljunen T, Wolff J, Kortesniemi M. Assessment of effective radiation dose of an extremity CBCT, MSCT and conventional X ray for knee area using MOSFET dosemeters. Radiat Prot Dosimetry 2013; 157: 515–24. doi: https://doi.org/10.1093/rpd/nct162 [DOI] [PubMed] [Google Scholar]
- 19.Turunen MJ, Töyräs J, Kokkonen HT, Jurvelin JS. Quantitative evaluation of knee subchondral bone mineral density using cone beam computed tomography. IEEE Trans Med Imaging 2015; 34: 2186–90. doi: https://doi.org/10.1109/tmi.2015.2426684 [DOI] [PubMed] [Google Scholar]
- 20.Honkanen JT, Danso EK, Suomalainen JS, Tiitu V, Korhonen RK, Jurvelin JS, et al. Contrast enhanced imaging of human meniscus using cone beam CT. Osteoarthritis Cartilage 2015; 23: 1367–76. doi: https://doi.org/10.1016/j.joca.2015.03.037 [DOI] [PubMed] [Google Scholar]
- 21.Thawait GK, Demehri S, AlMuhit A, Zbijweski W, Yorkston J, Del Grande F, et al. Extremity cone-beam CT for evaluation of medial tibiofemoral osteoarthritis: initial experience in imaging of the weight-bearing and non-weight-bearing knee. Eur J Radiol 2015; 84: 2564–70. doi: https://doi.org/10.1016/j.ejrad.2015.09.003 [DOI] [PMC free article] [PubMed] [Google Scholar]
- 22.Keshmiri A, Maderbacher G, Baier C, Sendtner E, Schaumburger J, Zeman F, et al. The influence of component alignment on patellar kinematics in total knee arthroplasty. Acta Orthop 2015; 86: 444–50. doi: https://doi.org/10.3109/17453674.2015.1005907 [DOI] [PMC free article] [PubMed] [Google Scholar]
- 23.Berger RA. Rubash HE. Rotational instability and malrotation after total knee arthroplasty. Orthop Clin North Am 2001; 32: 639–47. doi: https://doi.org/10.1016/s0030-5898(05)70233-9 [DOI] [PubMed] [Google Scholar]
- 24.Saini S, Sharma R, Levine LA, Barmson RT, Jordan PF, Thrall JH. Technical cost of CT examinations. Radiology 2001; 218: 172–5. doi: https://doi.org/10.1148/radiology.218.1.r01ja01172 [DOI] [PubMed] [Google Scholar]
- 25.Christell H, Birch S, Hedesiu M, Horner K, Ivanauskaité D, Nackaerts O, et al. Variation in costs of cone beam CT examinations among healthcare systems. Dentomaxillofac Radiol 2012; 41: 571–7. doi: https://doi.org/10.1259/dmfr/22131776 [DOI] [PMC free article] [PubMed] [Google Scholar]
- 26.De Valk EJ, Noorduyn JC, Mutsaerts EL. How to assess femoral and tibial component rotation after total knee arthroplasty with computed tomography: a systematic review. Knee Surg Sports Traumatol Arthrosc 2016; 24: 3517–28. doi: https://doi.org/10.1007/s00167-016-4325-5 [DOI] [PubMed] [Google Scholar]
- 27.Figueroa J, Guarachi JP, Matas J, Arnander M, Orrego M. Is computed tomography an accurate and reliable method for measuring total knee arthroplasty component rotation? Int Orthop 2016; 40: 709–14. doi: https://doi.org/10.1007/s00264-015-2917-1 [DOI] [PubMed] [Google Scholar]
- 28.Hirschmann MT, Iranpour F, Konala P, Kerner A, Rasch H, Cobb JP, et al. A novel standardized algorithm for evaluating patients with painful total knee arthroplasty using combined single photon emission tomography and conventional computerized tomography. Knee Surg Sports Traumatol Arthrosc 2010; 18: 939–44. doi: https://doi.org/10.1007/s00167-010-1070-z [DOI] [PubMed] [Google Scholar]
- 29.Rasch H, Falkowski AL, Forrer F, Henckel J, Hirschmann MT. 4D-SPECT/CT in orthopaedics: a new method of combined quantitative volumetric 3D analysis of SPECT/CT tracer uptake and component position measurements in patients after total knee arthroplasty. Skeletal Radiol 2013; 42: 1215–23. doi: https://doi.org/10.1007/s00256-013-1643-2 [DOI] [PubMed] [Google Scholar]
- 30.Roper GE, Bloemke AD, Roberts CC, Spangehl MJ, Clarke HD. Analysis of tibial component rotation following total knee arthroplasty using 3D high definition computed tomography. J Arthroplasty 2013; 28: 106–11. doi: https://doi.org/10.1016/j.arth.2013.04.053 [DOI] [PubMed] [Google Scholar]
- 31.Kim JI, Chun SH, Han HS, Lee S, Lee MC. Femoral component rotations in different gap tensions in total knee arthroplasty: a prospective randomized controlled trial. Knee 2017; 24: 439–46. doi: https://doi.org/10.1016/j.knee.2017.01.003 [DOI] [PubMed] [Google Scholar]
- 32.Silva A, Pinto E, Sampaio R. Rotational alignment in patient-specific instrumentation in TKA: MRI or CT?. Knee Surg Sports Traumatol Arthrosc 2016; 24: 3648–52. doi: https://doi.org/10.1007/s00167-014-3394-6 [DOI] [PubMed] [Google Scholar]
- 33.Manjunath KS, Gopalakrishna KG, Vineeth G. Evaluation of alignment in total knee arthroplasty: a prospective study. Eur J Orthop Surg Traumatol 2015; 25: 895–903. doi: https://doi.org/10.1007/s00590-015-1638-x [DOI] [PubMed] [Google Scholar]
- 34.Schulze R, Heil U, Gross D, Bruellmann DD, Dranischnikow E, Schwanecke U, et al. Artefacts in CBCT: a review. Dentomaxillofac Radiol 2011; 40: 265–73. doi: https://doi.org/10.1259/dmfr/30642039 [DOI] [PMC free article] [PubMed] [Google Scholar]
- 35.Benic GI, Sancho-Puchades M, Jung RE, Deyhle H, Hämmerle CH. In vitro assessment of artifacts induced by titanium dental implants in cone beam computed tomography. Clin Oral Implants Res 2013; 24: 378–83. doi: https://doi.org/10.1111/clr.12048 [DOI] [PubMed] [Google Scholar]
- 36.Nardi C, Molteni R, Lorini C, Taliani GG, Matteuzzi B, Mazzoni E, et al. Motion artefacts in cone beam CT: an in vitro study about the effects on the images. Br J Radiol 2016; 89: 20150687. doi: https://doi.org/10.1259/bjr.20150687 [DOI] [PMC free article] [PubMed] [Google Scholar]
- 37.Meijer MF, Boerboom AL, Stevens M, Bulstra SK, Reininga IH. Assessment of prosthesis alignment after revision total knee arthroplasty using EOS 2D and 3D imaging: a reliability study. PLoS One 2014; 23: e104613. doi: https://doi.org/10.1371/journal.pone.0104613 [DOI] [PMC free article] [PubMed] [Google Scholar]
- 38.Marimuthu K, Chen DB, Harris IA, Wheatley E, Bryant CJ, MacDessi SJ. A multi-planar CT-based comparative analysis of patient-specific cutting guides with conventional instrumentation in total knee arthroplasty. J Arthroplasty 2014; 29: 1138–42. doi: https://doi.org/10.1016/j.arth.2013.12.019 [DOI] [PubMed] [Google Scholar]
- 39.Shao JJ, Parker Vail T, Wang QJ, Shen H, Chen YS, Wang Q, et al. Anatomical references for tibial sagittal alignment in total knee arthroplasty: a comparison of three anatomical axes based on 3D reconstructed CT images. Chin Med J (Engl) 2013; 126: 3840–4. [PubMed] [Google Scholar]
- 40.Berger M, Müller K, Aichert A, Unberath M, Thies J, Choi JH, et al. Marker-free motion correction in weight-bearing cone-beam CT of the knee joint. Med Phys 2016; 43: 1235–48. doi: https://doi.org/10.1118/1.4941012 [DOI] [PMC free article] [PubMed] [Google Scholar]