

Abstract
Blood coagulation is a finely regulated physiological process culminating with the factor Xa (FXa)-mediated conversion of the prothrombin (ProT) zymogen to active α-thrombin (αT). In the prothrombinase complex on the platelet surface, FXa cleaves ProT at Arg-271, generating the inactive precursor prethrombin-2 (Pre2), which is further attacked at Arg-320–Ile-321 to yield mature αT. Whereas the mechanism of physiological ProT activation has been elucidated in great detail, little is known about the role of bacterial proteases, possibly released in the bloodstream during infection, in inducing blood coagulation by direct proteolytic ProT activation. This knowledge gap is particularly concerning, as bacterial infections are frequently complicated by severe coagulopathies. Here, we show that addition of subtilisin (50 nm to 2 μm), a serine protease secreted by the non-pathogenic bacterium Bacillus subtilis, induces plasma clotting by proteolytically converting ProT into active σPre2, a nicked Pre2 derivative with a single cleaved Ala-470–Asn-471 bond. Notably, we found that this non-canonical cleavage at Ala-470–Asn-471 is instrumental for the onset of catalysis in σPre2, which was, however, reduced about 100–200-fold compared with αT. Of note, σPre2 could generate fibrin clots from fibrinogen, either in solution or in blood plasma, and could aggregate human platelets, either isolated or in whole blood. Our findings demonstrate that alternative cleavage of ProT by proteases, even by those secreted by non-virulent bacteria such as B. subtilis, can shift the delicate procoagulant–anticoagulant equilibrium toward thrombosis.
Keywords: coagulation factor, infection, proteolysis, prothrombin, serine protease
Introduction
Blood coagulation is a finely regulated physiological process that culminates with the factor Xa-mediated conversion of the prothrombin (ProT)3 zymogen to the active α-thrombin (αT) enzyme, which in turn is responsible for the generation of insoluble fibrin and activation of platelets via the GpIbα–PAR1 pathway (1, 2). ProT (∼72 kDa) is a vitamin K-dependent glycoprotein produced in the liver and circulating at a relatively high plasma concentration (0.1 mg/ml) (3). The domain architecture of ProT includes a Gla domain (residues 1–46), a kringle-1 (residues 65–143) and a kringle-2 (residues 170–248) domain, and a chymotrypsin-like protease domain (residues 285–579) connected by three intervening linker regions (Lnk-1, -2, and -3) (4). Isolated factor Xa (FXa) has low intrinsic ProT-converting activity, but when it is assembled in the presence of Ca2+ with cofactor Va in the prothrombinase complex on the platelet surface, its ability to activate ProT is increased by about 5 orders of magnitude (5). FXa cleaves ProT in a concerted manner at two sites, i.e. Arg-271 and Arg-320, but the order of peptide bond cleavage is highly context-dependent. On the platelet surface, FXa first cleaves ProT at Arg-271 generating the inactive precursor prethrombin-2 (Pre2), which is attacked by FXa at Arg-320 to generate the active αT species, formed by the polypeptide chains Thr-272–Arg-320 and Ile-321–Glu-579 (6). The N-terminal chain undergoes further autoproteolytic cleavage at Arg-284–Thr-285 to yield the mature αT. At variance, on the membrane of red blood cells, FXa first cleaves ProT at Arg-320, generating the catalytically active meizothrombin, and then at Arg-271 to generate the mature αT (7). Notably, αT is formed by the A-chain (residues 285–320) and the B-chain (residues 321–579), connected by the disulfide bridge Cys-293–Cys-439, and differs from the immediate zymogen Pre2 only in the cleaved Arg-320–Ile-321 bond and for the absence of the fraying N-terminal segment Thr-272–Arg-284 (8).
It is widely accepted that the route to ProT activation follows the classical mechanism of trypsinogen activation established earlier by the seminal work of Bode and Huber (9), whereby cleavage of the Arg-320–Ile-321 allows the formation of a critical salt bridge between the positive Nα-ammonium group of the newly generated Ile-321–Val-322 segment and the negative side chain of Asp-524. This electrostatic coupling triggers a large conformational change leading to the formation/stabilization of the substrate-binding sites and oxyanion hole required for catalysis. According to the model, the effect of salt bridging is mainly conformational (10), as the zymogen exists in unfavorable conformational equilibrium between inactive (E*) and active (E) forms, and Ile-321–Asp-524 salt bridge formation is thought to stabilize the active E form (11). For the different zymogens, the pre-existing E ↔ E* equilibrium is variably shifted to the E* form with equilibrium constants (Keq) ranging from 108 (trypsinogen) (12) to 7 (tissue plasminogen activator) (13). For Pre2, a Keq of 10 has been recently determined (14). An indirect, albeit stringent, proof of the existence of the E ↔ E* equilibrium in ProT is that protein binding to thrombin precursors can effectively stabilize the active E form, as demonstrated in the case of staphylocoagulase (SC) (15) and von Willebrand factor-binding protein (vWbp) (10), two proteins secreted from the virulent Gram-positive bacterium Staphylococcus aureus exploiting a molecular mimicry mechanism to orient their N-terminal Ile-1–Val-2 dipeptide into the Asp-524 cavity, thus leading to non-proteolytic activation of ProT.
Proteolytic conversion of ProT to meizothrombin or αT can be also performed by exogenous non-physiological activators, such as serine and metallo-proteases present in snake venom (16) or secreted by bacterial cells (17–21). The best characterized proteolytic activator of this group is ecarin, a zinc protease isolated from the venom of the viper Echis carinatus, which cleaves ProT at the same peptide bond as FXa, i.e. Arg-320–Ile-321, generating meizothrombin which is ultimately converted to αT after autolysis at Arg-284 (16), thus resulting in systemic thrombus formation. Nonetheless, little is known about the role that bacterial proteases, possibly released in the bloodstream during infection, might play in inducing blood coagulation by directly activating ProT via proteolysis. This issue is particularly important as sepsis, caused by either Gram-positive and Gram-negative bacteria, is frequently complicated by coagulopathies and, in about one-third of these cases, by disseminated intravascular coagulation, a hypercoagulable state often leading to multiple organ failure and death (22).
In this study, we describe the results of experiments designed to investigate the ability of subtilisin to proteolytically activate ProT and trigger fibrin generation and platelet aggregation. Subtilisin (EC 3.4.21.14) (23) is a serine protease (27.3 kDa) secreted by Bacillus subtilis, a facultative aerobe Gram-positive bacterium that is found in the gastrointestinal tract of humans, lacks obvious pathogenicity (24), and becomes virulent only in immunodeficient subjects (25). Subtilisin is the prototype member of the subtilase family, the second largest family of serine proteases (after the chymotrypsin clan) identified to date, and known members (either pathogenic or non-pathogenic) span across eubacteria, archaebacteria, eukaryotes, and viruses (26). Subtilisins exhibit broad substrate specificity, with a preference to cleave after hydrophobic residues, even though cleavage at basic amino acids is not rare (27). Our results show that addition of subtilisin (50 nm to 2 μm) to whole blood samples is able to bypass the coagulation cascade and induce blood clot formation by directly activating ProT through zymogen cleavage at Arg-271–Thr-272 and Ala-470–Asn-471 peptide bonds. The resulting thrombin-like species, hereafter denoted as σPre2, is able to proteolytically convert fibrinogen into fibrin and to aggregate platelets. Notably, the rise of thrombin-like activity is caused by the alternative cleavage at the Ala-470–Asn-471 bond and subsequent formation of the Asn-471–Asp-524 intramolecular salt bridge. These findings establish a new paradigm for the proteolytic activation of ProT. Furthermore, our data widen the current notion that bacterial infections are positively correlated to thrombotic risk and suggest that even non-virulent bacteria, such as B. subtilis, can shift the delicate procoagulant–anticoagulant equilibrium toward thrombosis.
Results
Limited proteolysis of ProT by subtilisin
The data in Fig. 1A indicate that addition of an aliquot of the proteolysis mixture of ProT with subtilisin to a solution of the αT-specific chromogenic substrate S2238 (28) results in the release of pNA, as documented by the absorbance increase at 405 nm (ΔA405). The initial rate (v0) of S2238 hydrolysis strongly increases with the incubation time of ProT with subtilisin, reaching a maximum after 3–5 h and then slightly decreasing at longer reaction times (Fig. 1B). Notably, under identical experimental conditions, subtilisin did not cleave S2238. These results provide clear-cut evidence that cleavage of ProT zymogen by subtilisin generates thrombin-like species displaying significant catalytic activity. To identify the subtilisin cleavage sites on ProT, non-reducing SDS-PAGE analysis of the proteolysis reaction was conducted at 37 °C in the 1–300-min time range (Fig. 2A). The protein bands were electrotransferred onto Immobilon membrane and sequenced by automated N-terminal Edman degradation. Alternatively, the gel bands were excised, in situ digested with trypsin, and subjected to peptide mass fingerprint analysis by high-resolution LC-MS/MS. Using a different approach, the proteolysis mixture was analyzed by RP-HPLC, and the fractions were characterized by MS/MS (Fig. 2B). The results of these chemical analyses are summarized in Table 1 and schematically reported in Fig. 3A.
Figure 1.

Time-course expression of thrombin-like hydrolytic activity during proteolysis of ProT (A and B) and Pre2 (C and D) by subtilisin. A, ProT (0.1 mg/ml, 350 μl) was treated in TBS added with 5 mm CaCl2 at 37 °C with subtilisin (0.05 μg/ml) at an enzyme/ProT ratio of 1:2000 (w/w). At increasing time points, an aliquot (28 μl) of the proteolysis mixture was added to a solution of the chromogenic substrate S2238 (20 μm) in HBS. The time-course release of pNA was monitored at 37 °C by recording the absorbance increase at 405 nm. The slope of the straight lines was taken as the initial velocity, v0, of S2238 hydrolysis by the active thrombin-like species. B, ●, plot of v0 as a function of the reaction time of ProT with subtilisin at 37 °C. ○, control measurements were as follows: S2238 (20 μm) was incubated at 37 °C with subtilisin (0.05 μg/ml) in the absence of ProT. C, Pre2 was treated under identical experimental conditions as in A. At time points, aliquots (15 μl) of the proteolysis mixture were taken and tested for activity on S2238 substrate. D, ●, plot of v0 as a function of the reaction time of Pre2 with subtilisin at 37 °C. ○, control measurements were carried out as in A. The fitting curves are only intended to help the reader to follow the data points.
Figure 2.

Time-course analysis of the proteolysis reaction of ProT by subtilisin. A, non-reducing electrophoretic analysis of the time-course reaction of ProT (0.1 mg/ml) with subtilisin (0.05 μg/ml) at 37 °C. At time points, aliquots (100 μl, 10 μg) of the proteolysis mixtures were precipitated with cold TCA, analyzed by SDS-PAGE (4–12% acrylamide), and Coomassie stained. std, molecular weight protein standards. B, RP-HPLC analysis of the proteolysis reaction of ProT with subtilisin at 37 °C after a 1-min (black line) and a 10-min (blue line) reaction. Aliquots (20 μg) of the reaction mixtures were loaded onto a C4 analytical column, eluted with an aqueous acetonitrile, 0.1% TFA gradient (dashed line). The chemical identity of material eluted in correspondence of the major peaks was established by high-resolution MS, and mass values are reported in Table 1.
Table 1.
Mass values of the protein fragments generated by limited proteolysis of ProT with subtilisina

a Proteolysis was conducted at 37 °C in TBS, pH 7.4, 5 mm CaCl2. After a 10-min reaction, the proteolysis mixture was fractionated by RP-HPLC (Fig. 2B), and the peptide material was analyzed by high-resolution MS.
b The theoretical mass values are reported in parentheses, and the error on mass determination was always lower than 60 ppm.
Figure 3.

Schematic representation of the subtilisin CS on ProT. A, domain architecture of ProT. The numbers identify the N- and C-terminal ends of the zymogen domains, according to the ProT sequence numbering: Gla, γ-carboxyglutamic acid-rich domain; K1, kringle-1 domain; K2, kringle-2 domain; Pre2, prethrombin-2 domain; NT and CT are the N- and C-terminal fragments of Pre2 derived from cleavage of Pre2 by subtilisin. Non-physiological cleavage sites by subtilisin are on the top side of the ProT sequence, whereas physiological cleavage sites by factor Xa are on the bottom side. B, ribbon drawing of the structure of ProT deletion mutant des(154–167), ProTΔ(154–167) (Protein Data Bank code 5edm) lacking 14 amino acids in the linker-2 region connecting K1 and K2 domains (4). Dashed lines represent unresolved linker regions in the X-ray structure. The cleavage sites are indicated by arrows, whereas SS bonds in Pre2 domain are in yellow. The amino acids forming the active site (A.S.) are in blue. C, B-factor flexibility plot of ProTΔ(154–167). The minor cleavage at CS-4 is indicated by a thinner arrow. Sequences marked in red and identified with small letters (a and b) correspond to those regions in ProTΔ(154–167) which, albeit displaying substantial conformational flexibility, are not cleaved by subtilisin. Segment a encompasses the sequence Ala-197–His-205, which is embedded in a short α-helical secondary structure in the zymogen and therefore is expected to be protected from proteolysis (30). Segment b spans the sequence 512PDEGKRGD519, contributing to the Na+-binding site in mature αT. It is highly charged, and for this reason it does not meet the substrate specificity requirements for subtilisin cleavage (26, 27). Protein structures were visualized with the ViewerPro 4.2 software (Accelerys Inc.), and the B-factor plot was generated using the What-If software (76).
Under limited proteolysis conditions (subtilisin/ProT ratio of 1:2000 w/w) at 37 °C, subtilisin rapidly attacked ProT, migrating in non-reducing SDS-PAGE (4–12% acrylamide) with an apparent molecular mass of about 72 kDa (Fig. 2A). ProT was (almost) completely degraded after a 10-min reaction, and four major bands were generated at 55, 35, 25, and 12 kDa. The 55-kDa band corresponds to fragment Met-152–Glu-579(247) and is generated by cleavage at Ala-151–Met-152 bond in the linker-1 region, i.e. the cleavage site-1 (CS-1) (Fig. 3). Of note, the numbers in parentheses refer to the αT sequence numbering. This fragment contains the K2 and Pre2 domain, and therefore it is equivalent to prethrombin-1 (Pre1), Ser-156–Glu-579(247), an intermediate resulting from the cleavage of ProT by factor Xa at Arg-155 (29). The 35-kDa band originates from cleavage of ProT or Pre1 at Arg-271–Thr-272 bond in the linker-2 region, i.e. the cleavage site-2 (CS-2), and corresponds to the sequence of Pre2, Thr-272–Glu-579(247), a key physiological intermediate during αT generation (6, 29). Albeit unusual, the cleavage at Arg-271 should not be surprising. Subtilisin, indeed, has a preference for large uncharged residues at the primary specificity site (P1), but hydrolysis at peptide bonds containing Lys or Arg at P1 are also frequent (27). The two bands at 25- and 12-kDa result from the cleavage at the peptide bond Ala-470(149a)–Asn-471(149b) in the 148-loop of Pre2, denoted as cleavage site-3 (CS-3) (Fig. 3). Specifically, the 25-kDa band corresponds to the N-terminal fragment Thr-272–Ala-470(149a) of Pre2, denoted as NT, whereas the 12-kDa band corresponds to the C-terminal fragment Asn-471(149b)–Glu-579(247), denoted as CT (Fig. 3A and Table 1). RP-HPLC and MS analysis of the same proteolysis reaction (10 min at 37 °C) (Fig. 2B and Table 1) confirmed the chemical identity of the proteolytic fragments reported by SDS-PAGE and allowed us to identify the presence of minor transient species that are further degraded by subtilisin at longer reaction times, i.e. K2-NT (38,298.4 atomic mass units), F1 (21,732.6 atomic mass units), and K2 (13,093.5 atomic mass units). Whereas K2-NT and F1 appeared as distinct bands in the SDS-PAGE, K2 likely co-migrated with CT (12,348.4 atomic mass units), as their molecular weight differs by only 5%. Notably, when electrophoresis was run on a 14% acrylamide gel, which better resolves low-molecular weight species, K2 and CT bands could be separated (supplemental Fig. S2). Noteworthy, NT and CT fragments are quite resistant to further proteolysis and accumulate at longer reaction times (up to 5 h), whereas other ProT segments, once formed, are rapidly degraded to small fragments not visible in the electrophoresis gel (Fig. 2A).
Despite the broad specificity of subtilisin (27) and the large number of potential cleavage sites in the ProT sequence, under controlled proteolysis, the protease attacks the zymogen at only three sites, i.e. CS-1, CS-2, and CS-3 (Fig. 3, A and B). The unique susceptibility of ProT to subtilisin can be explained on the basis of the zymogen structure (Fig. 3B) (4) and the general structural requirements for limited proteolysis. Peptide bond cleavage, indeed, is only partially dictated by sequence and accessibility properties of the cleavage sites and, to a much greater extent, by their conformational flexibility (30). Notably, the subtilisin cleavage sites in ProT perfectly match with the regions of highest segmental flexibility of the zymogen, as deduced from the B-factor plot of the crystallographic structure in the solid state (4) and single-molecule FRET studies in solution (Fig. 3C) (31). In particular, CS-1 and CS-2 are embedded in the highly dynamic inter-domain linker regions, whereas CS-3 is in the highly flexible 148-loop of the Pre2 domain (Fig. 3) (4, 32), corresponding to the autolysis loop in the mature αT (33). Of note, the structure of ProT we used here is that of the zymogen deletion mutant, ProTΔ(154–167), solved at 2.2-Å resolution and lacking 14 amino acids in the linker-2 region, while retaining the conformational properties of the wild-type ProT in the extended conformation (29, 31). A key aspect that emerges by comparing the time-course increase of hydrolytic activity at 37 °C (Fig. 1B) with the progression of the proteolysis reaction (Fig. 2A) is that cleavage of Pre2 at CS-3 is instrumental for the onset and increase of thrombin-like hydrolytic activity.
Limited proteolysis of rPre2 by subtilisin
To investigate the kinetics of proteolytic zymogen activation by subtilisin solely at the CS-3 site, we performed limited proteolysis experiments on the smallest inactive αT precursor, Pre2. Recombinant human Pre2 (rPre2) was expressed in Escherichia coli, subjected to disulfide oxidative renaturation, and purified to homogeneity by heparin-Sepharose affinity chromatography, as described (34, 35). Limited proteolysis reaction of rPre2 was carried out under experimental conditions identical to those used for ProT. The rate of S2238 hydrolysis (v0) at 37 °C strongly increased in the 0–90-min time range and then decreased at longer reaction times, likely because of further proteolytic degradation (Fig. 1, C and D).
Cleavage of Pre2 by subtilisin was monitored by non-reducing SDS-PAGE (Fig. 4, A–D) and RP-HPLC (Fig. 4F) in the temperature range 5–37 °C. Non-glycosylated, intact rPre2 migrates as a 33-kDa band, and in all trials two major bands were generated at 22 and 13 kDa (Fig. 4, A–D). These bands were identified by automated Edman sequencing of the electroblotted gel bands or by in situ trypsin digestion of the gel bands followed by LC-MS/MS analysis of the tryptic fragments. As already established with ProT (see Fig. 2), these fragments correspond to the non-glycosylated NT and CT fragments of Pre2, respectively, resulting from specific cleavage at the Ala-470(149a)–Asn-471(149b) bond, in the region of highest segment mobility of Pre2 (32). Comparison of the proteolysis reactions of ProT (Fig. 2A) and rPre2 (Fig. 4A), both carried out at 37 °C, reveals that the rate of Pre2 degradation is significantly higher compared with ProT and that the resulting NT and CT fragments from rPre2 are less stable to further proteolysis. This difference can be accounted for by the following: (i) the lower number of subtilisin cleavages sites present on Pre2 structure compared with ProT; (ii) the lack of glycosylation at Asn-60g that in the natural glycosylated ProT is expected protect the zymogen from subtilisin cleavage (30); and (iii) the possible shielding of the 148-loop operated by the N-terminal F1 region, which in the solution structure of ProT has been proposed to fold back on the Pre2 domain (31).
Figure 4.

Time-course analysis of the proteolysis reaction of Pre2 by subtilisin. A–D, electrophoretic analysis of the time course reaction of Pre2 (2.8 μm) with subtilisin (1.8 nm). In all experiments, Pre2 (0.1 mg/ml) was reacted at the indicated temperatures in TBS, containing 5 mm CaCl2, with subtilisin at an enzyme/Pre2 ratio of 1:2000 (w/w). At time points, aliquots (50 μl, 5 μg) of the proteolysis mixtures were precipitated with cold TCA, analyzed by SDS-PAGE (4–14% acrylamide) under non-reducing conditions, and Coomassie-stained. std, molecular weight protein standards. E, kinetics of the of subtilisin-catalyzed proteolysis of Pre2, as determined by densitometric analysis of residual intact Pre2 in the gels reported in A–D. The data points were fitted with Equation 1, yielding kcat/Km values as indicated. F, representative RP-HPLC plots of the proteolysis reaction of Pre2 with subtilisin after a 10-min reaction at 37 °C (black line) and after 90 min at 10 °C (blue line). Aliquots (20 μg) of the reaction mixtures were loaded onto a C4 analytical column, eluted with a linear aqueous, 0.1% TFA gradient (dashed line). The chemical identity of the protein material eluted from the chromatographic peaks was established by N-terminal sequencing and LC-MS/MS analysis as follows: Pre2, prethrombin-2; NT, fragment Thr-272–Ala-470; CT, fragment Asn-471–Glu-579; NT*, fragment NT nicked at the peptide bond Tyr-316–Ile-317. G, kinetics of subtilisin-catalyzed proteolysis of Pre2 at 37 °C monitored by RP-HPLC. The concentration of residual intact Pre2 at different reaction times was estimated by integrating the area of the chromatographic peak of Pre2, as in F. After data fitting with Equation 1, the kcat/Km value was estimated, as reported.
As expected, the cleavage rate decreased at temperatures <37 °C, whereas the specificity of peptide bond cleavage by subtilisin significantly increased, such that at 10 or 5 °C the protease hydrolyzed Pre2 virtually at the most flexible site, i.e. the Ala-149a–Asn-149b bond. Only at longer reaction times was a very minor band progressively generated, corresponding to the nicked NT* species, resulting from hydrolysis of the peptide bond Tyr-14j–Ile-14k in the fraying N-terminal region of Pre2 (Table 1). At each time point, the residual amount of intact Pre2 was estimated by densitometric analysis of the electrophoretic bands (Fig. 4E), and a specificity constant (kcat/Km) for the hydrolysis of the Ala-149a–Asn-149b bond at 37 °C was estimated as 0.18 ± 0.02 μm−1·s−1. Interestingly, when proteolysis of rPre2 at 37 °C was monitored by RP-HPLC, identical results were obtained (kcat/Km = 0.20 ± 0.02 μm−1·s−1) (Fig. 4, F and G).
Purification of σPre2
To minimize the presence of residual uncleaved Pre2, proteolysis of ProT with subtilisin was carried out for 24 h at 10 °C. Taking advantage of the heparin-binding properties of thrombin exosite-II, the proteolysis mixture was fractionated by heparin-Sepharose affinity chromatography (Fig. 5A). The fractions were analyzed by non-reducing SDS-PAGE (Fig. 5A, inset) and chemically characterized by LC-MS/MS. The material eluting as a single chromatographic peak at 0.75 m NaCl (i.e. fraction F3) split into two bands at 25 and 12 kDa in non-reducing SDS-PAGE. These bands were identified as the NT and CT fragments of Pre2. The unretained material (i.e. fractions F1 and F2) contained only short peptides (Fig. 5A, inset), not visible in the SDS-PAGE, and was derived from further proteolytic degradation of K1 and K2 domains. Only the material eluting with F3, but not that eluting in correspondence of F1 or F2, was able to release pNA from S2238 (Fig. 5B). Furthermore, the hydrolytic activity of F3 remained constant even after a 24-h storage at 4 °C (Fig. 5B). Altogether, these results provide evidence that hydrolysis of ProT by subtilisin ends up with the generation of a stable and functional complex (hereafter denoted as σPre2) that is formed by the NT and CT fragments and is held together by non-covalent forces (Fig. 3, B, and C). For preparative purposes, σPre2 was also prepared from recombinant Pre2 incubated for 15 h at 5 °C, using the same zymogen/protease molar ratio as at 37 °C (data not shown).
Figure 5.

Purification and storage stability of σPre2. A, purification of σPre2 by heparin-Sepharose affinity chromatography. For micro-preparative purposes, a ProT solution (300 μg, 0.1 mg/ml) was treated for 24 h at 10 °C with subtilisin (0.05 μg/ml) in TBS, added with 5 mm CaCl2. The reaction mixture was loaded onto a HiTrap (0.7 × 2.5 cm) heparin-Sepharose column, which was equilibrated with TBS and then eluted with a gradient of NaCl (- - -). The material eluted in correspondence to fractions F1 to F3 (200 μl) was precipitated with cold TCA for subsequent electrophoretic and functional analyses. Inset, SDS-PAGE (4–14% acrylamide) of the fractions eluted from the affinity column, under non-reducing conditions and Coomassie staining. B, hydrolytic activity of the fractions eluted from heparin-Sepharose column. Aliquots (60 μl) of F1 (green circle), F2 (blue circle), and F3 (black circle) fractions, as in A, were immediately added to an S2238 solution (20 μm) in HBS, and the time course release of pNA was monitored at 37 °C by recording the absorbance increase at 405 nm. The storage stability of σPre2 was evaluated after incubation of F3 fraction for 24 h at 4 °C (red circle).
Conformational characterization of σPre2
The CD spectrum of αT displays low ellipticity values and two unusual distinct minima at 210 and 228 nm, which are significantly red-shifted compared with those typical of the α-helix structure (208 and 222 nm) (Fig. 6A). As already pointed out in our earlier work (36), the peculiar far-UV CD spectrum of αT also results from the spectroscopic contribution in the far-UV region of the aromatic amino acids and SS bonds present in the thrombin sequence (9 Trp, 11 Tyr, 11 Phe, and 4 cystines) that masks the conformational contribution of the peptide bond chromophores embedded in secondary structure elements. Such effects become more important for those proteins displaying low signal intensity and are most prominent in systems where aromatic groups are clustered in the protein structure (36). The CD spectrum of intact Pre2 (Fig. 6A) differs from that of mature αT by both shape and intensity. These spectral changes reflect the conformational transition underlying the conversion of Pre2 to αT and are likely contributed by rearrangement of some aromatic amino acids, occurring during zymogen activation (Fig. 6C). After hydrolysis of the peptide bond Ala-149a–Asn-149b, the minimum at 226 nm, characteristic of the intact zymogen, is conserved in the spectrum of σPre2, whereas the band of Pre2 at 211 nm becomes more intense and blue-shifted to 208 nm in σPre2. These spectral changes suggest that proteolysis likely induces (partial) unfolding of the region encompassing the autolysis loop.
Figure 6.

Spectroscopic characterization of σPre2, Pre2, and αT. A and B, far-UV CD (A) and fluorescence (B) spectra of purified σPre2 (red line), Pre2 (blue line), and αT. CD spectra were recorded at a protein concentration of 4 μm in PBS. Fluorescence spectra were taken at a protein concentration of 30 nm in TBS, pH 8.0, containing 0.2 m ChCl, after exciting the protein samples at 280 nm. The λmax value of αT and Pre2 (334 nm) is shifted to 340 nm in σPre2. All measurements were carried out at 25 °C, and the resulting spectra were corrected for the corresponding base lines. C, ribbon drawing superposition of Pre2 (3sqe, purple) and αT (1ppb, orange, red). Relevant amino acids side chains are colored cyan for Pre2 and yellow for αT structure. The approximate position of relevant thrombin regions are indicated. The aromatic cluster formed by Trp-148, Trp-215, Trp-60d, and Tyr-60a is evident in the structure of Pre2 (cyan).
At variance with CD, the fluorescence spectrum of Pre2 is almost superimposable to that of mature αT, with a λmax value at 334 nm, whereas the emission of σPre2 is remarkably reduced and red-shifted to 340 nm (Fig. 6B). Both these spectral features are compatible with the flexibilization and exposure of some Trp-residues in σPre2 (37), in agreement with the partial unfolding of σPre2 deduced from CD spectra.
Probing the structure of σPre2 by fluorescence and SPR binding measurements
The conformation of key regions in σPre2 (i.e. the Na+ site, the active-site region, and exosite-1 and -2) was investigated by site-specific ligand binding, measuring the affinity of ligands that are known to specifically bind at a given target site (Fig. 7). The decrease in binding strength, relative to αT, was taken as a strong indication that the conformation of that site was perturbed in σPre2.
Figure 7.

Probing the structure of the Na+ site (A) and active site (B–F) of σPre2 (red circle) and αT (black circle). A, fluorescence measurements of sodium binding to σPre2 and αT. Samples (15 nm, 1.5 ml) of σPre2 and αT in TBS, pH 8.0, containing increasing concentrations of NaCl were excited at 280 nm and constant temperature (25 ± 0.1 °C). The fluorescence intensity was recorded at the emission λmax of the proteins, i.e. 334 nm for αT and 340 nm for σPre2. The data are expressed as F − F0, where F0 is the fluorescence intensity in the absence of NaCl. The data points were interpolated with Equation 2 yielding the Kd values for Na+ binding, as indicated. The ionic strength was kept constant at 1 m with ChCl. B, fluorescence binding of PABA to σPre2 and αT. Increasing concentrations of PABA were added to protein samples (200 nm, 1.5 ml). Excitation wavelength was at 336 nm, whereas the fluorescence intensity was recorded at 375 nm. Kd values were obtained by fitting the data points to Equation 2, describing the one-site binding model. Fluorescence binding of FPR (C) and Hir(1–47) (F) to σPre2 and αT is shown. To a solution of σPre2 or αT (100 nm, 1.5 ml) increasing concentrations of ligands were added, and protein samples were excited at 280 nm with FPR or at 295 nm with Hir(1–47). The fluorescence intensity was recorded at the emission λmax of αT (334 nm) or σPre2 (340 nm). The data points relative to the binding of FPR to σPre2 and αT and those of Hir(1–47) binding to σPre2 were interpolated with Equation 2, whereas the binding of Hir(1–47) to αT were fitted to Equation 3, describing the tight binding model. D and E, inhibition of αT and σPre2 by PPACK. D, progress curves of pNA generation by αT (black lines) and σPre2 (red lines) in the absence (dashed lines) and presence (continuous lines) of PPACK. Aliquots (400 μl) of αT or σPre2 stock solutions were added at 37 °C in HBS, pH 7.4, to a solution of substrate (20 μm) and PPACK, as indicated. At each time point, the rate of pNA release (v) was estimated from the slope of the tangent lines (gray) to the progress curve. E, plot of vt/v0 versus time. The data points were interpolated with Equation 9 to yield the values of kobs and kon for PPACK inhibition of αT and σPre2.
Na+ site
The affinity of Na+ for αT and σPre2 was determined by measuring the change of fluorescence intensity at the emission λmax (Fig. 7A). The binding of Na+ to αT leads to an increase of the fluorescence signal, allowing us to estimate a Kd of 21 ± 3 mm at 25 °C, identical to that reported earlier (38). Conversely, increasing salt concentrations induced a marked decrease of the fluorescence intensity in σPre2, along with a reduction of the affinity for Na+ by about 20-fold, compared with αT. These results clearly indicate that the Na+-binding site in σPre2 is heavily compromised and suggest that ion binding to σPre2 is irrelevant at physiological Na+ concentrations.
Active site
The active-site region was probed by measuring the affinity of σPre2 and αT for inhibitors having different size and affinity for thrombin and mapping different sub-sites in the protease catalytic region, i.e. p-aminobenzamidine (PABA), the tripeptide (d)-Phe-Pip-Arg-OH (FPR), (d)-Phe-Pro-Arg-chloromethyl ketone (PPACK), and the hirudin N-terminal domain 1–47 (Hir(1–47)). PABA is a positively charged small molecule, selectively binding to Asp-189, which is located at the bottom of the primary substrate specificity site S1 of chymotrypsin-like proteases (39). At variance, FPR extensively penetrates into thrombin subsites, orienting Arg-3 side chain into the S1 site, the pipecolyl moiety (Pip2) toward the S2 site (shaped by Tyr-60a and Trp-60d), and (d)-Phe-1 in the apolar S3 site (formed by Leu-99, Ile-174, and Trp-215) (33). PPACK, the chloromethyl ketone analogue of FPR, is the most specific affinity label for thrombin, such that even small changes in the conformation of the substrate recognition sites and/or protease catalytic amino acids dramatically reduces the inhibitory potency (33, 40). The catalytic Ser-195 γO atom in the αT active site attacks the ketone group of the inhibitor to form the hemiketal anion, which reacts with the nucleophile His-57 ϵN at the chloromethyl group to release the chloride ion leaving group (33). This results in irreversible inhibition of αT by covalent cross-linking. Hir(1–47) is a potent and specific inhibitor of αT that binds to the S2 and S3 sites and covers the loop regions surrounding the active site, i.e. the autolysis loop, the 60-loop shaping the S2 site, and the 180- and 220-loop forming the Na+-binding site (41, 42).
Whereas the binding of PABA was monitored by measuring the increase of the ligand quantum yield, the affinity of FPR and Hir(1–47) was determined by recording the fluorescence changes that the ligands evoked in σPre2 or αT. For PPACK inhibition, the pseudo-first order association rate constant, kon, for αT and σPre2 was determined by measuring the time-dependence decrease in the rate of substrate hydrolysis at a fixed inhibitor concentration, where kon is the best parameter for quantifying the potency of covalent inhibition (40, 43). Our data indicate that σPre2 binds to small reversible inhibitors, i.e. PABA and FPR, with an affinity identical (±1.7-fold) to that of mature αT (Fig. 7, B and C). Likewise, αT and σPre2 are irreversibly inhibited by PPACK with the same association rate constant (kon = 1.6–2.0 μm−1·s−1) (Fig. 7, D and E). Conversely, the affinity of σPre2 for the larger inhibitor Hir(1–47) was reduced by >6-fold (Fig. 7F).
From the comparison of inhibitor structures and their binding mode to thrombin, it emerges that the geometry of the catalytic site and substrate recognition sites of αT are largely conserved in σPre2, whereas the conformation of the regions surrounding the protease-active site is perturbed in the nicked species.
Exosite-1 and -2
The conformational state of σPre2 exosites was probed by exosite-specific binders. Hirugen, i.e. the C-terminal segment 54–65 of hirudin HV1, was used as a safe exosite-I ligand (38), whereas the C-terminal peptide segment 268–282 of the αT receptor on platelets, glycoprotein Ibα (GpIbα), was used as a specific exosite-II binder (44, 45). The affinity of hirugen for σPre2 decreased by about 9-fold compared with αT (Fig. 8A), suggesting that the structure of exosite-1 in σPre2 is significantly perturbed. Contrary to what was observed with mature αT in our recent work (38), incubation of σPre2 with saturating concentrations of hirugen did not enhance the affinity of the nicked species for Hir(1–47). In fact, a similar Kd value for the binding of Hir(1–47) to σPre2 was obtained either in the absence (Kd = 0.61 ± 0.10 μm) or presence (Kd = 0.54 ± 0.14 μm) of hirugen.4 This is a clear-cut indication that in σPre2 the positive allosteric linkage, coupling exosite-1 to the opening of active site, is essentially lost (46, 47). The affinity of σPre2 or αT for GpIbα(268–282) was measured by immobilizing the synthetic peptide biotinyl-PEG-GpIbα(268–282) (supplemental Fig. S1) onto a neutravidin-coated C1 sensor chip (see “Experimental procedures”) and injecting increasing concentrations of σPre2 or αT (Fig. 8B). SPR data in Fig. 8, B–D, indicate that σPre2 and αT share similar affinity for GpIbα(268–282), suggesting that αT exosite-2 is not significantly altered in the subtilisin-nicked species.
Figure 8.

Probing the structure of exosite-1 (A) and -2 (B–D) of σPre2 (red circle) and αT (black circle). A, binding of hirugen to σPre2 and αT. Solutions (1.5 ml) of σPre2 (150 nm) or αT (50 nm) were added with increasing hirugen concentrations. The protein samples were excited at 280 nm, and the fluorescence intensity was recorded at the λmax of the two enzymes, i.e. 334 nm for αT and 340 nm for σPre2. The data points were interpolated with Equation 2. All fluorescence measurements were carried out in HBS at 37 °C. B–D, binding of GpIbα(268–282) to σPre2 and αT. B, scheme of biotinyl-PEG-GpIbα(268–282) peptide anchoring onto a neutravidin-coated C1 sensor chip. C, SPR sensograms relative to the binding of σPre2 to immobilized biotinyl-PEG-GpIbα(268–282). D, plot of RUmax versus the concentration of σPre2 or αT injected in the mobile phase. SPR measurements were carried out at 25 °C in HBS-EP+, and Kd values were obtained by fitting the data points to Equation 4.
A general trend emerging from the binding measurements is that different ligands (i.e. Na+, FPR, Hir(1–47), and hirugen), mapping different regions on thrombin, induce similar but opposite fluorescence changes in σPre2 and αT (Figs. 7, A–C and F, and 8A), whereby all the ligands tested increase the fluorescence intensity of αT and, instead, decrease that of σPre2. This is a clear-cut indication that the conformational changes induced by ligand binding in σPre2 are intrinsically different from those triggered in αT structure. Nevertheless, for a correct interpretation of these results, experimental determination of σPre2 structure is needed.
Functional characterization of σPre2
To better characterize the substrate specificity of σPre2 compared with mature αT, the two species were separately incubated with substrates specific for αT (S2238) (28), aPC (S2366) (48), or factor Xa (S2765) (49). The results in Fig. 9A clearly indicate that the specificity of σPre2 is qualitatively identical to that of αT, both cleaving the thrombin-specific substrate S2238 with the highest rate. Michaelis-Menten treatment of S2238 hydrolysis by σPre2 and αT reveals that σPre2 hydrolyzes S2238 with an efficiency (kcat/Km) of 165-fold lower than αT, and importantly, this was mainly due to a selective decrease (by 124-fold) of the catalytic constant (kcat), whereas the Michaelis constant (Km) was only slightly increased (by 1.4-fold) (Fig. 9B and Table 2). For αT, Km can be approximated to the dissociation constant (Kd) of the enzyme–substrate complex (50). Hence, the invariance of Km strongly suggests that the substrate specificity sites in σPre2 are fully formed and recognize S2238 with an affinity identical to that of mature αT. This conclusion is fully consistent with the results of fluorescence and enzyme activity measurements, showing that FPR has the same affinity for αT and σPre2 (Fig. 7C) and that PPACK irreversibly inhibits the two enzymes with the same kon (Fig. 7, D and E). These findings and the marked decrease of kcat we have measured for S2238 hydrolysis by σPre2 suggest that the catalytic events (following the early binding step) are altered in the nicked species. However, this should not be surprising. Indeed, although FPR binding and PPACK inhibition data provide a strong indication that σPre2 strictly retains the precise stereochemistry and reactivity of the amino acids in the catalytic triad (i.e. His-57, Asp-102, and Ser-195) of αT, these residues belong to physically distinct (albeit interacting) fragments in σPre2. In particular, His-57 and Asp-102 are located in the NT fragment, whereas Ser-195 is in the CT fragment (Fig. 3B). This arrangement could therefore perturb the optimal coupling of the active-site amino acids during the catalytic reactions leading to peptide bond hydrolysis and product release, with a resulting decrease of kcat.
Figure 9.

Substrate specificity and catalytic efficiency of σPre2 and αT on S2238, protein C, fibrinogen, and PAR1(38–60). A, substrate specificity of σPre2. Purified σPre2 (red circle) (30 nm, final concentration) was added to solutions of chromogenic substrates (20 μm) in HBS at 37 °C, each specific for αT (S2238), aPC (S2366), or factor Xa (S2765), and the release of pNA was monitored at 405 nm. For comparison, the activity of 100 pm human αT (black circle) on the same substrates is also reported. B, determination of the kinetic constants of S2238 hydrolysis by σPre2. The initial rate of pNA release from S2238 (20 μm) by σPre2 (30 nm, red circle) and αT (50 pm, black circle) was measured at 37 °C in HBS, 0.1% PEG (200 μl, final volume). From the interpolation of the data points with the Michaelis-Menten equation (Equation 5), kcat and Km values were obtained as best-fit parameters (Table 2). C, aPC generation by αT (black circle) or σPre2 (red circle). To a solution of PC (50 nm) in HBS, pH 7.5, 5 mm CaCl2 at 37 °C in the presence of TM (10 nm) and S2366 (40 μm) were added aliquots of αT or σPre2, as indicated. The concentration of pNA released from S2366 by aPC was monitored at 405 nm in a continuous assay. The resulting progress curves were analyzed as in Ref. 54 (continuous lines) to extract the values of kcat/Km relative to PC activation by αT or σPre2 (Table 2). D, release of fibrinopeptides A and B from human fibrinogen. The release of FpA (black and red circles) and FpB (black and red squares) from human fibrinogen (0.35 μm) by σPre2 (30 nm) (red circle, red square) or αT (0.3 nm) (black circle, black square) was carried out at 37 °C in HBS, and quantified by RP-HPLC (see “Experimental procedures”). Interpolation of the data points with Equations 6 and 7 yielded the apparent specificity constants (kcat/Km) of FpA and FpB release for σPre2 and αT (Table 2). E, cleavage of PAR1(38–60). The cleavage of PAR1(38–60) peptide (1 μm) by σPre2 (10 nm) (red circle) or αT (0.1 nm) (black circle) was carried out at 25 °C in HBS. The time course of PAR1(42–60) fragment release was quantified by RP-HPLC, and the data points were fitted with Equation 8, describing the kinetics of product formation under pseudo-first order conditions. For clarity, the lower and upper time scale refers to the experiment run with σPre2 (red circle) and αT (black circle), respectively. The estimated kcat/Km values are reported in Table 2.
Table 2.
Substrate specificity of σPre2 and αT
The kinetic constants relative to the hydrolysis of thrombin substrates were extracted by interpolating the data points in Fig. 9, as detailed under “Experimental procedures” and the legend to Fig. 9.
| σPre2 |
αT |
|||||
|---|---|---|---|---|---|---|
| kcat | Km | kcat/Km | kcat | Km | kcat/Km | |
| s−1 | μm | (μm−1·s−1) | s−1 | μm | μm−1·s−1 | |
| S2238 | 0.86 ± 0.04 | 10.0 ± 1.3 | 0.09 ± 0.01 | 106.6 ± 2.2 | 7.2 ± 0.5 | 14.8 ± 0.03 |
| kcat/Km (μm−1·s−1) | kcat/Km (μm−1·s−1) | |||||
| FbpA | 0.042 ± 0.001 | 12.5 ± 0.6 | ||||
| FbpB | 0.036 ± 0.008 | 3.7 ± 0.8 | ||||
| PAR1(38–60) | 0.044 ± 0.005 | 43.3 ± 1.5 | ||||
| kcat/Km (mm−1·s−1) | kcat/Km (mm−1·s−1) | |||||
| PC | 0.803 ± 0.012 | 190.1 ± 5.2 | ||||
The catalytic competence of σPre2 was also tested on more complex substrates, i.e. protein C (PC), fibrinogen (Fb), and PAR1, by measuring the efficiency of active PC (aPC) generation in the presence of the cofactor thrombomodulin (TM) (Fig. 9C), fibrinopeptide (FpA and FpB) release (Fig. 9D), and cleavage of PAR1(38–60) peptide (Fig. 9E). The corresponding kinetic parameters are reported in Table 2. Fb and PAR1 both interact with thrombin at either exosite-1 or the active site (1, 2). At variance, PC binds exclusively to the protease-active site, and TM accelerates thrombin-catalyzed PC hydrolysis by interacting with αT exosite-1 and allosterically modifying the conformation of both the protease and zymogen for efficient PC cleavage (51). Notably, PAR1(38–60) reproduces the substrate properties of the extracellular domain of PAR1 on platelets, as it contains both the exosite-1-binding sequence and the scissile bond Arg-41–Ser-42 for αT (52, 53). The efficiency with which αT or σPre2 converts PC zymogen to the active aPC was determined by a continuous assay, measuring pNA release from the aPC-specific substrate S2366 (54). Our data indicate that in the presence of TM σPre2 cleaves PC with an efficiency about 230-fold lower than αT. The kinetics of fibrinopeptide release was analyzed using Shafer's model (55), according to which a highly specific cleavage at the Aα Fb chain by αT leads to the rapid release of FpA and formation of fibrin I monomers that aggregate to form fibrin I protofibrils. A second cleavage at the Bβ chain of fibrin I monomers then leads to the slower release of FpB and formation of fibrin II protofibrils, which then aggregate to form the fibrin clot. The specificity constants (kcat/Km) relative to the release of FpA and FpB by σPre2 were determined as 300- and 100-fold lower, respectively, than those measured for αT (53). Likewise, the efficiency of PAR1(38–60) hydrolysis by σPre2 was reduced by almost 103-fold, compared with αT.
Altogether, the results of ligand binding and enzymatic activity measurements indicate that although the ligand-binding properties of αT at exosite-2 and the active site are retained in σPre2, molecular recognition at exosite-1 and Na+-site is reduced by 10- and 20-fold, respectively. Furthermore, the decrease in the efficiency of substrate hydrolysis is even more pronounced, especially for those bivalent substrates interacting with the enzyme at both exosite-1 and the active site, i.e. PAR1 and Fb. However, this is also true for PC activation in the presence of TM, where the zymogen binds exclusively at the thrombin active site while the cofactor tightly binds to exosite-1, which is compromised in σPre2 (51). Hence, the drop of PC cleavage by σPre2 is likely the result of the combined effects of the lower catalytic efficiency of σPre2 and the decreased cofactor activity of TM.
σPre2 induces fibrin generation and platelet aggregation
To address the possible relevance of subtilisin on the onset of thrombotic events during bacterial infections, we evaluated the effect of σPre2 on fibrin generation either with purified Fb or human plasma (Fig. 10A), as well as the ability of subtilisin to directly generate fibrin in human plasma via σPre2 formation (Fig. 10B). Finally, the effect of σPre2 on platelet aggregation was studied either on gel-filtered platelets or in whole blood (Fig. 10, C and D).
Figure 10.

Fibrin generation and platelet aggregation induced by σPre2 and αT. A, turbidimetric analysis of fibrin generation induced by 50 nm σPre2 (dashed lines) or 50 nm αT (continuous lines) on purified fibrinogen (black lines) or diluted (1:2) human plasma (red lines). To a human fibrinogen solution (440 nm, 800 μl) in HBS at 37 °C, containing 0.1% PEG-8000, was added αT (50 nm) or σPre2 (50 nm), and the time-course generation of fibrin was monitored by recording the absorbance increase of the solution at 350 nm. With human plasma samples, the absorbance change was recorded at 671 nm (right-hand scale). For clarity, the lower time scale (0–3 min) refers to the experiment run with αT, and the upper time scale (0–150 min) refers to the experiment run with σPre2. The absorbance scale for both experiments is the same (0–0.25 AU). B, turbidimetric analysis of fibrin generation induced by different concentrations of subtilisin (0.25 IU = 2 μm, red line) (50 nm, blue line) on diluted (1:2) plasma. From each clotting curve, the values of Sm, tm, tc, and ΔAmax were extracted, as indicated (Table 3 and “Experimental procedures”). C, impedance aggregometry analysis of platelet aggregation induced by σPre2 or αT at 37 °C in WB (blue line) or GFPs (black line). WB from healthy donors (300 μl; 160,000 platelets/μl) was diluted with HBS (320 μl), containing αT or σPre2 to a final concentration of 0.5 and 50 nm, respectively. A similar procedure was used with GFP (200.000 platelets/μl). D, histogram of the normalized platelets aggregation potency of σPre2 and αT expressed as AUC/[E] ratio, where [E] is the molar enzyme concentration. Each value is the average of single determinations on blood samples from three healthy donors. The error bars correspond to the standard deviation.
Fibrin generation
The time-course formation of fibrin from purified Fb or human plasma was monitored by recording the turbidimetric signal at 350 and 671 nm, respectively (35, 56). The data in Fig. 10A and Table 3 indicate that addition of σPre2 (50 nm) to a purified Fb solution (0.15 mg/ml, ∼400 nm) or to diluted (1:2) human plasma ([Fb] = 3.5 μm) generated similar fibrin clotting curves converging to an identical Amax value. However, in blood plasma, the tc value of σPre2 was prolonged by 1.6-fold compared with isolated Fb, and the maximal rate of fibrin formation (Sm) was ∼4-fold lower. Notably, tc corresponds to the time necessary for the longitudinal elongation of protofibrils, deriving from fibrin monomers after removal of fibrinopeptides. Importantly, the lag phase of fibrin formation by σPre2, either with purified Fb or human plasma, was 100–200-fold higher than that estimated with αT at the same concentration (50 nm) (Table 3), reflecting the lower efficiency of fibrinopeptides release by σPre2 (Fig. 9D). Furthermore, a remarkable (∼3-fold) increase of the Amax value was also observed with σPre2 (Amax = 0.21), compared with αT (Amax = 0.08), where Amax is the maximum turbidity measured when the final fibrin clot is formed, and it is proportional to the square of the average diameter (d) of the fibers (56). The latter result indicates that the fibrin network generated by σPre2 is formed by fewer fibers that, however, are thicker than those produced by the more catalytically efficient αT at the same concentration.
Table 3.
Representative parameters for the fibrin clotting curves generated with isolated fibrinogen or human plasma by σPre2, αT, subtilisin, and ecarin
The parameters of the fibrin clotting curves were extracted from the data reported in Fig. 10, A and B, and the experimental error was ±10%.
| Sma | tmb | tcc | ΔAmaxd | |
|---|---|---|---|---|
| AU·min−1 | min | min | AU | |
| Purified fibrinogene | ||||
| αT (50 nm) | 234.0·10−3 | 0.17 | 0.06 | 0.08 |
| σPre2 (50 nm) | 15.8·10−3 | 10.60 | 6.70 | 0.21 |
| Human plasmaf | ||||
| αT (50 nm) | 8.2·10−3 | 0.16 | 0.05 | 0.08 |
| σPre2 (50 nm) | 4.1·10−3 | 17.10 | 10.90 | 0.21 |
| Human plasmaf | ||||
| Ecarin (2.5 nm) | 55.9·10−3 | 2.40 | 2.10 | 0.41 |
| Subtilisin (2 μm) | 5.2·10−3 | 125 | 82.0 | 0.52 |
| Subtilisin (50 nm) | 9.3·10−4 | 1134 | 840.0 | 0.51 |
a Sm is the value of the maximal slope of the curve.
b tm is the time needed to reach Sm.
c tc is the clotting time and is calculated from the intercept point with the time axis of the tangent line to the curve at tm.
d ΔAmax is the maximal absorbance change when fibrin generation is complete.
e In fibrin generation measurements, the concentration of purified fibrinogen was 400 nM.
f The estimated concentration of fibrinogen in 1:2 diluted human plasma was 3.5 μm.
At this point, the question arises as to whether subtilisin might function like ecarin, inducing the formation in human plasma of proteolytically active thrombin species that can clot fibrin. The data in Fig. 10B provide a clear-cut answer to this question and demonstrate that addition of 0.25 IU of either subtilisin (2 μm and 50 nm) or ecarin (2.5 nm) to diluted (1:2) human plasma induced fibrin generation, even with different time scales. Notably, 4 nm subtilisin was not able to induce plasma clotting in the time range explored (data not shown). A clotting time, tc, of 2.1 min was determined for ecarin (see supplemental Fig. S3), in agreement with our previous results (35), whereas a much longer lag phase was estimated at either 2 μm (tc = 2 h) or 50 nm subtilisin (tc = 14 h) (Table 3). Notwithstanding, the clotting curves in Fig. 10B document that even small subtilisin concentrations (50 nm) are able to clot fibrinogen in human plasma. The dramatic difference in the plasma clotting time, observed between subtilisin and ecarin, can be reasonably accounted for by several factors: (i) the 20-fold lower specificity constant of subtilisin for CS-3 in Pre2 (kcat/Km = 0.18 ± 0.02 μm−1·s−1) (Fig. 4, E and G), compared with ecarin (kcat/Km = 4.1 μm−1·s−1) (57); (ii) the 100–300-fold lower catalytic efficiency of the resulting nicked σPre2 species to hydrolyze Fb, compared with αT (Fig. 9D); and (iii) the presence of physiological serine proteinase inhibitors in human plasma (e.g. α2-antitrypsin, antiplasmin, and α1-proteinase inhibitor), which may irreversibly inhibit subtilisin, without affecting ecarin function (58).
Platelet aggregation
The ability of σPre2 to agglutinate platelets was tested on whole blood (WB) and gel-filtered platelets (GFP) by multiple electrode aggregometry (Fig. 10C). This technique measures the increase of impedance, i.e. the resistance to the passage of alternate current in a medium between two platinum electrodes, which is caused by sticking activated platelets on the electrodes (59). Addition of 50 nm σPre2 or 0.5 nm αT to WB or GFP yielded comparable aggregation curves, i.e. the time-dependent change of the plasma impedance expressed as relative aggregation units (AU). Notably, the more intense signal obtained with both σPre2 and αT on GFP reflects the higher platelets count of GFP (200,000/μl) compared with WB (160,000/μl). Integration of AU over time (10 min) gives the value of the area under the curve (AUC), whereas the ratio AUC/[E] is taken as the platelet aggregation potency of σPre2 or αT, where [E] is the concentration of thrombin-like species. The histograms in Fig. 10D indicate that the aggregation potency of σPre2 on WB and GFP is ∼150- and 200-fold lower than that of αT, respectively. The observation that nanomolar concentrations of σPre2 can still agglutinate platelets is consistent with site-specific binding data showing that peptide bond nicking does not appreciably perturb exosite-2, which is the binding site for thrombin on the platelet receptor GpIbα (Fig. 8, B–D). Likewise, the decrease of the aggregation potency is fully consistent with the marked reduction in the efficiency of PAR1(38–60) hydrolysis by σPre2 (Fig. 9E).
Molecular mechanism of ProT/Pre2 activation by subtilisin
Our data clearly document that αT-like activity appears only after nicking of Ala-149a–Asn-149b bond and subsequent generation of a new N-terminal dipeptide segment, i.e. Asn-149b–Val-149c, on the CT fragment of σPre2. However, the molecular mechanism linking peptide bond cleavage to catalysis remains unknown. Notably, in a previous work (36), we used subtilisin as a probe of the conformational flexibility of the 148-loop in mature αT, in the absence and presence of Na+, and we found the same cleavage site as with ProT and Pre2. To gain more insights into the mechanism of zymogen activation, αT and σPre2 were subjected to carbamylation of the N termini with potassium cyanate (KCNO), a reagent that at physiological pH almost exclusively reacts with the N-terminal α-amino groups of proteins and obliterates the positive charge at the N terminus (R-NH3+) by forming a neutral ureido group, according to the reaction R-NH2 + HNCO → R-NHCONH2, where HNCO is the reactive isocyanic acid in equilibrium with cyanate (NCO−) (60). Notably, at a given solution pH, the carbamylation rate is positively correlated with the amount and accessibility of the unprotonated N-terminal R-NH2 group (61, 62).
At time points, αT or σPre2 solutions (1 μm) were incubated in the absence or presence of KCNO (0.2 m) at 37 °C, and aliquots of these solutions were tested for enzymatic activity on the S2238 substrate. The data in Fig. 11A indicate that, in the presence of cyanate, the relative rate of substrate hydrolysis by either αT (100 pm) or σPre2 (50 nm) decreased with time to different extents. Noteworthy, the reduction of the hydrolysis rate was stronger with σPre2 than with mature αT. After a 1-h reaction with cyanate, for instance, the activity of αT was reduced by only <10%, whereas that of σPre2 was reduced by >50%. As a control, in the absence of KCNO, the rate of hydrolysis remained constantly high. When the effect of cyanate on αT or σPre2 function was analyzed according to the irreversible inhibition model, used above for describing PPACK inhibition (40), a 3-fold higher pseudo-first order inhibition rate constant (kon) was estimated for σPre2 compared with αT (Fig. 11A). The extent of carbamylation of the N termini in αT and σPre2 was estimated by automated Edman sequencing, after a 1-h reaction with KCNO at 37 °C and subsequent reduction and carboxamidomethylation of Cys residues (see under “Experimental procedures”). Edman degradation, indeed, starts only if the terminal Nα-amino group is available, and thus it allows a rough estimate of the % of molecules in a protein sample having free N-terminal ends. Our data indicate that the sequences of the A-chain in αT and that of NT fragment in σPre2 could not be detected, suggesting that in both enzymes the N-terminal end was quantitatively carbamylated and thus fully accessible in the structure of the two enzymes. Conversely, the B-chain was almost quantitatively sequenced (>90%), indicating that the N-terminal Ile-16 in αT was deeply buried in the mature protease structure and thus protected from reaction with cyanate. At variance, in the case of CT in σPre2, only about 50% of the fragment molecules could be sequenced, thus suggesting that the N-terminal Asn-149b was substantially exposed on the σPre2 structure. These findings are fully consistent with enzyme activity data showing that the rate constant of σPre2 inactivation by KCNO is 3-fold higher compared with αT (Fig. 11A) and indicate that Asn-149b at the N terminus of CT in σPre2 is, on average, much more exposed than Ile-16 at the N-terminal end of the B-chain in αT.
Figure 11.

Mechanism of zymogen activation in σPre2 and αT. A, effect of time-course carbamylation of σPre2 on the rate of S2238 substrate hydrolysis. Time-course hydrolysis of σPre2 (open red circle and solid red circle) and αT (open black circle and solid black circle) in the absence and presence of potassium cyanate. Solutions of σPre2 (1 μm) in HBS, pH 7.0, were incubated at 37 °C in the absence (open red circle) and presence (solid red circle) of 0.2 m KCNO. At the indicated time points, aliquots (40 μl; 50 nm final concentration) were taken, and the initial rate (vi) of S2238 (20 μm) hydrolysis was determined in HBS at 37 °C. For comparison, the activity of αT (100 pm, final concentration) determined in the absence (open black circle) and presence (solid black circle) of KCNO is also reported. The data are expressed as the percent residual activity, (vi/v0) × 100, where vi and v0 are the rates of hydrolysis determined at time ti and 0, respectively. After interpolating the kinetic data with Equation 9, describing the irreversible enzyme inhibition under pseudo-first order conditions, the corresponding rate constants (kon) were determined for σPre2 (4.8 × 10⁻² m−1·min−1) and αT (1.6 × 10⁻² m−1·min−1). B, schematic representation of the physiological and non-physiological Pre2 zymogen activation by factor Xa or bacterial subtilisin, respectively. After physiological cleavage of the peptide bond Arg-15–Ile-16 by FXa in Pre2, the newly generated dipeptide Ile-16–Val-17, swings into the 194-cleft and triggers substrate-binding sites and oxyanion hole formation, required for catalysis. Likewise, after non-physiological cleavage by subtilisin at the peptide bond Ala-149a–Asn-149b in the exposed γ-loop of Pre2, the new N-terminal dipeptide Asn-149b–Val-149c can enter the 194-cleft and evoke zymogen activation. C, transparent surface representation of Pre2 showing Asp-194 positioned at the bottom of a deep cleft in ProT structure (Protein Data Bank code 5edm) shaped by the two β-barrels of Pre2. The cleavage sites for FXa (Arg-15–Ile-16) and subtilisin (Ala-149a–Asn-149b) are also indicated.
A key aspect emerging from this work is that the raising of catalytic competence in σPre2 is not a fortuitous result of flexibilization of the 148-loop in Pre2, occurring after peptide bond cleavage, but of a precisely concerted conformational change that is inherently associated with the reactivity of the newly generated N-terminal Asn-149b. Indeed, neutralization of the N-terminal positive charge, even with a small-sized carbamyl group, hinders amidolytic activity of σPre2 (Fig. 11A). As already established for the zymogens of the trypsin family (9), as well as for the physiological activation of ProT by FXa (6, 7, 15, 33), it is possible that the new positive N-terminal segment (Asn-149b–Val-149c), formed after subtilisin cleavage of Pre2, binds to the negatively charged Asp-194 and triggers a conformational transition very similar to that evoked by the Ile-16–Val-17 segment, which is generated after FXa cleavage at Arg-15–Ile-16 bond. Hence, nicking of Pre2 by an endogenous (FXa) or exogenous (subtilisin) protease, albeit occurring at two distinct sites on Pre2 structure, can trigger a common physiological mechanism of zymogen activation (Fig. 11B). Visual inspection of the ProT (5edm) (4) or the Pre2 (3sqe) (32) structure suggests that this may be actually the case (Fig. 11C), as both Asn-149b in σPre2 and Ile-16 in αT are located in unconstrained loop regions, which may become even more flexible after nicking, and (more importantly) at a comparable distance (∼22 Å in αT and ∼16 Å in σPre2) from the critical Asp-194 side chain. The proposed model of σPre2 activation accounts for the higher rate of carbamylation of Asn-149b in σPre2, compared with that of Ile-16 in αT (Fig. 11A). In αT structure, indeed, the NH3+ group of Ile-16 is less amenable to react with cyanate as it is deeply buried in a hydrophobic environment, where it forms a high-energy salt bridge with the carboxylate of Asp-194 (33). This salt bridge is likely weaker in σPre2 because the N-terminal amino group of Asn is 10-fold less basic (pKa(Asn) = 8.72; pKa(Ile) = 9.76) (63) and 260-fold less hydrophobic than that of Ile (logP(Asn) = −2.41; logP(Ile) = −0.03) (63). The lower stability of the salt bridge between Asn-149b and Asp-194 is expected to reduce the residence time of Asn-149b in the Asp-194 cleft and to allow exposure of the N-terminal end, which becomes available for reacting with cyanate (Fig. 11A). In addition, weakening of the Asn-149b–Asp-194 ionic interaction might also have a direct impact on the catalysis of σPre2, altering the efficiency with which electrostatic perturbation of Asp-194 is transmitted long range to the active site. These considerations may also contribute to explain the marked decrease of kcat we have measured for σPre2 compared with αT (Fig. 9B).
Discussion
In the early 1900s it was shown that certain bacteria, especially staphylococci, are able to induce clotting of human blood (64), and since the late 1930s, fibrin deposition has been recognized as a common feature at the sites of bacterial infection (65). Very recently, fibrin generation has been proposed as a host defense mechanism of innate immunity to avoid systemic activation of coagulation by segregating bacterial pathogens in a fibrin network at infection sites (66). However, activation of coagulation can also be seen as a smart evolutionary mechanism, whereby the pathogens exploit the host hemostatic system components to escape immune response and prevent their elimination from the blood by “self-entrapment” within a fibrin clot (67). Beyond these intriguing host–pathogen evolutionary strategies, the pathological activation of coagulation in infectious diseases is associated with high morbidity and mortality (22, 68). Nonetheless, the molecular mechanisms linking bacterial infection to thrombosis have not been fully understood (69). It is generally accepted that coagulopathic complications in sepsis are mainly triggered by surface bacterial lipopolysaccharides (LPS) that interact with Toll-like receptors on monocytes and induce expression of tissue factor, thus activating the “extrinsic” pathway of thrombin generation (66, 69). Intriguingly, LPS are present on Gram-negative bacteria, but they are absent on the surface of Gram-positive bacteria, and infections from the latter group of pathogens are also frequently complicated by severe coagulopathies (68). These observations indirectly suggest that other factors, different from LPS-induced activation of blood coagulation, should be considered for understanding the positive relation existing between sepsis and thrombosis. Mounting evidence, accumulated in the last decades, indicates that microbial pathogens can bypass the coagulation cascade and directly trigger ProT activation either by proteolytic (17–21) or non-proteolytic mechanisms (10, 15). Whereas the non-proteolytic mechanism, leading S. aureus proteins SC and vWbp to conformationally activate ProT, has been elucidated in great detail (10, 15), not much information is available regarding the mechanisms underlying the proteolytic conversion of ProT to thrombin-like active species and on the effect that the ensuing thrombin-like forms have on fibrinogen cleavage (21), fibrin generation, and platelet aggregation (20). In addition, when available, literature data indicate that different proteases (e.g. serine protease, cysteine protease, or metallo-protease) from different bacterial pathogens (e.g. Gram-positive or Gram-negative bacteria) convergently hydrolyze ProT at the canonical Arg-320–Ile-321 cleavage site for FXa, leading to the generation of meizothrombin/desF1-meizothrombin active species or even to the transient generation of mature αT, as in the case of gingipain, an Arg-specific cysteine protease isolated from the pathogenic agent of periodontitis Porphyromonas gingivalis (18).
Our results show that addition of subtilisin (50 nm to 2 μm) is able to bypass the coagulation cascade and induce plasma clot formation and aggregate platelets by directly activating ProT through zymogen cleavage at Ala-151–Met-152 and Arg-271–Thr-272 peptide bonds and at the non-canonical cleavage site Ala-470–Asn-471. The resulting σPre2 species proteolytically converts fibrinogen into fibrin (either in solution or in normal blood plasma) and aggregate platelets (either isolated or in whole blood). σPre2 was purified to homogeneity and thoroughly characterized in terms of chemical composition and conformational and functional properties, allowing us to safely conclude that σPre2 is constituted by NT and CT fragments forming a stable and functional fragment-complementing system, held together only by non-covalent interactions. Notably, the rise of thrombin-like activity is caused by the alternative cleavage at the Ala-149a–Asn-149b bond and subsequent formation of the non-canonical Asn-149b–Asp-194 intramolecular salt bridge. These findings establish a new paradigm for the proteolytic activation of ProT, whereby nicking of Pre2 domain at different sites can evoke a common (physiological) mechanism of zymogen activation. The results reported in this work also indicate that proteases secreted by even non-virulent bacteria, such as B. subtilis, can shift the delicate procoagulant–anticoagulant equilibrium toward thrombosis and pave the way to further investigate the ability of other subtilisin proteases (70), produced by known pathogenic bacteria (e.g. Shiga toxigenic E. coli, Streptococcus pyogenes, Pseudomonas aeruginosa, and Plasmodium falciparum) and sharing high sequence similarity with subtilisin form B. subtilis, to affect blood coagulation.
Experimental procedures
Reagents
Human αT, ProT, PC, and rabbit TM were purchased from Haematologic Technologies (Essex Junction, VT). Subtilisin (EC 3.4.21.62) from B. subtilis, ecarin from Echis carinatus, human plasma fibrinogen, PABA, TFA, PPACK, and KCNO were purchased from Sigma. Recombinant human Pre2 was expressed in E. coli, renatured, and purified as detailed previously (34, 35), and αT was obtained from Pre2 after ecarin activation. Sequencing-grade bovine trypsin was from Promega (Madison, WI). Chromogenic substrates S2238, S2366, and S2765 were purchased from Chromogenix (Bedford, MA). (d)-Phe-Pip-Arg-OH (FPR), hirugen 54GDFEEIPEEY*LQ65 (53), hirudin N-terminal domain 1–47, Hir(1–47) (71), biotinyl-PEG-GpIbα(GDEGDTDLY*DY*Y*PEE (44), where Y* stands for tyrosine phosphate), and PAR1(38–60) 8LDPR↓SFLLRNPNDKYEPFWEDDE60 (52) were synthesized in our laboratory by the solid-phase strategy, using the fluorenylmethyloxycarbonyl-chemistry on a PS3 automated synthesizer (Protein Technologies), purified by RP-HPLC, and chemically characterized by high-resolution mass spectrometry. Reagents for electrophoresis were from Sigma or Bio-Rad. All other salts, solvents, and reagents were of analytical grade and purchased from Sigma or Merck (Darmstadt, Germany).
Limited proteolysis of ProT and Pre2 by subtilisin
ProT or Pre2 (0.1 mg/ml) were reacted with subtilisin (0.05 μg/ml) at different temperatures in 5 mm Tris-HCl, pH 7.4, 0.15 m NaCl, 0.1% PEG-8000 (TBS), containing 5 mm CaCl2. At time intervals, aliquots of proteolysis mixtures were taken, and the protein component was precipitated overnight at −20 °C with 10% ice-cold trichloroacetic acid (TCA) in acetone. After centrifugation, the protein pellet was dissolved with non-reducing sample loading buffer, sonicated for 10 min, analyzed by non-reducing SDS-PAGE (4–12% acrylamide), and then Coomassie-stained. Alternatively, aliquots of the proteolysis mixture were taken and analyzed for hydrolytic activity on the chromogenic substrate S2238 (see below). For Pre2, the kinetics of proteolysis was monitored by either non-reducing SDS-PAGE (4–14% acrylamide) or RP-HPLC. The relative intensity of the Pre2 gel bands, after Coomassie staining, was estimated by densitometric analysis, using a Geliance-600 Chem-Imaging system (PerkinElmer Life Sciences) and ImageJ software. RP-HPLC analyses were performed on a Grace-Vydac (Columbia, MD) C4 (4.6 × 150 mm) analytical column, connected to a Jasco (Tokyo, Japan) 1500 HPLC system. The chromatographic peaks corresponding to intact Pre2 were integrated using the software Borwin. The densitometric or chromatographic data were fitted to Equation 1, describing a pseudo-first order reaction (36),
| (Eq. 1) |
where [S0] and [S] are the Pre2 concentrations at the beginning of the reaction and after time t, respectively, and k is the observed kinetic constant for hydrolysis, obtained as a fitting parameter. Under pseudo-first order conditions, the specificity constant (s = kcat/Km) for the hydrolysis of Pre2 by subtilisin was derived as s = k/[E], where [E] is the protease concentration.
Identification of the subtilisin cleavage sites on ProT and Pre2
The cleavage sites were identified by electroblotting the protein bands, generated from ProT and Pre2, onto an Immobilon membrane (Merck-Millipore, Billerica, MA) and N-terminal sequencing on an automated Procise sequencer (Applied Biosystems, Foster City, CA). Blotting was performed at 4 °C in 10 mm CAPS, pH 10.5, at 50 V for 3 h. Alternatively, the gel bands were excised and subjected to in situ peptide mass fingerprint with trypsin as described (72). After extraction of the tryptic peptides from the gel, the proteolytic mixture was loaded onto a Grace-Vydac (Hesperia, CA) C4 (1 × 10 mm) microbore column connected to an Agilent (Santa Clara, CA) 1290 UHPLC system. The column was eluted at a flow rate of 50 μl/min, with a linear aqueous acetonitrile, 0.1% formic acid gradient, from 15 to 65% in 30 min. The effluent from the column was analyzed on-line by high-resolution mass spectrometry (MS), with respect to mass values and amino acid sequence data. Using a different approach, aliquots of the proteolysis mixture with subtilisin, conducted at 10 °C in TBS without PEG-8000, were taken and analyzed by LC-MS to obtain the accurate mass values of the proteolytic fragments. Analyses were performed in the positive ion mode, using a Waters (Milford, MO) Xevo-G2S Q-TOF mass spectrometer and the software programs MassLynx 4.1 and BioPharmaLynx for data acquisition or analysis.
Purification of σPre2
For micro-preparative purposes, ProT (0.1 mg/ml, 300 μg) was treated with subtilisin (0.05 μg/ml) for 24 h at 10 °C in TBS, containing 5 mm CaCl2. The reaction mixture was then fractionated on a HiTrap (0.7 × 2.5 cm) heparin-Sepharose column (GE Healthcare, Little Chalfont, UK) equilibrated with TBS, containing 0.25 m NaCl, and then eluted with the same buffer, containing 1 m NaCl. The material eluted in correspondence to the major chromatographic peak was collected, stored at −20 °C, and used for subsequent analyses. The chemical identity and homogeneity σPre2 was confirmed by non-reducing SDS-PAGE, RP-HPLC, and high-resolution MS analysis, as described above.
Spectroscopic characterization of σPre2
Protein concentration was determined by UV absorption at 280 nm on a Jasco V-630 spectrophotometer, using a molar absorptivity value (ϵ280 nmM) of 67,161 or 66,424 m−1·cm−1 for commercial and recombinant αT, respectively, and 99,360 and 67,871 m−1·cm−1 for ProT or Pre2/σPre2. The active-site concentration of αT was also determined by titration with hirudin (42) and found to be identical (± 5%) to that determined spectrophotometrically. Far-UV CD spectra were recorded on a Jasco J-810 spectropolarimeter, equipped with a Peltier temperature control system. The spectra were recorded in a 1-mm cell, at a scan speed of 10 nm/min, with a response time of 16 s, and resulted from the average of four accumulations after baseline subtraction. CD data were expressed as the mean residue ellipticity [θ] = θobs·MRW/(10·l·c), where θobs is the observed signal in degrees; MRW is the mean residue weight of recombinant αT (115.03 Da) and Pre2/σPre2 (114.98 Da); l is the cuvette pathlength in cm; and c is the protein concentration in grams/ml. Fluorescence spectra were recorded on a Jasco FP-6500 spectropolarimeter, equipped with Peltier temperature control system, in a 1-cm pathlength cuvette (2 ml internal volume) at a scan speed of 200 nm/min using excitation and emission slits of 5 and 10 nm, respectively. Measurements were carried out at least in duplicate at 25 ± 0.1 °C, and the spectra were subtracted for the corresponding baselines.
Fluorescence binding measurements
For measuring the binding of Na+, incremental volumes of a solution containing 15 nm recombinant αT or σPre2 in TBS, pH 8.0, 1 m choline chloride, were withdrawn and then restored with the corresponding volumes of a solution containing 15 nm αT or σPre2 in TBS, pH 8.0, 1 m NaCl, such that the ionic strength and enzyme concentration were held constant at 1 m and 15 nm, respectively, and the Na+ concentration was increased (38). Samples were excited at 280 nm (25 ± 0.1 °C), and the fluorescence intensity was recorded at the λmax versus [NaCl]. The equilibrium dissociation constants of PABA (ϵ293 nmM = 15 × 103 m−1·cm−1), FPR (ϵ257 nmM = 200 m−1·cm−1), Hir(1–47) (ϵ280 nmM = 2920 m−1·cm−1), and hirugen (ϵ280 nmM = 418 m−1·cm−1) for αT or σPre2 were obtained by adding, under gentle magnetic stirring (30 s), incremental volumes (2–10 μl) of ligand stock solutions in 20 mm HEPES, pH 7.4, 0.15 m NaCl, 0.1% PEG-8000 (w/v) (HBS) to αT or σPre2 solutions in the same buffer. At each ligand concentration, samples were incubated for 2 min at 37 °C and excited at 280 nm, using an excitation/emission slit of 5 and 10 nm. The emission intensity was recorded at the protein λmax, after subtracting the corresponding spectra of the ligands alone. Fluorescence data were corrected for sample dilution, which was always <2% at the end of the titration. Photobleaching was almost eliminated, even after prolonged light exposure, by using a 1-cm pathlength quartz cuvette (2 ml) with two frosted walls that are able to diffuse the incident light inside the sample, thus preventing photodegradation of Trp residues. To prevent inner filter effect (IFE), the optical density of the solution was kept always lower than 0.05 units both at λex and λem (38). For PABA binding, samples were excited at 336 nm, and the emission was recorded at 375 nm, after baseline subtraction and correction for IFE (35). For all ligands tested, except Hir(1–47) binding to αT, the data points were interpolated with Equation 2, describing the single-site binding model (38),
| (Eq. 2) |
In the case of Hir(1–47)-αT interaction, fluorescence data were fitted to Equation 3, describing the tight-binding model (38),
| (Eq. 3) |
where R and L are the total enzyme and ligand concentrations, respectively, and RL is the enzyme-ligand complex. ΔF and ΔFmax are the changes of fluorescence intensity measured at intermediate or saturating ligand concentrations. The dissociation constant, Kd, of the complex was obtained as a fitting parameter.
SPR
SPR measurements were carried out at 25 °C on a dual flow cell Biacore-X100 instrument (GE Healthcare). A carboxymethylated C1 sensor chip was first derivatized at pH 5.0 with NeutrAvidin (Pierce). The NeutrAvidin-coated chip was then loaded for 700 s at a flow rate of 10 μl/min with a solution (100 μl, 0.4 μm) of the synthetic peptide Biotinyl-PEG-GpIbα(268–282). Notably, NeutrAvidin (pI = 6.3) was used as an excellent alternative to avidin (pI = 10) for minimizing non-specific binding (53, 72) Finally, aliquots (100 μl) of αT and σPre2 solutions at increasing concentrations were injected over the NeutrAvidin sensor chip saturated with biotinyl-PEG-GpIbα(268–282) (supplemental Fig. S1) at a flow rate of 10 μl/min, with a contact time of 350 s, in 10 mm HEPES, pH 7.4, 150 mm NaCl, 3 mm EDTA, 0.05% polyoxyethylene sorbitan (HBS-EP+). Each binding curve was subtracted for the corresponding baseline obtained on the reference flow cell and accounting for non-specific binding, which was found <2% of RUmax. The dissociation constant (Kd) relative to the binding of αT or σPre2 to immobilized biotinyl-PEG-GpIbα(268–282) was obtained as a fitting parameter by plotting the value of the response units at the steady state (RUeq) versus αT or σPre2 concentration and interpolating the data points with Equation 4,
| (Eq. 4) |
where L is the concentration of αT or σPre2, and RUeq and RUmax are the response units, measured at the steady state, at intermediate and saturating [L] (73). The binding data were analyzed using the BIAevaluation software.
Enzymatic activity assays
Chromogenic substrates
Hydrolytic activity of αT and σPre2 was determined at 37 °C in HBS on the chromogenic substrates S2238 ((d)-Phe-Pip-Arg-pNA), S2366 (pyro-Glu-Pro-Arg-pNA), and S2765 (Arg-Gly-Arg-pNA) by measuring the release of p-nitroaniline (pNA) at 405 nm (ϵ405 nmM = 9920 m−1·cm−1). The kinetic constants (kcat and Km) for substrate (S) hydrolysis were determined by the standard Michaelis-Menten treatment (53) using Equation 5,
| (Eq. 5) |
where E is the enzyme concentration, and v0 is the initial rate of substrate hydrolysis, calculated when <10% of product was generated.
Fibrinopeptide release
The kinetics of fibrinopeptide A (FpA) and B (FpB) release by αT or σPre2 was followed as earlier reported (53). Briefly, human fibrinogen (Fb) (ϵ280 nmM = 5.1·105 m−1·cm−1) was desalted on an in-house packed (8 × 125 mm) G10 fast-flow column (GE Healthcare) eluted with HBS, pH 7.4, at a flow rate of 0.3 ml/min. Freshly prepared Fb (0.35 μm) was reacted at 37 °C with σPre2 (30 nm) or human αT (300 pm), and at fixed time points proteolysis mixtures were added with formic acid (2% v/v final concentration) to block the proteolysis reaction and induce precipitation of unreacted Fb. After centrifugation (10,000 × g for 5 min at 4 °C), the supernatant (1.0 ml) was withdrawn, lyophilized, dissolved in 6 m guanidinium hydrochloride solution (170 μl), and injected (100 μl) onto a RP-HPLC (4.6 × 250 mm) C18 column (Grace-Vydac, Columbia, MD). The column was equilibrated with 40 mm ammonium phosphate buffer, pH 3.1, and eluted with an acetonitrile gradient. The absorbance of the effluent was recorded at 205 nm, and the amount of FpA (ϵ205 nmM = 4.40·104 m−1·cm−1) and FpB (ϵ205 nmM = 5.12·104 m−1·cm−1) released was determined by integrating the area under the chromatographic peaks. A biocompatible Bio-410 HPLC system (PerkinElmer Life Sciences), connected to a ISS-100 autosampler, was used for all analyses.
The specificity constants, kcat, A/Km, A and kcat, B/Km, B, for the release of FpA or FpB by αT or σPre2 were determined by interpolating the data points to Equations 6 and 7, respectively (55),
| (Eq. 6) |
| (Eq. 7) |
where [FpA]t or [FpB]t and [FpA]∞ or [FpB]∞ are the concentration of FpA or FpB at time t and ∞, respectively, and k′ and k″ are the observed kinetic constants for FpA or FpB release, obtained as fitting parameters. Under pseudo-first order conditions and low substrate concentration, the specificity constants could be easily determined, kcat, A/Km, A = k′/[E] and kcat, B/Km,B = k″/[E], where [E] is the protease concentration.
PAR1(38–60) hydrolysis
Hydrolysis of the synthetic peptide PAR1(38–60) (1 μm) by αT (100 pm) or σPre2 (10 nm) was carried out at 25 °C in HBS. At time points, aliquots (360 μl) were taken, acid-quenched (10 μl, 4% aqueous TFA), and loaded (350 μl) onto a Grace-Vydac (4.6 × 250 mm) C18 column. The column was eluted with a linear acetonitrile, 0.078% TFA gradient from 10 to 45% in 40 min, and the release of PAR1(42–60) (ϵ205 nmM = 95870 m−1·cm−1) (53) was quantified by integrating the area under the chromatographic peak. The kinetic data were interpolated with Equation 8, describing a pseudo-first order reaction,
| (Eq. 8) |
where [P]∞ is the concentration of the fragment PAR1(42–60) when the proteolysis reaction was complete, and kobs is the observed kinetic constant for PAR1(38–60) hydrolysis, obtained as a fitting parameter. As for the release of fibrinopeptides, under pseudo-first order conditions and low substrate concentration, kcat/Km could be derived as kobs/[E].
Protein C activation
The generation of active PC (aPC) by αT or σPre2 (E) in the presence of thrombomodulin (TM) was monitored by recording the release of pNA (P′) from the substrate S2366 (S), according to the well-established reaction Scheme 1 (54). The reaction was carried out at 37 °C in HBS, containing 5 mm CaCl2. The time course of pNA release was monitored by continuously recording the absorbance increase at 405 nm, and the progress curves were analyzed as described (54) to extract the specificity constants (kcat/Km) of PC hydrolysis by αT or σPre2.
Scheme 1.
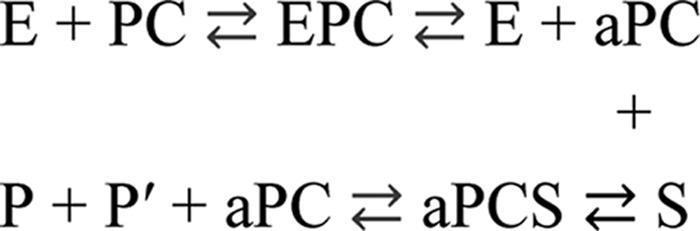
Inhibition of thrombin hydrolytic activity by PPACK
It has been shown that PPACK (I) rapidly reacts with thrombin (E) to form a non-covalent encounter complex (EI*), which then more slowly converts to the covalent, non-dissociating complex EI, according to the reaction Scheme 2, describing a one-step irreversible process (40) where kon is the second-order rate constant for the formation of EI. Under pseudo-first order conditions ([I] ≫ [E]), the observed rate constant, kobs, can be extracted from Equation 9 (40, 74),
| (Eq. 9) |
where kobs = kon·[I]0, whereas vt and v0 are the initial rates of substrate hydrolysis by the enzyme at a fixed inhibitor concentration, [I]0, at time t and time 0, respectively. Considering that complete inhibition of both αT and σPre2 occurred in a relatively short time range (90–240 s), accurate estimates of v were obtained in a continuous assay, from the slope of the tangent lines to the progress curves of pNA generation at each t value (i.e. from the first derivative of the progress curve).
Scheme 2.

Fibrin generation and platelet aggregation
Fibrin generation was started by adding αT or σPre2 (50 nm) to a freshly desalted Fb solution (0.44 μm) in HBS at 37 °C, whereas the time course clot formation was followed by continuously recording the solution absorbance at 350 nm (i.e. the turbidity) on a Jasco V-630 spectrophotometer. From the clotting curve, the values of Sm, tm, tc, and ΔAmax were extracted as described in Fig. 10B and Table 3 (35). When fibrin generation was induced in human plasma samples (diluted 1:1 with HBS) at 37 °C, the absorbance change was recorded at 671 nm.
Platelet aggregation was determined in whole blood or in gel-filtered platelets by multiple electrode aggregometry, using a multiplate analyzer (Dynabyte, Munich, Germany). The area under the aggregation curve (AUC) was determined over 10-min reaction time. Citrate-treated venous blood samples were taken from three healthy donors as follows: one male and two females, 28–35 years of age, and non-smokers. The donors gave written informed consent for participation in this study, which was approved by the institutional ethics committee of the Padua University Hospital. Platelets were isolated by loading platelet-rich plasma (PRP) samples onto a (1.5 × 25 cm) Sepharose 2B gel-filtration column (GE Healthcare), equilibrated with HBS, containing 0.2% bovine serum albumin, 5.5 mm glucose, and 5 mm KCl. PRP was prepared by centrifugation of blood samples (800 rpm for 15 min at 4 °C). Platelet counts were determined using an automated Hematology Analyzer XP-300 (Sysmex Co., Kobe, Japan).
N-terminal carbamylation
To assess the susceptibility of the N terminus to chemical modification by KCNO (0.2 m), σPre2 (1 μm) or αT (1 μm) was incubated in HBS at 37 °C. In a discontinuous assay, at different time points the reactions were stopped by dilution, and the residual amidolytic activity was determined by S2238 hydrolysis. Control experiments without KCNO were conducted in parallel. The relative rate of substrate hydrolysis was plotted as a function of the reaction time with KCNO, and the data points were analyzed as reported above for the irreversible thrombin inhibition by PPACK to obtain the pseudo-first order association rate constant kon.
The extent of carbamylation of the N termini in αT and σPre2 was comparatively estimated by automated Edman sequencing, after a 1-h reaction with KCNO at 37 °C (60). An identical amount (100 pmol) of purified αT A- and B-chain or σPre2 NT and CT fragments were loaded on a Procise sequencer (Applied Biosystems). Prior to analysis, these chains/fragments were subjected to disulfide bond reduction and carboxamidomethylation with dithiothreitol and iodoacetamide (75) and subsequent purification by RP-HPLC. As a reference, sequence analyses were performed on the corresponding species derived from αT and σPre2 samples that were not treated with KCNO. The area of the chromatographic peak corresponding to the phenylthiohydantoin-derivative of the N-terminal amino acid in each untreated species was taken as the 100% reference value that was used to estimate the % carbamylation of KCNO-treated samples.
Author contributions
G. P., L. A., D. P., R. F., and I. A. performed experimental work and analyzed the results; V. D. F. designed research, analyzed and interpreted the results, and wrote the manuscript; all authors reviewed the content of the manuscript.
Supplementary Material
Acknowledgments
We are grateful to Dr. Daniele Dalzoppo (University of Padua) for supplying us the KCNO samples; Prof. Raimondo De Cristofaro (Catholic University, Rome) and Prof. Ignazio Castagliuolo (University of Padua) for helpful discussions; and Dr. Sofia Saretta for performing some earlier preliminary experiments. The plasmid containing the cDNA of human Pre2 was a generous gift of Prof. James A. Huntington, Cambridge University, United Kingdom. We also thank Prof. Vittorio Pengo (University of Padua) for the accessibility to the ACL Top 300 Coagulometer and for supplying us with blood samples from normal subjects.
Note added in proof
Dr. Roberta Frasson was inadvertently omitted in the version of this article that was published as a Paper in Press on July 6, 2017. That error has been corrected.
This work was supported in part by Grant PRAT-2015 from the University of Padua (to V. D. F.). Part of this work will be presented at ISTH-2017 conference, July 8–13, 2017, Berlin, Germany. Communication. OC 42.5. The authors declare that they have no conflicts of interest with the contents of this article.
This article is dedicated to Prof. Angelo Fontana on the occasion of his 77th birthday.
This article was selected as one of our Editors' Picks.
This article contains supplemental Figs. S1–S3.
G. Pontarollo, L. Acquasaliente, D. Peterle, I. Artusi, R. Frasson, and V. De Filippis, unpublished results.
- ProT
- prothrombin
- αT
- α-thrombin
- aPC
- active protein C
- AU
- aggregation unit
- AUC
- area under the curve
- ChCl
- choline chloride
- CT
- C-terminal domain of σPre2
- CS-1
- -2, and -3, cleavage sites 1, 2, and 3
- Fb
- fibrinogen
- FpA
- fibrinopeptide A
- FpB
- fibrinopeptide B
- FPR
- (d)-Phe-Pip-Arg-OH
- FXa
- factor X activated
- Gla
- γ-carboxyglutamic acid rich domain
- GFP
- gel-filtered platelets
- GpIbα
- platelet glycoprotein Ib α chain
- Hir(1–47)
- hirudin N-terminal domain (1–47)
- IFE
- inner filter effect
- K1
- kringle-1 domain
- K2
- kringle-2 domain
- KCNO
- potassium cyanate
- NT
- N-terminal domain of σPre2
- PABA
- p-aminobenzamidine
- PAR-1
- protease-activated receptor 1
- PC
- protein C
- pNA
- para-nitroaniline
- PPACK
- (d)-phenylalanyl-prolyl-arginyl-chloromethyl ketone
- Pre2
- prethrombin-2
- PRP
- platelet-rich plasma
- rPre2
- recombinant human Pre2 expressed in E. coli
- RU
- response unit
- S2238
- (d)-Phe-Pip-Arg-pNA
- S2366
- pyro-Glu-Pro-Arg-pNA
- S2765
- Arg-Gly-Arg-pNA
- SC
- staphylocoagulase
- σPre2
- subtilisin-activated prethrombin-2
- vWbp
- von Willebrand-binding protein
- WB
- whole blood
- SPR
- surface plasmon resonance
- TM
- thrombomodulin
- RP-HPLC
- reverse phase-HPLC
- CAPS
- 3-cyclohexylamino-1-propanesulfonate.
References
- 1. Roberts H. R., Hoffman M., and Monroe D. M. (2006) A cell-based model of thrombin generation. Semin. Thromb. Hemost. 32, 32–38 [DOI] [PubMed] [Google Scholar]
- 2. Versteeg H. H., Heemskerk J. W., Levi M., and Reitsma P. H. (2013) New fundamentals in hemostasis. Physiol. Rev. 93, 327–358 [DOI] [PubMed] [Google Scholar]
- 3. Butenas S., van't Veer C., and Mann K. G. (1999) “Normal” thrombin generation. Blood 94, 2169–2178 [PubMed] [Google Scholar]
- 4. Pozzi N., Chen Z., and Di Cera E. (2016) How the linker connecting the two kringles influences activation and conformational plasticity of prothrombin. J. Biol. Chem. 291, 6071–6082 [DOI] [PMC free article] [PubMed] [Google Scholar]
- 5. Mann K. G., Krishnaswamy S., and Lawson J. H. (1992) Surface-dependent hemostasis. Semin. Hematol. 29, 213–226 [PubMed] [Google Scholar]
- 6. Haynes L. M., Bouchard B. A., Tracy P. B., and Mann K. G. (2012) Prothrombin activation by platelet-associated prothrombinase proceeds through the prethrombin-2 pathway via a concerted mechanism. J. Biol. Chem. 287, 38647–38655 [DOI] [PMC free article] [PubMed] [Google Scholar]
- 7. Whelihan M. F., Zachary V., Orfeo T., and Mann K. G. (2012) Prothrombin activation in blood coagulation: the erythrocyte contribution to thrombin generation. Blood 120, 3837–3845 [DOI] [PMC free article] [PubMed] [Google Scholar]
- 8. Fenton J. W. 2nd, Fasco M. J., and Stackrow A. B. (1977) Human thrombins. Production, evaluation, and properties of α-thrombin. J. Biol. Chem. 252, 3587–3598 [PubMed] [Google Scholar]
- 9. Huber R., and Bode W. (1978) Structural basis of the activation and action of trypsin. Acc. Chem. Res. 11, 114–122 [Google Scholar]
- 10. Kroh H. K., Panizzi P., and Bock P. E. (2009) von Willebrand factor-binding protein is a hysteretic conformational activator of prothrombin. Proc. Natl. Acad. Sci. U.S.A. 106, 7786–7791 [DOI] [PMC free article] [PubMed] [Google Scholar]
- 11. Pozzi N., Vogt A. D., Gohara D. W., and Di Cera E. (2012) Conformational selection in trypsin-like proteases. Curr. Opin. Struct. Biol. 22, 421–431 [DOI] [PMC free article] [PubMed] [Google Scholar]
- 12. Pasternak A., Liu X., Lin T. Y., and Hedstrom L. (1998) Activating a zymogen without proteolytic processing: mutation of Lys15 and Asn194 activates trypsinogen. Biochemistry 37, 16201–16210 [DOI] [PubMed] [Google Scholar]
- 13. Madison E. L., Kobe A., Gething M. J., Sambrook J. F., and Goldsmith E. J. (1993) Converting tissue plasminogen activator to a zymogen: a regulatory triad of Asp-His-Ser. Science 262, 419–421 [DOI] [PubMed] [Google Scholar]
- 14. Vogt A. D., Chakraborty P., and Di Cera E. (2015) Kinetic dissection of the pre-existing conformational equilibrium in the trypsin fold. J. Biol. Chem. 290, 22435–22445 [DOI] [PMC free article] [PubMed] [Google Scholar]
- 15. Friedrich R., Panizzi P., Fuentes-Prior P., Richter K., Verhamme I., Anderson P. J., Kawabata S., Huber R., Bode W., and Bock P. E. (2003) Staphylocoagulase is a prototype for the mechanism of cofactor-induced zymogen activation. Nature 425, 535–539 [DOI] [PubMed] [Google Scholar]
- 16. Kini R. M. (2003) Excitement ahead: structure, function and mechanism of snake venom phospholipase A2 enzymes. Toxicon 42, 827–840 [DOI] [PubMed] [Google Scholar]
- 17. Wegrzynowicz Z., Heczko P. B., Drapeau G. R., Jeljaszewicz J., and Pulverer G. (1980) Prothrombin activation by a metallo-protease from Staphylococcus aureus. J. Clin. Microbiol. 12, 138–139 [DOI] [PMC free article] [PubMed] [Google Scholar]
- 18. Imamura T., Banbula A., Pereira P. J., Travis J., and Potempa J. (2001) Activation of human prothrombin by arginine-specific cysteine proteinases (Gingipains R) from Porphyromonas gingivalis. J. Biol. Chem. 276, 18984–18991 [DOI] [PubMed] [Google Scholar]
- 19. Chang A. K., Kim H. Y., Park J. E., Acharya P., Park I. S., Yoon S. M., You H. J., Hahm K. S., Park J. K., and Lee J. S. (2005) Vibrio vulnificus secretes a broad-specificity metallo-protease capable of interfering with blood homeostasis through prothrombin activation and fibrinolysis. J. Bacteriol. 187, 6909–6916 [DOI] [PMC free article] [PubMed] [Google Scholar]
- 20. Nitta H., Kobayashi H., Irie A., Baba H., Okamoto K., and Imamura T. (2007) Activation of prothrombin by ASP, a serine protease released from Aeromonas sobria. FEBS Lett. 581, 5935–5939 [DOI] [PubMed] [Google Scholar]
- 21. Liu C., Matsushita Y., Shimizu K., Makimura K., and Hasumi K. (2007) Activation of prothrombin by two subtilisin-like serine proteases from Acremonium sp. Biochem. Biophys. Res. Commun. 358, 356–362 [DOI] [PubMed] [Google Scholar]
- 22. Levi M., and Ten Cate H. (1999) Disseminated intravascular coagulation. N. Engl. J. Med. 341, 586–592 [DOI] [PubMed] [Google Scholar]
- 23. Smith E. L., DeLange R. J., Evans W. H., Landon M., and Markland F. S. (1968) Subtilisin Carlsberg. V. The complete sequence; comparison with subtilisin BPN′; evolutionary relationships. J. Biol. Chem. 243, 2184–2191 [PubMed] [Google Scholar]
- 24. de Boer A. S., and Diderichsen B. (1991) On the safety of Bacillus subtilis and B. amyloliquefaciens: a review. Appl. Microbiol. Biotechnol. 36, 1–4 [DOI] [PubMed] [Google Scholar]
- 25. Oggioni M. R., Pozzi G., Valensin P. E., Galieni P., and Bigazzi C. (1998) Recurrent septicemia in an immunocompromised patient due to probiotic strains of Bacillus subtilis. J. Clin. Microbiol. 36, 325–326 [DOI] [PMC free article] [PubMed] [Google Scholar]
- 26. Siezen R. J., and Leunissen J. A. (1997) Subtilases: the superfamily of subtilisin-like serine proteases. Protein Sci. 6, 501–523 [DOI] [PMC free article] [PubMed] [Google Scholar]
- 27. Perona J. J., and Craik C. S. (1995) Structural basis of substrate specificity in the serine proteases. Protein Sci. 4, 337–360 [DOI] [PMC free article] [PubMed] [Google Scholar]
- 28. Vindigni A., Dang Q. D., and Di Cera E. (1997) Site-specific dissection of substrate recognition by thrombin. Nat. Biotechnol. 15, 891–895 [DOI] [PubMed] [Google Scholar]
- 29. Pozzi N., Chen Z., Pelc L. A., Shropshire D. B., and Di Cera E. (2014) The linker connecting the two kringles plays a key role in prothrombin activation. Proc. Natl. Acad. Sci. U.S.A. 111, 7630–7635 [DOI] [PMC free article] [PubMed] [Google Scholar]
- 30. Fontana A., Zambonin M., Polverino de Laureto P., De Filippis V., Clementi A., and Scaramella E. (1997) Probing the conformational state of apomyoglobin by limited proteolysis. J. Mol. Biol. 266, 223–230 [DOI] [PubMed] [Google Scholar]
- 31. Pozzi N., Bystranowska D., Zuo X., and Di Cera E. (2016) Structural architecture of prothrombin in solution revealed by single molecule spectroscopy. J. Biol. Chem. 291, 18107–18116 [DOI] [PMC free article] [PubMed] [Google Scholar]
- 32. Pozzi N., Chen Z., Zapata F., Pelc L. A., Barranco-Medina S., and Di Cera E. (2011) Crystal structures of prethrombin-2 reveal alternative conformations under identical solution conditions and the mechanism of zymogen activation. Biochemistry 50, 10195–10202 [DOI] [PMC free article] [PubMed] [Google Scholar]
- 33. Bode W., Turk D., and Karshikov A. (1992) The refined 1.9-Å X-ray crystal structure of d-Phe-Pro-Arg chloromethyl ketone-inhibited human α-thrombin: structure analysis, overall structure, electrostatic properties, detailed active-site geometry, and structure-function relationships. Protein Sci. 1, 426–471 [DOI] [PMC free article] [PubMed] [Google Scholar]
- 34. Li W., Johnson D. J., Adams T. E., Pozzi N., De Filippis V., and Huntington J. A. (2010) Thrombin inhibition by serpins disrupts exosite II. J. Biol. Chem. 285, 38621–38629 [DOI] [PMC free article] [PubMed] [Google Scholar]
- 35. Pozzi N., Acquasaliente L., Frasson R., Cristiani A., Moro S., Banzato A., Pengo V., Scaglione G. L., Arcovito A., De Cristofaro R., and De Filippis V. (2013) β2-Glycoprotein I binds to thrombin and selectively inhibits the enzyme procoagulant functions. J. Thromb. Haemost. 11, 1093–1102 [DOI] [PubMed] [Google Scholar]
- 36. De Filippis V., De Dea E., Lucatello F., and Frasson R. (2005) Effect of Na+ binding on the conformation, stability and molecular recognition properties of thrombin. Biochem. J. 390, 485–492 [DOI] [PMC free article] [PubMed] [Google Scholar]
- 37. Lakowicz J. R. (2006) in Principles of Fluorescence Spectroscopy (Lakowicz J. R., ed) 3rd Ed., pp. 529–575, Springer, New York [Google Scholar]
- 38. Pozzi N., Zerbetto M., Acquasaliente L., Tescari S., Frezzato D., Polimeno A., Gohara D. W., Di Cera E., and De Filippis V. (2016) Loop electrostatics asymmetry modulates the pre-existing conformational equilibrium in thrombin. Biochemistry 55, 3984–3994 [DOI] [PMC free article] [PubMed] [Google Scholar]
- 39. Evans S. A., Olson S. T., and Shore J. D. (1982) p-Aminobenzamidine as a fluorescent probe for the active site of serine proteases. J. Biol. Chem. 257, 3014–3017 [PubMed] [Google Scholar]
- 40. Kettner C., and Shaw E. (1981) Inactivation of trypsin-like enzymes with peptides of arginine chloromethyl ketone. Methods Enzymol. 90, 826–842 [DOI] [PubMed] [Google Scholar]
- 41. Rydel T. J., Tulinsky A., Bode W., and Huber R. (1991) Refined structure of the hirudin-thrombin complex. J. Mol. Biol. 221, 583–601 [DOI] [PubMed] [Google Scholar]
- 42. De Filippis V., Colombo G., Russo I., Spadari B., and Fontana A. (2002) Probing the hirudin-thrombin interaction by incorporation of noncoded amino acids and molecular dynamics simulation. Biochemistry 41, 13556–13569 [DOI] [PubMed] [Google Scholar]
- 43. Walker B., Wikstrom P., and Shaw E. (1985) Evaluation of inhibitor constants and alkylation rates for a series of thrombin affinity labels. Biochem. J. 230, 645–650 [DOI] [PMC free article] [PubMed] [Google Scholar]
- 44. De Cristofaro R., and De Filippis V. (2003) Interaction of the 268–282 region of glycoprotein Ibα with the heparin-binding site of thrombin inhibits the enzyme activation of factor VIII. Biochem. J. 373, 593–601 [DOI] [PMC free article] [PubMed] [Google Scholar]
- 45. Lechtenberg B. C., Freund S. M., and Huntington J. A. (2014) GpIbα interacts exclusively with exosite II of thrombin. J. Mol. Biol. 426, 881–893 [DOI] [PMC free article] [PubMed] [Google Scholar]
- 46. Gandhi P. S., Chen Z., Mathews F. S., and Di Cera E. (2008) Structural identification of the pathway of long-range communication in an allosteric enzyme. Proc. Natl. Acad. Sci. U.S.A. 105, 1832–1837 [DOI] [PMC free article] [PubMed] [Google Scholar]
- 47. Lechtenberg B. C., Johnson D. J., Freund S. M., and Huntington J. A. (2010) NMR resonance assignments of thrombin reveal the conformational and dynamic effects of ligation. Proc. Natl. Acad. Sci. U.S.A. 107, 14087–14092 [DOI] [PMC free article] [PubMed] [Google Scholar]
- 48. Orthner C. L., Kolen B., and Drohan W. N. (1993) A sensitive and facile assay for the measurement of activated protein C activity levels in vivo. Thromb. Haemost. 69, 441–447 [PubMed] [Google Scholar]
- 49. Nagai K., and Thøgersen H. C. (1987) Synthesis and sequence-specific proteolysis of hybrid proteins produced in Escherichia coli. Methods Enzymol. 153, 461–481 [DOI] [PubMed] [Google Scholar]
- 50. Wells C. M., and Di Cera E. (1992) Thrombin is a Na+-activated enzyme. Biochemistry 31, 11721–11730 [DOI] [PubMed] [Google Scholar]
- 51. Pozzi N., Barranco-Medina S., Chen Z., and Di Cera E. (2012) Exposure of R169 controls protein C activation and autoactivation. Blood 120, 664–670 [DOI] [PMC free article] [PubMed] [Google Scholar]
- 52. Lancellotti S., Rutella S., De Filippis V., Pozzi N., Rocca B., and De Cristofaro R. (2008) Fibrinogen-elongated γ chain inhibits thrombin-induced platelet response, hindering the interaction with different receptors. J. Biol. Chem. 283, 30193–30204 [DOI] [PMC free article] [PubMed] [Google Scholar]
- 53. Acquasaliente L., Peterle D., Tescari S., Pozzi N., Pengo V., and De Filippis V. (2016) Molecular mapping of α-thrombin (αT)/β2-glycoprotein I (β2GpI) interaction reveals how β2GpI affects αT functions. Biochem. J. 473, 4629–4650 [DOI] [PubMed] [Google Scholar]
- 54. Dang O. D., Vindigni A., and Di Cera E. (1995) An allosteric switch controls the procoagulant and anticoagulant activities of thrombin. Proc. Natl. Acad. Sci. U.S.A. 92, 5977–5981 [DOI] [PMC free article] [PubMed] [Google Scholar]
- 55. Ng A. S., Lewis S. D., and Shafer J. A. (1993) Quantifying thrombin-catalyzed release of fibrinopeptides from fibrinogen using high-performance liquid chromatography. Methods Enzymol. 222, 341–358 [DOI] [PubMed] [Google Scholar]
- 56. Weisel J. W., and Nagaswami C. (1992) Computer modeling of fibrin polymerization kinetics correlated with electron microscope and turbidity observations: clot structure and assembly are kinetically controlled. Biophys. J. 63, 111–128 [DOI] [PMC free article] [PubMed] [Google Scholar]
- 57. Morita T., and Iwanaga S. (1981) Prothrombin activator from Echis carinatus venom. Methods Enzymol. 80, 303–311 [Google Scholar]
- 58. Komiyama T., Grøn H., Pemberton P. A., and Salvesen G. S. (1996) Interaction of subtilisins with serpins. Protein Sci. 5, 874–882 [DOI] [PMC free article] [PubMed] [Google Scholar]
- 59. Tóth O., Calatzis A., Penz S., Losonczy H., and Siess W. (2006) Multiple electrode aggregometry: a new device to measure platelet aggregation in whole blood. Thromb. Haemost. 96, 781–788 [PubMed] [Google Scholar]
- 60. Stark G. R. (1965) Reactions of cyanate with functional groups of proteins. 3. Reactions with amino and carboxyl groups. Biochemistry 4, 1030–1036 [DOI] [PubMed] [Google Scholar]
- 61. Persson E., Kjalke M., and Olsen O. H. (2001) Rational design of coagulation factor VIIa variants with substantially increased intrinsic activity. Proc. Natl. Acad. Sci. U.S.A. 98, 13583–13588 [DOI] [PMC free article] [PubMed] [Google Scholar]
- 62. Jiang L., Botkjaer K. A., Andersen L. M., Yuan C., Andreasen P. A., and Huang M. (2013) Rezymogenation of active urokinase induced by an inhibitory antibody. Biochem. J. 449, 161–166 [DOI] [PubMed] [Google Scholar]
- 63. Fauchère J. L., Charton M., Kier L. B., Verloop A., and Pliska V. (1988) Amino acid side chain parameters for correlation studies in biology and pharmacology. Int. J. Pept. Protein Res. 32, 269–278 [DOI] [PubMed] [Google Scholar]
- 64. Loeb L. (1903) The influence of certain bacteria on the coagulation of the blood. J. Med. Res. 3, 407–419 [PMC free article] [PubMed] [Google Scholar]
- 65. Menkin V. (1938) The role of inflammation in immunity. Physiol. Rev. 18, 366–418 [Google Scholar]
- 66. Engelmann B., and Massberg S. (2013) Thrombosis as an intravascular effector of innate immunity. Nat. Rev. Immunol. 13, 34–45 [DOI] [PubMed] [Google Scholar]
- 67. Loof T. G., Goldmann O., Naudin C., Mörgelin M., Neumann Y., Pils M. C., Foster S. J., Medina E., and Herwald H. (2015) Staphylococcus aureus-induced clotting of plasma is an immune evasion mechanism for persistence within the fibrin network. Microbiology 161, 621–627 [DOI] [PubMed] [Google Scholar]
- 68. Angus D. C., and van der Poll T. (2013) Severe sepsis and septic shock. N. Engl. J. Med. 369, 840–851 [DOI] [PubMed] [Google Scholar]
- 69. Opal S. M., and Esmon C. T. (2003) Bench-to-bedside review: functional relationships between coagulation and the innate immune response and their respective roles in the pathogenesis of sepsis. Crit. Care 7, 23–38 [DOI] [PMC free article] [PubMed] [Google Scholar]
- 70. Siezen R. J., Renckens B., and Boekhorst J. (2007) Evolution of prokaryotic subtilases: genome-wide analysis reveals novel subfamilies with different catalytic residues. Proteins 67, 681–694 [DOI] [PubMed] [Google Scholar]
- 71. De Filippis V., Quarzago D., Vindigni A., Di Cera E., and Fontana A. (1998) Synthesis and characterization of more potent analogues of hirudin fragment 1–47 containing non-natural amino acids. Biochemistry 37, 13507–13515 [DOI] [PubMed] [Google Scholar]
- 72. Sokolov A. V., Acquasaliente L., Kostevich V. A., Frasson R., Zakharova E. T., Pontarollo G., Vasilyev V. B., and De Filippis V. (2015) Thrombin inhibits the anti-myeloperoxidase and ferroxidase functions of ceruloplasmin: relevance in rheumatoid arthritis. Free Radic. Biol. Med. 86, 279–294 [DOI] [PubMed] [Google Scholar]
- 73. Valotteau C., Prystopiuk V., Pietrocola G., Rindi S., Peterle D., De Filippis V., Foster T. J., Speziale P., and Dufrêne Y. F. (2017) The Staphylococcus aureus collagen-binding protein cna3 is a multifunctional adhesin. ACS Nano 11, 2160–2170 [DOI] [PubMed] [Google Scholar]
- 74. Arcone R., Chinali A., Pozzi N., Parafati M., Maset F., Pietropaolo C., and De Filippis V. (2009) Conformational and biochemical characterization of a biologically active rat recombinant protease Nexin-1 expressed in. E. coli. Biochim. Biophys. Acta 1794, 602–614 [DOI] [PubMed] [Google Scholar]
- 75. De Filippis V., Russo I., Vindigni A., Di Cera E., Salmaso S., and Fontana A. (1999) Incorporation of noncoded amino acids into the N-terminal domain 1–47 of hirudin yields a highly potent and selective thrombin inhibitor. Protein Sci. 8, 2213–2217 [DOI] [PMC free article] [PubMed] [Google Scholar]
- 76. Vriend G. (1990) WHAT IF: A molecular modeling and drug design program. J. Mol. Graph. 8, 52–56 [DOI] [PubMed] [Google Scholar]
Associated Data
This section collects any data citations, data availability statements, or supplementary materials included in this article.