

Abstract
Peptidoglycan (murein) is a vital component of the cell wall of nearly all bacteria, composed of sugars linked by short peptides. This protocol describes the purification of macromolecular peptidoglycan from cultured bacteria and the analysis of enzyme-digested peptidoglycan fragments using high performance liquid chromatography (HPLC). Digested peptidoglycan fragments can be identified by mass spectrometry, or predicted by comparing retention times with other published chromatograms. The quantitative nature of this method allows for the measurement of changes to peptidoglycan composition between different species of bacteria, growth conditions, or mutations. This method can determine the overall architecture of peptidoglycan, such as peptide stem length, the extent of cross-linking, and modifications. Muropeptide analysis has been used to study the function of peptidoglycan-associated proteins and the mechanisms by which bacteria acquire antibiotic resistance.
Keywords: Muropeptides analysis, Peptidoglycan, PG, HPLC, Muropeptide
Background
Peptidoglycan is composed of a sugar backbone linked together by peptide stems that creates a mesh-like structure important for cell shape, and turgor pressure of bacterial cells. The macromolecular peptidoglycan is assembled from monomeric units that are synthesized in the cytoplasm and consist of an N-acetylglucosamine and N-acetylmuramic acid disaccharide with a five amino acid stem. When the monomer is flipped into the periplasm, it is added to the glycan chain by transglycosylation and a portion of the peptide stems are linked together by transpeptidation.
The amino acids comprising the peptide stem can vary by species but are generally attached to muramic acid in the order L-alanine, D-glutamic acid, meso-diaminopimelic acid, D-alanine, D-alanine, with L-lysine taking the place of diaminopimelic acid in some Gram-positives. Cross-linking occurs through the free amine of the third amino acid linking either the third or fourth amino acid directly or through linker amino acids (Schleifer and Kandler, 1972). Other common modifications include amidation of amino acids (Kato and Strominger, 1968) and O-acetylation (Clarke and Dupont, 1992) or N-deacetylation ( Araki et al., 1971 ) of sugars.
A variety of enzymes act on peptidoglycan during growth and cell division. Classes of enzymes known as lytic transglycosylases cleave glycan chains between disaccharide units at the same position as lysozyme. The important difference is that lytic transglycosylases create a 1,6-anhydro bond, in contrast to a reducing end created by lysozyme and mutanolysin. Thus the relative abundance of 1,6-anhydro bonds can be used as an approximation of glycan chain length (Ward, 1973). Different classes of peptidases act at different bonds of the peptide stem and cross-links. For example, D,D-carboxypeptidases will cleave between the fourth and fifth amino acid, while, L,D-carboxypeptidases will cleave between the third and fourth amino acid (Holtje and Tuomanen, 1991).
Muropeptide analysis can resolve the different modifications and cross-linking to give a model of the overall structure of the macromolecular peptidoglycan. One of the first observations using HPLC-based peptidoglycan analysis was the discovery that Caulobacter crescentus lacks D,D-carboxypeptidase activity ( Markiewicz et al., 1983 ). The first comprehensive peptidoglycan analysis was done on Escherichia coli with 80 different muropeptides species identified ( Glauner et al., 1988 ). This method has also been used to show penicillin-resistance in Neisseria meningitidis is correlated with differences in peptidoglycan structure ( Antignac et al., 2003a ).
Interest in peptidoglycan has seen an increase in recent years. Continued bacterial resistance to peptidoglycan-targeting antibiotics created a need for a more complete understanding of peptidoglycan metabolism. The discovery of the human peptidoglycan-recognizing proteins, NOD1 and NOD2 have also led to increased investigations into how host cells recognize peptidoglycan and how they are able to differentiate between commensal and pathogenic bacteria (Clarke and Weiser, 2011).
The following method has a number of advantages over other types of peptidoglycan analysis, including ultra-performance liquid chromatography (UPLC)-based methods. The first advantage is that nearly all of the equipment and materials are a standard part of most laboratories, so a large investment is not needed. Second, the almost 30 year history of this protocol allows comparisons with similar chromatograms to be made, allowing for preliminary identification of peptidoglycan fragments to be made quickly, then using mass spectrometry to positively identify fragments that change or are of particular interest. The third advantage is the scale of this method, which yields enough separated material for additional analysis by mass spectrometry or enzymatic reactions. More information on the history and uses of HPLC-based peptidoglycan analysis can be found in this review ( Desmarais et al., 2013 )
Materials and Reagents
Pipette tips
Nalgene Oak Ridge high-speed PPCO centrifuge tubes (Thermo Fisher Scientific, Thermo ScientificTM, catalog number: 3119-0050)
1.7 ml microcentrifuge tubes (MIDSCI, catalog number: AVSS1700)
Amicon Ultra-0.5 centrifugal filter unit with ultracel-10 membrane (EMD Millipore, catalog number: UFC501024)
Aluminum foil (Fisher Scientific, catalog number: 01-213-100)
Filter (0.22 µm)
Bacterial growth medium (species specific)
Micrococcus lysodeikticus ATCC No. 4698, lyophilized cells (Sigma-Aldrich, catalog number: M3770)
α-Amylase from porcine pancreas (Sigma-Aldrich, catalog number: A6255)
Pronase protease, Streptomyces griseus (EMD Millipore, catalog number: 53702)
1 N HCl
Sodium azide (NaN3) (Sigma-Aldrich, catalog number: S2002)
Mutanolysin from Streptomyces globisporus ATCC (Sigma-Aldrich, catalog number: M9901)
Sodium borohydride (Sigma-Aldrich, catalog number: 213462)
Sodium phosphate monobasic monohydrate (NaH2PO4.H2O) (Fisher Scientific, catalog number: S369)
Sodium phosphate dibasic heptahydrate (Na2HPO4.7H2O) (Fisher Scientific, catalog number: S373)
Sodium dodecyl sulfate (SDS) (Fisher Scientific, catalog number: BP166-100)
Boric acid (Acros Organics, catalog number: 327132500)
Water (HPLC-grade) (Fisher Scientific, catalog number: W5SK-4)
Sodium hydroxide (NaOH) (Fisher Scientific, catalog number: S318-1)
Sodium chloride (NaCl) (Fisher Scientific, catalog number: BP358)
Potassium chloride (KCl) (Fisher Scientific, catalog number: BP366)
Potassium phosphate monobasic (KH2PO4) (Fisher Scientific, catalog number: P285)
o-Phosphoric acid, 85% (HPLC) (Fisher Scientific, catalog number: A260-500)
Methanol (HPLC-grade) (Fisher Scientific, catalog number: A452SK-4)
Trifluoroacetic acid (Sigma-Aldrich, catalog number: 302031)
Acetonitrile (HPLC-grade) (Fisher Scientific, catalog number: A998)
Phosphate buffer pH = 6 (PB) (see Recipes)
PB with 8% (w/v) SDS (see Recipes)
0.5 M borate buffer pH = 8 (see Recipes)
Phosphate buffered saline (PBS) (see Recipes)
HPLC separation buffer A (see Recipes)
HPLC separation buffer B (see Recipes)
HPLC desalting buffer A (see Recipes)
HPLC desalting buffer B (see Recipes)
Equipment
-
Kimax baffled culture flasks (Fisher Scientific, catalog numbers: 10-140-6A and 10-140-6B)
Manufacturer: DWK Life Sciences, Kimble, catalog numbers: 25630250 and 25630500.
Pipettes (Gilson, catalog number: F167700)
Nalgene PPCO centrifuge bottle 500 ml (Thermo Fisher Scientific, Thermo ScientificTM, catalog number: 3120-0500)
SLA-3000 fixed angle rotor (Thermo Fisher Scientific, Thermo ScientificTM, catalog number: 07149)
SS-34 fixed angle rotor (Thermo Fisher Scientific, Thermo ScientificTM, catalog number: 28020)
Sorvall RC-6 plus (Thermo Fisher Scientific, Thermo ScientificTM, model: Sorvall RC 6 Plus, catalog number: 46910)
HiTemp hot water bath (Fisher Scientific, catalog number: 11-481Q)
Accumet AB150 pH benchtop meter (Fisher Scientific, model: Accumet AB150TM, catalog number: 13-636-AB150)
UV-Vis spectrophotometer (Thermo Fischer Scientific, Thermo ScientificTM, model: GENESYSTM 10S, catalog number: 840-208100)
Vortex-Genie 2 (Scientific Industries, model: Vortex-Genie 2, catalog number: SI-0236)
-
Astec C18 HPLC column (Sigma-Aldrich, catalog number: 55024AST)
Note: This product has been discontinued.
-
Beckman Coulter System Gold HPLC with 126 Solvent Module, 168 Detector, and SC100 Fraction collector (Beckman Coulter, model: System Gold)
Note: This product has been discontinued.
Procedure
-
Growth of bacteria cultures
Grow up 200 ml or larger bacterial cultures to obtain enough peptidoglycan for analysis of Gram-negative bacteria. It may be possible to use less culture for Gram-positive bacteria. Use growth media suited to the bacteria being grown. Since the composition of peptidoglycan is growth-phase dependent ( Pisabarro et al., 1985 ), it is important that all cultures are grown to the same optical density to limit differences due to growth phase. Harvesting cells at a final optical density corresponding to mid- or late-logarithmic growth phase will provide a high yield of cells, while minimizing the chance of harvesting dead or lysed cells.
Once cells have reached the desired optical density, chill cultures in an ice bath and transfer to a 500 ml centrifuge bottle.
Centrifuge cultures at 5,000 × g for 10 min at 4 °C.
Decant supernatant and wash cells once with 25 ml of cold PBS.
Centrifuge cultures at 5,000 × g for 10 min at 4 °C. Decant supernatant and save cell pellet at -80 °C.
-
Isolation of macromolecular peptidoglycan from cells
Suspend frozen cell pellets in 10 ml PB (25 mM sodium phosphate pH = 6, see Recipes). The slightly acidic pH protects the acetyl groups present in some bacterial species.
For each cell pellet, add 10 ml of PB with 8% (w/v) SDS to a new Oak Ridge tube and place tubes in a boiling water bath.
Add cell suspensions drop-wise to tubes with boiling SDS. Cover tubes with vented aluminum foil to prevent evaporation, and place in boiling water. Boil samples for 30 min.
Cap tubes and allow them to equilibrate to room temperature. Do not cool samples on ice because it will cause the SDS to precipitate.
Centrifuge in an SS-34 rotor at 45,000 × g for 30 min at 15 °C to pellet the insoluble peptidoglycan.
Decant the supernatant containing soluble cell components. The peptidoglycan pellet will appear glassy and be about the size of a thumbnail (Figure 1).
Wash the pellet by adding 10 ml of PB and vortex until the pellet is completely suspended. Centrifuge in an SS-34 rotor at 45,000 × g for 30 min at 15 °C.
Repeat the previous wash step to remove SDS. The residual SDS will cause foaming that will decrease with each wash. Continue washing until there are no more signs of SDS, usually 4 to 6 washes depending on the size of the initial culture.
-
After the last wash, suspend the pellet in 1 ml PB and transfer to a microcentrifuge tube.
Note: At this point the sacculi have been isolated from most cellular components not covalently bound. Treatments with α-amylase and pronase are used to remove trapped high-molecular weight glycogen and peptidoglycan-associated proteins, respectively. For Gram-positives, an additional treatment of 1 N HCl is also needed to remove teichoic acids (Kuhner et al., 2014) after treatment with pronase.
Dilute α-amylase saline suspension to a 1 mg ml-1 working concentration with water. Add 100 µg of α-amylase to each suspended peptidoglycan pellet. Vortex briefly and incubate for 1 h at 37 °C.
Dissolve necessary pronase powder to 2 mg ml-1 with water. Add 200 µg of pronase to each suspended peptidoglycan pellet. Vortex briefly and incubate for between 2 h to overnight at 37 °C with agitation.
Add sample drop-wise into an Oak Ridge tube containing 10 ml PB with 4% (w/v) SDS placed into a boiling water bath and boil for 30 min.
Cap tubes and allow samples to equilibrate to room temperature.
Centrifuge samples in an SS-34 rotor at 45,000 × g for 30 min at 15 °C and decant the supernatant. Suspend pelleted peptidoglycan in 10 ml PB. Repeat spins and washes until no residual SDS remains.
After the last wash, suspend peptidoglycan in 0.5 ml of PB, and then normalize samples to 4 mg ml-1. Peptidoglycan can be normalized using a standard curve of Micrococcus lysodeikticus and measuring absorption at either 206 nm or 254 nm. Absorbance at 206 nm is used to detect carboxyl groups, ester linkages, and peptide bonds, while absorbance at 254 nm is used to detect the sugars of the glycan backbone. Samples can be stored long-term at -20 °C or can be stored with 0.02% sodium azide at 4 °C for one month, possibly longer.
-
Preparation of peptidoglycan fragments for HPLC
Transfer 0.5 ml (2 mg) of purified peptidoglycan to a microcentrifuge tube and add 10 µl of 2 mg ml-1 mutanolysin. Incubate at 37 °C for 4 h to overnight with agitation. It is important that the concentration of peptidoglycan is sufficiently high prior to the addition of mutanolysin because insoluble fragments cannot be concentrated by centrifugation.
Wash an Amicon Ultra-0.5 Centrifugal Filter Ultracel-10 twice with 0.5 ml water by centrifugation at 14,000 × g for 5 min and discard flow-through to remove trace amounts of glycerol on the membrane. Do not allow membrane to dry completely.
To remove mutanolysin and insoluble peptidoglycan, add mutanolysin-digested samples to the washed filter with a new collection tube and centrifuge at 14,000 × g for 20 min.
Transfer flow-through, containing soluble peptidoglycan fragments, to a new microcentrifuge tube and discard the filter.
-
In a chemical hood, add 10 mg ml-1 sodium borohydride to 0.5 M borate buffer (see Recipes) immediately before using.
Note: Before handling sodium borohydride read the MSDS for necessary handling precautions. Avoid contact with skin and note that it reacts violently with water. The sodium borohydride reaction rapidly creates enough hydrogen gas to pop the cap off on a microcentrifuge tube with enough force that the tube will jump and spray your sample over a meter. It is important that the microcentrifuge cap is either secured with a cap lock or left open.
Add an equal volume of sodium borohydride solution (0.5 ml) to soluble peptidoglycan samples. Vortex and then uncap samples in a chemical hood and repeat after 10 min. Sodium borohydride is used to reduce sugars so that each fragment will elute as a single peak.
After exactly 20 min, stop the reaction by adjusting the pH to between 2 and 4 by adding approximately 20 µl of 85% phosphoric acid to each reaction. An overview of the peptidoglycan isolation and preparation for HPLC can be seen in Figure 2.
-
Detection of muropeptides by HPLC
Set up an HPLC method that runs separation buffer A (see Recipes) for 10 min and then goes from 0 to 100% separation buffer B (see Recipes) over 120 min with a flow rate of 0.5 ml per minute. Detect peaks using a 206 nm wavelength. An injection loop of 0.5 ml is recommended. Use a reversed-phase octadecyl silica (ODS) C18 column to separate muropeptides. A column incubator set to 30 °C will ensure a more consistent separation.
-
Run a blank (buffer only) sample to establish a baseline and ensure that there are no contaminating residual compounds remaining on the column. Clean the column after each run with 100% buffer B for 20 min at 1 ml min-1, then equilibrate with 100% buffer A for 30 min at 1 ml min-1 before each run.
Note: The retention time of the muropeptides is dependent on the pH of the buffers, the percentage of solvent, and temperature (Glauner, 1988). The buffer pH is near the equivalence point, making them difficult to replicate exactly even with a good pH meter. It is useful to make enough buffer to run all comparative samples. Maintaining the column at 30 °C will also help make retention times more consistent. The methanol causes a positive baseline drift, which can make analysis more difficult. One solution is to add approximately 10 µg ml-1 sodium azide (NaN3) to lower the absorbance (Glauner et al., 1988). With newer detectors the baseline drift can be fixed with the subtraction of a blank run from a sample run or the use of a reference wavelength.
Inject up to 0.5 ml of sample for each HPLC run. If desired, collect separated muropeptides in 1-min (0.5 ml) fractions in a fraction collector for later analysis/confirmation by mass spectrometry. The peptidoglycan fragment peaks will separate and form peaks that can be visualized using absorbance at 206 nm (Figure 3).
The amounts of each type of peptidoglycan fragment can be quantified by measuring the area under the peak using the software included with your HPLC.
-
Identification of peptidoglycan peaks by mass spectrometry
The phosphate in the buffers used to separate peptidoglycan peaks is incompatible with many mass spectrometry methods. To desalt peptidoglycan peaks by HPLC, first pool fractions containing peaks of interest and concentrate using a vacuum concentrator.
The samples can then be desalted on the same C18 HPLC column. Create a program that runs 100% desalting buffer A (see Recipes) for 10 min, then a gradient from 0% to 100% desalting buffer B (see Recipes) for 10 min, and 100% desalting buffer B for an additional 10 min at 1 ml min-1. A more gradual gradient can be used to separate peaks containing more than one type of peptidoglycan fragment.
As before, run a blank sample to establish a baseline, then run samples and use a fraction collector to collect eluted peptidoglycan fragments.
Vacuum concentrate collected samples containing your peptidoglycan fragment. Mass can be determined by positive ion electrospray ionization time of flight mass spectrometry (POS ES-TOF), or Matrix Assisted Laser Desorption/Ionization–Time Of Flight (MALDI-TOF MS) mass spectrometry.
Figure 1. Pelleted peptidoglycan.
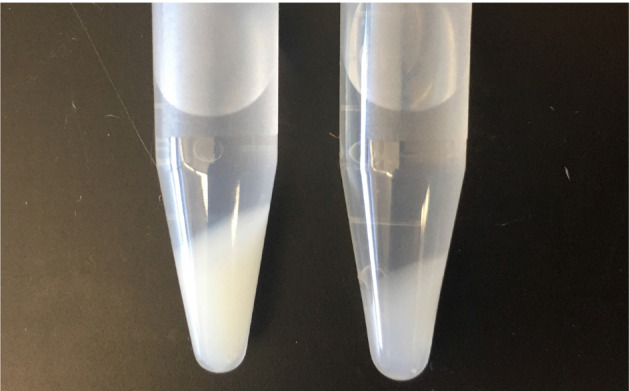
Peptidoglycan following the first boiling SDS treatment and washes (left) and following the second boiling SDS treatment (right).
Figure 2. Summary and brief description of the steps necessary to prepare peptidoglycan for HPLC analysis.
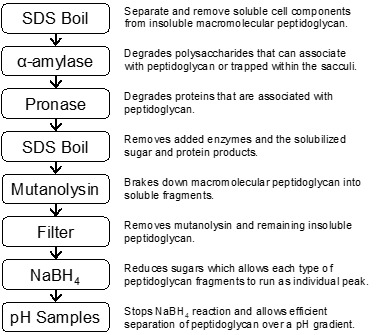
Figure 3. Chromatogram of separated peptidoglycan fragments from the rod-shaped Escherichia coli and the diplococcus Neisseria gonorrhoeae.

Many of the peptidoglycan fragments are the same between species like the two prominent Tetra and Tetra-Tetra fragments. Some of the differences are due N. gonorrhoeae having O-acetylated peptidoglycan, but lacking Braun’s lipoprotein and Tri-Lys-Arg attachments. The identity of the peaks follows the naming convention used by Glauner (1988).
Data analysis
To make comparisons between bacterial strains, growth conditions, or mutations, a minimum of three peptidoglycan samples from independent cultures should be used. Use absorbance at 206 nm (A206) to identify peaks of interest. Establishing a baseline is important for analysis, especially for larger fragments with longer retention times. Software between HPLC systems will be different, but being consistent with how samples are run and how data is analyzed will ensure accurate comparison.
The two common ways of expressing peak area (also known as area under the peak) are as absorbance/min and as percentage of total chromatogram. The second option offers more biological relevance and is more forgiving of samples when the amount of peptidoglycan injected is not equal. Biological replicates can be compared using a two-sample t-test assuming equal variance to compare equivalent peaks between samples.
Annotated chromatograms and other information can be found in (Glauner, 1988; Glauner et al., 1988; Pisabarro et al., 1985 ; Antignac et al., 2003b ).
Recipes
-
PB (25 mM phosphate buffer pH = 6)
0.2973% (w/v) NaH2PO4.H2O
0.0926% (w/v) Na2HPO4.7H2O
Confirm pH = 6, autoclave
-
PB with 8% (w/v) SDS
0.2973% (w/v) NaH2PO4.H2O
0.0926% (w/v) Na2HPO4.7H2O
8.0% (w/v) SDS
-
0.5 M borate buffer pH = 8
Dissolve 6.18 g boric acid in 140 ml water
Adjust pH to 8 with 10 N NaOH
Adjust volume to 200 ml
Filter sterilize (0.22 µm)
-
Phosphate buffered saline (PBS)
137 mM NaCl
2.7 mM KCl
10 mM Na2HPO4
1.8 mM KH2PO4
Autoclave and store at 4 °C
-
HPLC separation buffer A (50 mM sodium phosphate pH = 4.33)
Dissolve 2.0 g NaOH in 700 ml HPLC grade water
Adjust pH to 4.33 with phosphoric acid
Bring up volume to 1 L with HPLC-grade water
Filter sterilize (0.22 µm) and degas
-
HPLC separation buffer B (50 mM sodium phosphate pH = 5.10 with 15% (v/v) methanol)
Dissolve 1.7 g NaOH in 600 ml HPLC-grade water
Adjust pH to 5.10 with phosphoric acid
Bring up volume to 850 ml with HPLC-grade water
Add 150 ml methanol
Filter and degas. Seal container to protect from evaporation
-
HPLC desalting buffer A
HPLC-grade water with 0.05% (v/v) trifluoroacetic acid
-
HPLC desalting buffer B
50% acetonitrile (50% HPLC-grade water) with 0.05% (v/v) trifluoroacetic acid
Acknowledgments
This work was supported by NIH grant R01 AI097157. Dr. Dillard has consulted for, and received consulting fees from, Pfizer Inc. for work related to their Neisseria meningitidis vaccine patents. This protocol was adapted from (Dougherty, 1985) and ( Glauner et al., 1988 ).
Citation
Readers should cite both the Bio-protocol article and the original research article where this protocol was used.
References
- 1.Antignac A., Boneca I. G., Rousselle J. C., Namane A., Carlier J. P., Vazquez J. A., Fox A., Alonso J. M. and Taha M. K.(2003). Correlation between alterations of the penicillin-binding protein 2 and modifications of the peptidoglycan structure in Neisseria meningitidis with reduced susceptibility to penicillin G . J Biol Chem 278(34): 31529-31535. [DOI] [PubMed] [Google Scholar]
- 2.Antignac A., Rousselle J. C., Namane A., Labigne A., Taha M. K. and Boneca I. G.(2003). Detailed structural analysis of the peptidoglycan of the human pathogen Neisseria meningitidis . J Biol Chem 278(34): 31521-31528. [DOI] [PubMed] [Google Scholar]
- 3.Araki Y., Nakatani T., Hayashi H. and Ito E.(1971). Occurrence of non-N-substituted glucosamine residues in lysozyme-resistant peptidoglycan from Bacillus cereus cell walls . Biochem Biophys Res Commun 42(4): 691-697. [DOI] [PubMed] [Google Scholar]
- 4.Clarke A. J. and Dupont C.(1992). O-acetylated peptidoglycan: its occurrence, pathobiological significance, and biosynthesis . Can J Microbiol 38(2): 85-91. [DOI] [PubMed] [Google Scholar]
- 5.Clarke T. B. and Weiser J. N.(2011). Intracellular sensors of extracellular bacteria. Immunol Rev 243(1): 9-25. [DOI] [PubMed] [Google Scholar]
- 6.Desmarais S. M., De Pedro M. A., Cava F. and Huang K. C.(2013). Peptidoglycan at its peaks: how chromatographic analyses can reveal bacterial cell wall structure and assembly. Mol Microbiol 89(1): 1-13. [DOI] [PMC free article] [PubMed] [Google Scholar]
- 7.Dougherty T. J.(1985). Analysis of Neisseria gonorrhoeae peptidoglycan by reverse-phase, high-pressure liquid chromatography . J Bacteriol 163(1): 69-74. [DOI] [PMC free article] [PubMed] [Google Scholar]
- 8.Glauner B.(1988). Separation and quantification of muropeptides with high-performance liquid chromatography. Anal Biochem 172(2): 451-464. [DOI] [PubMed] [Google Scholar]
- 9.Glauner B., Holtje J. V. and Schwarz U.(1988). The composition of the murein of Escherichia coli . J Biol Chem 263(21): 10088-10095. [PubMed] [Google Scholar]
- 10.Holtje J. V. and Tuomanen E. I.(1991). The murein hydrolases of Escherichia coli: properties, functions and impact on the course of infections in vivo . J Gen Microbiol 137(3): 441-454. [DOI] [PubMed] [Google Scholar]
- 11.Kato K. and Strominger J. L.(1968). Structure of the cell wall of Staphylococcus aureaus. IX. Mechanism of hydrolysis by the L11 enzyme . Biochemistry 7(8): 2745-2761. [PubMed] [Google Scholar]
- 12.Kuhner D., Stahl M., Demircioglu D. D. and Bertsche U.(2014). From cells to muropeptide structures in 24 h: peptidoglycan mapping by UPLC-MS. Sci Rep 4: 7494. [DOI] [PMC free article] [PubMed] [Google Scholar]
- 13.Markiewicz Z., Glauner B. and Schwarz U.(1983). Murein structure and lack of DD- and LD-carboxypeptidase activities in Caulobacter crescentus . J Bacteriol 156(2): 649-655. [DOI] [PMC free article] [PubMed] [Google Scholar]
- 14.Pisabarro A. G., de Pedro M. A. and Vazquez D.(1985). Structural modifications in the peptidoglycan of Escherichia coli associated with changes in the state of growth of the culture . J Bacteriol 161(1): 238-242. [DOI] [PMC free article] [PubMed] [Google Scholar]
- 15.Schleifer K. H. and Kandler O.(1972). Peptidoglycan types of bacterial cell walls and their taxonomic implications. Bacteriol Rev 36(4): 407-477. [DOI] [PMC free article] [PubMed] [Google Scholar]
- 16.Ward J. B.(1973). The chain length of the glycans in bacterial cell walls. Biochem J 133(2): 395-398. [DOI] [PMC free article] [PubMed] [Google Scholar]