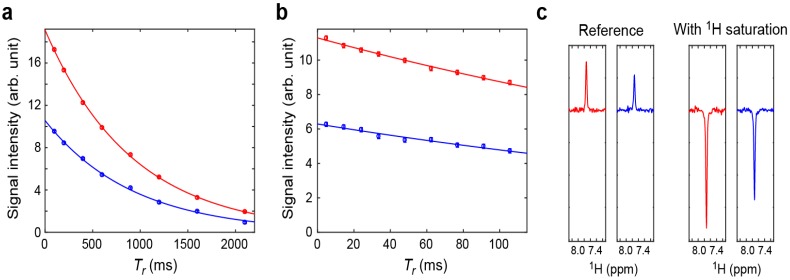
Figure 3.
Comparison of the previous [15] and current pulse sequences for measuring 15N relaxation of NH3+ groups. (a,b) 15N longitudinal (Panel a) and transverse (Panel b) relaxation of the K46 NH3+ group. The vertical axis represents the signal intensity in the two-dimensional spectra measured as a function of the relaxation period Tr. Solid lines represent the best-fit curves obtained through nonlinear least-squares fitting with a mono-exponential function; (c) Slices of the K46 NH3+ signals along the 1H dimension from the two-dimensional spectra with and without 1H saturation for the heteronuclear NOE measurements. In each panel, data obtained with the previous and current pulse sequences are shown in blue and red, respectively.

