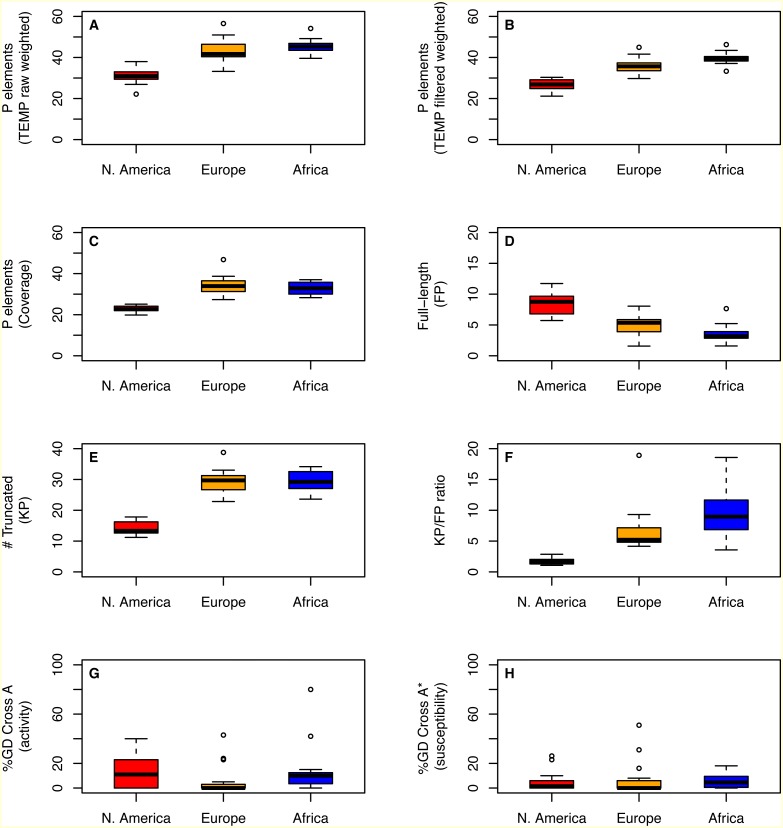
Figure 2. Distribution of P element content and GD phenotypes for isofemale strains within and between three worldwide populations of D. melanogaster.
Distributions for total number of predicted P elements, full-length P elements (FP), ratio of truncated to full-length elements (KP∕FP ratio), and %GD in A and A* crosses are shown as boxplots with black lines representing median values, boxes representing the interquartile range (IQR), whiskers representing the limits of values for strains that lie within 1.5 × IQR of the upper or lower quartiles, and circles representing strains that lie outside 1.5 × IQR of the upper or lower quartiles. GD data are taken from Ignatenko et al. (2015) and were standardized to definitions proposed by Engels & Preston (1980) prior to re-analysis here. Numbers of P elements predicted by TEMP shown are before (raw) and after (filtered) standard filtering by McClintock and are weighted by sample frequency. Analogous results for unweighted output of TEMP or RetroSeq are shown in Fig. S1.

