Abstract
Magnetic Resonance Imaging (MRI) has become an indispensable tool in the diagnosis and treatment of many diseases, especially cancer. However, the poor sensitivity of MRI relative to other imaging modalities, such as PET, has hindered the development and clinical use of molecular MRI contrast agents that could provide vital diagnostic information by specifically locating a molecular target altered in the disease process. This work describes the specific and sustained in vivo binding and retention of a protein tyrosine phosphatase mu (PTPμ)-targeted, molecular MR contrast agent with a single gadolinium (Gd) chelate using a quantitative MRI T1 mapping technique in glioma xenografts. Quantitative T1 mapping is an imaging method used to measure the longitudinal relaxation time, the T1 relaxation time, of protons in a magnetic field after excitation by a radiofrequency pulse. T1 relaxation times can in turn be used to calculate the concentration of a gadolinium-containing contrast agent in a region of interest, thereby allowing the retention or clearance of an agent to be quantified. In this context, retention is a measure of molecular contrast agent binding. Using conventional peptide chemistry, a PTPmu-targeted peptide was linked to a chelator that had been conjugated to a lysine residue. Following complexation with Gd, this PTPmu-targeted molecular contrast agent containing a single Gd ion showed significant tumor enhancement and a sustained increase in Gd concentration in both heterotopic and orthotopic tumors using dynamic quantitative MRI. This single Gd-containing PTPmu agent was more effective than our previous version with three Gd ions. Differences between non-specific and specific agents, due to specific tumor binding, can be determined within the first 30 minutes after agent administration by examining clearance rates. This more facile chemistry, when combined with quantitative MR techniques, allows for widespread adoption by academic and commercial entities in the field of molecular MRI ultimately leading to improved detection of disease.
Keywords: Magnetic resonance imaging, T1 mapping, Cancer imaging, Tumor detection, Contrast agent, Protein Tyrosine Phosphatase, Glioma, Brain Tumor
TOC image
Introduction
Magnetic resonance imaging (MRI) is standard of care for the diagnosis and treatment of many cancer types, due to its high spatial resolution and diverse set of endogenous soft tissue image contrasts. Currently, conventional non-targeted paramagnetic MRI contrast agents (CAs) composed of gadolinium (Gd) chelates, such as Multihance or Magnevist, are used to provide non-specific enhancement of pathologies to complement endogenous tissue contrasts. For cancer imaging applications, these clinical, non-targeted MRI CAs remain extracellular and highlight tumors by virtue of illustrating pathological blood flow patterns in the immediate vicinity of a tumor. CAs, such as these, increase MR sensitivity by reducing the T1 relaxation times of nearby water protons in a concentration-dependent manner. Anatomic areas with faster T1 relaxation times appear brighter in T1-weighted images. Despite its advantages, the inherent low sensitivity of MRI has impeded the development and clinical use of molecular MR agents directed towards specific biologic targets. Theoretically, MRI sensitivity can be increased using contrast agents with higher relaxivities as they in turn cause greater reductions in proton relaxation times. Several strategies, such as incorporating more Gd ions, have been used to yield CAs with higher relaxivity.1,2 Another strategy is to use a targeted or molecular contrast agent, which will bind to a site of interest at a concentration sufficient to more effectively alter the local water relaxation time.3
A tumor-specific cleaved fragment of the protein tyrosine phosphatase mu (PTPμ) is specifically expressed in cancer and represents an excellent targeting moiety for molecular imaging.4–7 Peptides that bind this tumor specific biomarker, including SBK2, have been used to generate optical imaging and contrast agents.4–7 Previous studies using heterotopic glioma xenograft models demonstrated that a PTPμ-targeted MRI agent with 3 Gd chelates labeled flank tumors more effectively than non-specific contrast agents.5,6 The chelator used was the polydentate ligand 1,4,7,10-tetraazacyclododecane-1,4,7,10-tetraacetic acid (DOTA). A dynamic, quantitative T1 mapping strategy was implemented to objectively evaluate the in vivo intra-tumoral concentration of the PTPμ-targeted contrast agent [SBK2-Tris-(Gd-DOTA)3] over time.6 These results demonstrated that a PTPμ-targeted agent with three Gd ions was retained in the tumor and showed increased and sustained intra-tumoral concentration in comparison to both a Scrambled-Gd control agent and the non-specific clinical contrast agent Optimark.6 This effect required a dose of 0.2mmol Gd/kg, twice the dose typically used for clinical agents.6 Enhanced intra-tumoral retention was indicated by the percent change in T1 value as well as by calculations of local Gd concentration.6
Most molecular contrast agents utilize complicated linkers with multiple Gd ions or even nanoparticles for detection. In this paper, we describe the generation of a PTPμ-targeted, peptide-based molecular imaging contrast agent with a single Gd, SBK2-Lys-(Gd-DOTA), using conventional chemical synthesis methods which can be readily used with other targeting peptides. Very few examples of molecular agents exist in the literature that utilize a single Gd ion and effectively enhance a tumor target.8–14 Most of these studies use either a change in MR signal derived from qualitative images or long acquisition times that do not allow for dynamic quantitative comparisons. Even fewer examples exist where these single Gd molecular agents have been subjected to quantitative MR techniques that allow for comparisons of sensitivity.10 For the studies described here, T1 mapping was utilized in order to allow absolute T1 relaxation values to be determined. T1 mapping has recently garnered intense interest in Cardiovascular Magnetic Resonance (CMR) due to its ability to provide direct T1 values, which lead to improved tissue characterization by MRI (reviewed in15–18). In addition, we wanted to utilize a dynamic acquisition method to allow us to determine whether these agents differed in their ability to bind to a particular location or whether they simply flowed through the tissue. Specific binding events between a ligand/receptor occur within minutes and change over time. We demonstrate here the use of a molecular imaging agent with a dynamic quantitative T1 mapping MR method that allows for calculation of Gd concentration over time. We show in both heterotopic and orthotopic mouse models of glioma that the single Gd molecular contrast agent, SBK2-Lys-(Gd-DOTA), displays sustained binding to tumors in comparison to a non-specific peptide-based control agent. For the first time, our dynamic quantitative MRI data show that use of a single Gd, when combined with an appropriate peptide, generates a molecular contrast agent that specifically recognizes tumors in vivo. The single Gd molecular contrast agent exhibits sustained binding and Gd retention in tumors thus enhancing detection compared to a non-specific agent using MRI.
Experimental Section
Reagents
The Fmoc-protected amino acids, 2-chlorotrityl chloride resin, (0-(6-chlorobenzotriazol-1-yl)-N,N,N′,N′-tetramethyluronium hexafluorophosphate (HCTU) and benzotriazol-1-yl-oxy-tris-(pyrrolidino) phosphonium hexafluorophosphate (PyBOP) used for peptide synthesis were purchased from Chem-Impex International, Inc. (Wood Dale, IL, USA). The source of the following chemicals are: Sigma-Aldrich (St. Louis, MO, USA) for anhydrous N,N-diisopropylethyl amine (DIPEA), trifluoroacetic acid (TFA), 2,2′-(ethylenedioxy)diethanethiol (DODT), triisopropylsilane, 4-methyl piperidine, α-cyano-4-hydroxycinnamic acid (CHCA), ammonium bicarbonate, ammonium acetate and meglumine; Fisher Scientific (Pittsburgh, PA, USA) for N,N-dimethylformamide (DMF) and dichloromethane; Apex Bio Technology (Houston, TX, USA) for anhydrous 1-hydroxybenzotriazole (HOBt); Strem Chemicals (Newburyport, MA, USA) for gadolinium (III) acetate tetrahydrate; Macrocyclics, Inc. (Plano, TX, USA) for Fmoc-L-Lys-mono-amide-DOTA-tris (t-Bu ester). Multihance® was purchased from Bracco Diagnostics, Optimark® was purchased from Mallinckrodt Pharmaceuticals (St. Louis, MO, USA), Magnevist® was purchased from Bayer Healthcare Pharmaceuticals, Inc. (Wayne, NJ, USA), and saline was obtained from Hospira, Inc. (Lake Forest, IL, USA).
Synthesis and Characterization of SBK2-Lys-(Gd-DOTA) and Scrambled-Lys-(Gd-DOTA) Agents
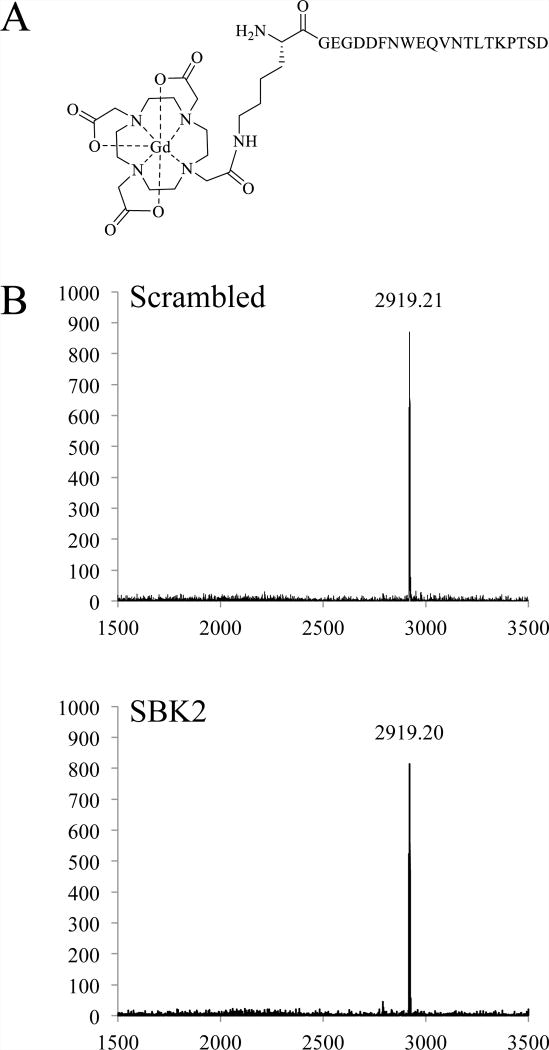
Synthesis of the PTPμ targeted peptide, SBK2 (GEGDDFNWEQVNTLTKPTSD), and a Scrambled control peptide (GTQDETGNFDWPVSEDLNKT) was done using conventional solid-phase synthesis methods and FMOC-protected amino acids on a CS Bio CS336X automated peptide synthesizer using HCTU as the coupling agent. Fmoc-L-Lys-mono-amide-DOTA-tris (t-Bu ester) was manually coupled to each peptide using PyBOP and HOBt as the coupling agents. Purity was assessed using analytical RP-HPLC with an Eclipse XDB-C18, 4.6 × 150 mm, 5 μm column (Agilent Technologies, Santa Clara, CA, USA). By HPLC, purity of the peptides was >99%. Matrix-assisted laser desorption/ionization time-of-flight (MALDI-TOF; Autoflex Speed, Bruker Corp., Billerica, MA, USA) using CHCA as a matrix was used to confirm molecular weights. Complexation reactions were carried out at 37°C over several days with constant monitoring to maintain the pH of the reactions between 5.0 and 6.0 in order to balance the solubility of the acidic SBK2 and Scrambled peptides with the solubility of Gd acetate. For these reactions, the peptide conjugates were dissolved in 0.05 M ammonium bicarbonate to obtain 20 mg/mL, pH 5.5–6.0 solutions. 1–2 molar equivalents of Gd acetate tetrahydrate, 100 mM, pH 5.0 were gradually added over time until 10 molar equivalents of Gd in total were added. Completeness of the complexation reactions was assessed by MALDI-TOF using CHCA as a matrix. Once complete, the pH of the reactions was raised to 8.0 with ammonium bicarbonate to precipitate any uncomplexed Gd and centrifuged (10 min, room temperature, 2800 × g). The supernatants were loaded into cellulose ester dialysis membranes, MWCO 500–1000D (Spectrum Laboratories, Inc., Rancho Dominquez, CA, USA) and dialyzed extensively. Two exchanges of 50 mM ammonium acetate buffer were followed by one exchange with 50 mM ammonium bicarbonate buffer, one exchange with 20 mM ammonium bicarbonate and two exchanges with 10 mM ammonium bicarbonate. The dialyzed products were filtered through 0.2 μm filters and lyophilized. The Gd content of the final products was measured using inductively coupled plasma optical emission spectroscopy (ICP-OES) (Agilent 730 Axial ICP-OES; Agilent Technologies, Wilmington, DE, USA). In addition, Arsenazo III was used to confirm the absence of free Gd. The molecular weights of the final products were confirmed by MALDI-TOF as shown in Figure 1. The predicted molecular weight of both the SBK2 and Scrambled agent is 2922.13. By MALDI-TOF, (m/z, M+) for the SBK2 agent was observed to be 2919.20, and for the Scrambled agent, 2919.21.
Figure 1.
Structure of SBK2-Lys-(Gd-DOTA). (A) The macrocyclic chelator DOTA, attached to a lysine, was coupled to the N-terminal glycine of the PTPμ targeted peptide, SBK2, via an amide bond. The control agent, Scrambled-Lys-(Gd-DOTA), has the same structure but differs in the order of amino acids in the peptide. (B) MALDI-TOF spectra of the Scrambled-Lys-(Gd-DOTA) and SBK2-Lys-(Gd-DOTA) following complexation. The x axis is m/z and the y axis is intensity (a.u.).
T1 relaxation constants for the agents were measured on the Bruker Biospec 9.4T MRI scanner (Bruker Corp., Billerica, MA, USA) at 37 °C using the T1 mapping acquisition described previously.6 For this in vitro study, 100 signal averages were acquired for determination of the agent relaxivities (r1). The T1 relaxivities were obtained by measuring a dilution series of two lots of each agent on three separate occasions using saline as the diluent. A 60 MHz Bruker Minispec Relaxometer at 37°C also was used to measure T1 and T2 relaxation constants. T1 relaxation constants were measured with an inversion recovery pulse sequence and a Carr-Purcell-Meiboom-Gill sequence with 5000 data points was used to measure T2 relaxation constants.
Cell Culture and Flank Tumor Implants
The NIH athymic nude female mice were bred in the Athymic Animal Core Facility. The Institutional Animal Care and Use Committee approved all of the animal protocols. The human LN-229 glioma cell line from the American Type Culture Collection (Manassas, VA, USA) was stably-infected with lentivirus encoding green fluorescent protein (GFP) and cultured as previously described.4 The cells were diluted with BD Matrigel Matrix (BD Biosciences, Franklin Lakes, NJ, USA) prior to injecting 2 × 10⁶ cells into each right flank of the nude athymic mice (NCr-nu/+, NCr-nu/nu, 20–25 g each) as previously described.4
Cell Culture and Orthotopic Xenograft Intracranial Tumors
The CNS-1 cells,19 a gift from Mariano S. Viapiano, were cultured in RPMI medium supplemented with 5% fetal bovine serum. CNS-1 cells were infected with lentivirus to express GFP 48 h prior to harvesting.4 Cells were harvested for intracranial implantation by trypsinization and concentrated to 2.5×10⁴ cells/microliter of phosphate-buffered saline (PBS). Mice 6 to 7 weeks of age were anesthetized and prepared for intracranial injection as previously described.6 Cells were deposited at a rate of 1 μL per min for a total of 50,000 cells into the right striatum at a depth of 1.5–2 mm from the dura using a 10 μL syringe (26-gauge needle; Hamilton Co, Reno, NV). The needle was slowly withdrawn, bone wax (Fine Science Tools, Foster City, C, USA) was used to seal the hole, and the incision was closed with sutures. Mice were imaged as described below 7 days post tumor implantation.
Molecular Imaging of Tumors with MRI
We performed MRI using a Bruker Biospec 9.4 T preclinical MRI scanner (Bruker Corp., Billerica, MA, USA) with a 35 mm inner diameter mouse body radiofrequency (RF) coil as described previously.6,20 Mice bearing LN-229 flank tumors were imaged at 4–8 weeks post-implantation for the heterotopic xenograft study. Mice implanted with orthotopic CNS-1 tumors were imaged 7 days post-implantation. Agents were dissolved in saline/20U heparin, and 100 mM sterile meglumine was added as needed to modify the pH to between 7 and 8 and delivered intravenously as previously described.6,20 Mice were administered an equal concentration of Gd based on weight. Different doses from 0.1 to 0.2 mmol·Gd/kg, as indicated, were administered to flank tumor bearing mice. A group of 4 mice was used for each agent at each dose, except for Scrambled-Lys-(Gd-DOTA) at 0.1mmol/kg where 5 mice were used and SBK2-Lys-(Gd-DOTA) at 0.125mmol/kg where 8 mice were used. For mice with intracranial CNS-1 tumors, 0.2 mmol·Gd/kg was used, and groups of 4 mice were used for each agent. After five baseline, pre-contrast T1 map scans, the targeted SBK2-Lys-(Gd-DOTA) agent or the non-targeted Scrambled-Lys-(Gd-DOTA) control was injected at the indicated dose in 150 μL followed by a 50 μL flush of saline. T1 maps were consecutively acquired every 2.5 min over 62.5 min (flank tumors) or 45 min (intracranial tumors).
Calculation of T1 Mapping Values, Gd Concentration, and Clearance Rates
The analysis of T1 relaxation times and calculation of Gd concentration has been described previously.6,20,21 Flank tumors were clearly visible in both the T2-weighted and T1 scans. Flank tumor regions of interest (ROIs) were manually outlined in MATLAB along with a “control” area where no obvious blood vessels or anatomic features were visible by either scan type. The same ROI for tumor and controls were then applied to all of the T1 mapping images and the average T1 map value was calculated. Normalized T1 maps were calculated by dividing all T1 relaxation times by the mean pre-contrast T1 values. To calculate Gd concentrations, T1 relaxivity constants determined at 9.4T were used along with absolute T1 map values and equation 1:
where C is the concentration of Gd (mM), T1 is the relaxation time (in seconds), T1,pre is an average baseline T1 map value (in seconds) and r1 is the magnetic relaxivity constant for the contrast agent (mM−1s−1). All relaxivity constants are presented on a per Gd basis.
The clearance rates for the agents in flanks at each dose were determined by calculating the change in mean T1 relaxation time over the time interval indicated after the agents were administered. A two-tailed Student’s t-test was used to assess statistical significance.
As in our previous work, we calculated quantitative T1 maps for the entire brain on a pixel-by-pixel basis and converted these values into heat maps to better visualize changes in T1 relaxation times. To identify ROIs for tumor and contralateral control areas, the set of post-injection scans were averaged together and used to accurately draw both tumor and control ROIs. These were then applied to each individual T1 map scan. As with the flank tumors, the T1 relaxation time maps were normalized and the clearance rates for each agent were calculated by determining the change in T1 map value over time from 20 to 35 min after administering the agent.
Results and Discussion
Standard chemical synthesis methods were used to generate the PTPμ specific agent, SBK2-Lys-(Gd-DOTA), along with a non-specific control agent, Scrambled-Lys-(Gd-DOTA). Synthesis of these agents consisted of conventional solid phase peptide synthesis with commercially available Fmoc-L-Lys-mono-amide-DOTA-tris (t-Bu ester) added at the N-terminus of both SBK2 and Scrambled peptides. Following synthesis of the peptide-based conjugates, complexation with Gd acetate was performed, followed by extensive dialysis and lyophilization to generate the final products. Figure 1 shows the structure of SBK2-Lys-(Gd-DOTA), which has a predicted molecular weight of 2922.13. MALDI-TOF spectra for both the specific and control agents are shown in panel B of Figure 1. Gd content was measured using ICP-OES and lot specific measurements were used for dosing. At 9.4T, the T1 relaxivity for the SBK2-Lys-(Gd-DOTA) agent was 6.0±0.1 mM−1s−1 (mean±SE), and for Scrambled-Lys-(Gd-DOTA) agent, 5.9±0.1 mM−1s−1. For comparison, the clinical MRI contrast agents Optimark, Multihance, and Magnevist had the following T1 relaxivity constants measured at 9.4T: 4.5±0.1, 4.9±0.1, and 4.0±0.1 mM−1s−1, respectively. This simple synthesis contrasts with the more complex synthesis used to make the “first generation” PTPμ-based MR agent, SBK2-Tris-(Gd-DOTA)3, which contained three Gd ions. For the previously published agents, a complex tris-propargyl linker was used and coupled to SBK2 or the control peptide.5,6 Following this step, three (Gd-DOTA) moieties were added using the copper-catalyzed azide-alkyne cycloaddition reaction.5,6
We also measured the r1 and r2 constants at 60MHz to compare the relaxivities of these single-Gd agents with the relaxivities we previously obtained for the three Gd agents on a per Gd basis.5 Both r1 and r2 for these single Gd agents were very similar to those measured for the larger three Gd agents with MW of 4664.62. At 60MHz, the r1 and r2 constants (in mM−1s−1) were 8.4±0.1 and 10.1±0.2 for the SBK2-Lys-(Gd-DOTA) agent, and 8.5±0.1 and 9.9±0.3 for the Scrambled-Lys-(Gd-DOTA) agent. The r1 and r2 constants for SBK2-Tris-(Gd-DOTA)3 were previously found to be 8.3 mM−1s−1 and 10.0 mM−1s−1, and for Scrambled-Tris-(Gd-DOTA)3, the r1 and r2 constants were 8.7 mM−1s−1 and 10.8 mM−1s−1 respectively.5 Other investigators have reported obtaining similar r1 constants for peptide-based molecular agents with one and three Gd ions.22
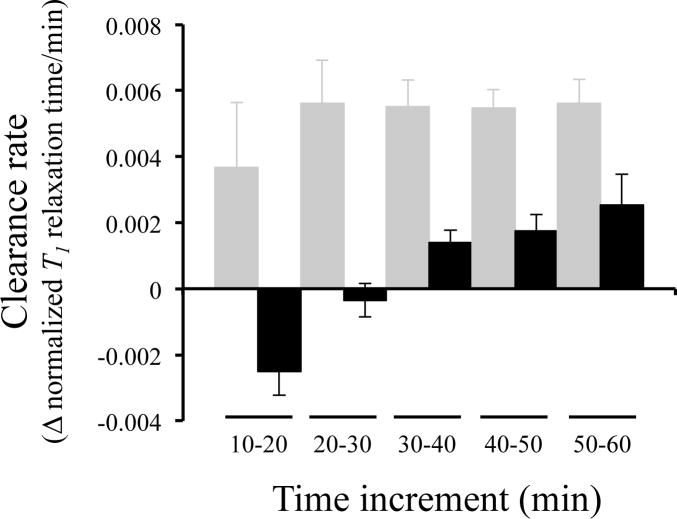
Quantitative T1 mapping was used to compare the ability of these single Gd agents to enhance heterotopic glioma xenograft LN-229 flank tumors. Our initial T1 mapping experiments used a concentration of 0.2mmol Gd/kg based upon our previous studies.5,6 We evaluated clearance rates over time between the SBK2 agent and that of the Scrambled agent (Figure 2). Distinct differences in clearance rate were observed between the two agents. SBK2 had a negative slope during the first 30 minutes after injection, which indicates binding of the SBK2 agent to its ligand during this time. At later time intervals, the clearance rates are positive as the agent clears out of the tumor. In contrast, the clearance rates for the Scrambled control agent are relatively constant and positive at all time intervals.
Figure 2.
SBK2-Lys-(Gd-DOTA) clears more slowly and at different rates compared to Scrambled-Lys-(Gd-DOTA). The clearance rate, calculated by the change in normalized T1 value over time, of each agent administered at 0.2mmol/kg in 10 minute increments are shown 10 minutes after injection of agent. The clearance rates for SBK2-Lys-(Gd-DOTA) (black columns) at increments from 10 to 50 min are significantly lower than those of the Scrambled agent (gray columns). The Scrambled agent demonstrates a relatively constant clearance rate from 20 – 60 min. The rate of SBK2 clearance is initially negative while SBK2 is binding to the tumor over the first 30 minutes. The T1 values gradually increase from 30–60 min indicating the SBK2 agent is clearing.
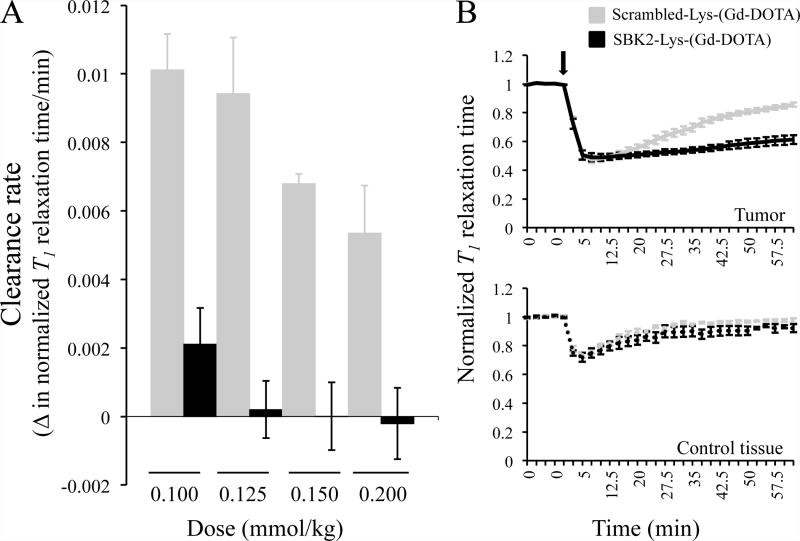
Next, four different doses of each agent, from 0.1 to 0.2 mmol Gd/kg, were evaluated to compare the specificity of the SBK2 agent to that of the Scrambled agent. As shown in Figure 3A, at all 4 doses the clearance rate of the SBK2 agent between 15 and 30 min after injection was significantly slower than that of the Scrambled agent. These lower clearance rates demonstrate specific in vivo binding and retention of SBK2-Lys-(Gd-DOTA) in contrast to the non-specific Scrambled-Lys-(Gd-DOTA). In the clinical setting, prolonged enhancement by a specific agent would broaden the available imaging window and thus be of considerable practical use.
Figure 3.
SBK2-Lys-(Gd-DOTA) shows sustained labeling of LN-229 heterotopic glioma xenografts in a dose dependent manner. (A) The rate of agent clearance was calculated from the change in T1 relaxation time/time (min) in mice with LN-229 flank tumors administered the indicated doses of each agent and determined between 15 and 30 min following injection of the agent. Each bar represents a group of 4–8 flank tumor-bearing animals. The clearance rates for SBK2 and the control agent are statistically significant at all 4 doses (p < 0.02). (B) Normalized T1 relaxation times over time for mice administered the indicated agent at 0.1mmol Gd/kg in LN-229 flank tumor (top) or a control area (bottom). The agents were injected following acquisition of 5 baseline scans. Upon injection (indicated by arrow), the normalized T1 relaxation times decrease at a similar rate and to a similar extent; the SBK2 agent shows a sustained decrease in normalized T1 time compared to Scrambled control. The lines show the mean +/− SE of 4 mice treated with SBK2 agent and 5 mice treated with Scrambled agent. T1 times obtained from tumor ROIs were significantly different from 25 min to 62.5 min post injection (p<0.05 at all time points: p=0.04 at 25 min, p= 0.02 at 27.5min, and p<0.01 for all other time points). No statistically significant differences in T1 times for the control tissue ROIs were observed.
A typical clinical dose of a conventional agent such as Multihance is 0.1 mmol Gd/kg. Figure 3B shows normalized T1 relaxation times for both SBK2- and Scrambled-Lys-(Gd-DOTA) at 0.1 mmol/kg. Following 5 baseline scans, the agents were injected and a rapid drop in normalized T1 is observed for both agents. This change in T1 occurs at a similar rate and to a similar extent at all doses for the two agents (data not shown for the three higher doses). In addition to requiring a more difficult synthesis, the earlier SBK2 agent required twice the dose needed for SBK2-Lys-(Gd-DOTA), 0.2 mmol Gd/kg compared to 0.1mmol Gd/kg to show specific binding and retention in flank tumors.6
After an initial drop in T1, both Gd-containing agents gradually clear out of non-tumor (“control”) tissue and return to baseline values as shown in the lower panel of Figure 3B. Normalized T1 relaxation times in tumor regions remain decreased for much longer in animals administered SBK2-Lys-(Gd-DOTA), compared to Scrambled-Lys-(Gd-DOTA). This suggests that SBK2-Lys-(Gd-DOTA), but not Scrambled-Lys-(Gd-DOTA), has specifically bound to its tumor-associated ligand and is retained over time. Based on experiments where T1 values were monitored for up to two hours, we estimate that the Scrambled-Lys-(Gd-DOTA) agent would clear from the tumor region in 2 hours while 4 hours would be required for clearance of the SBK2-Lys-(Gd-DOTA) agent (data not shown).
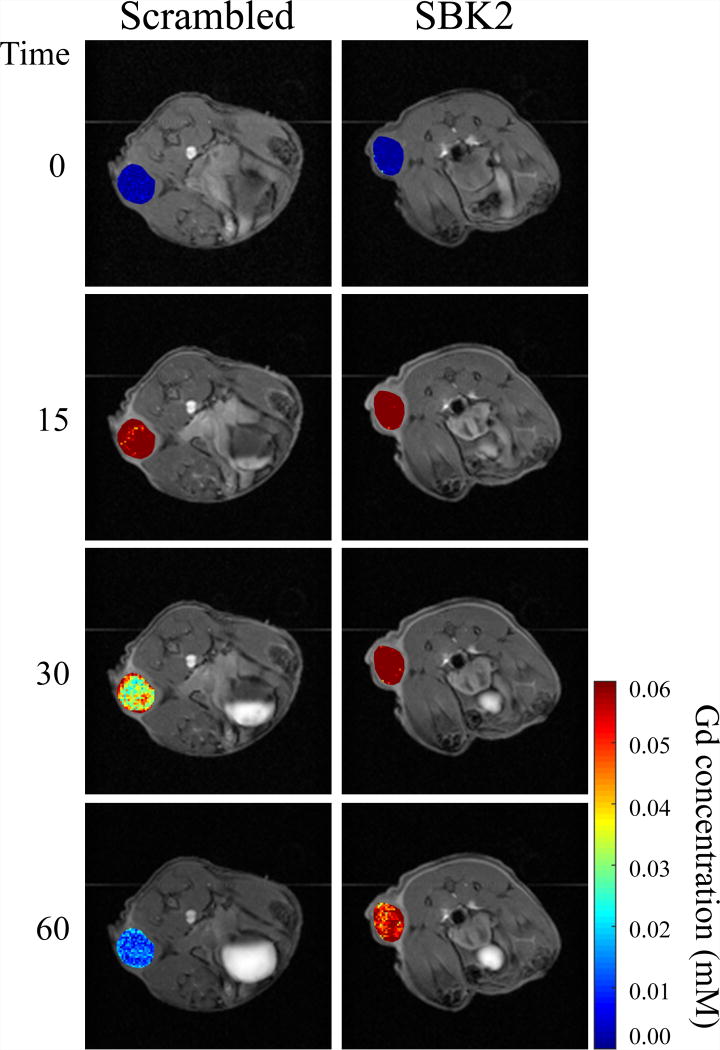
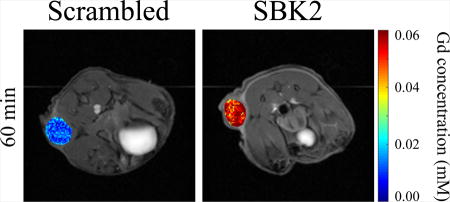
Intratumoral Gd concentrations at different times for SBK2-Lys-(Gd-DOTA) and Scrambled in representative animals are shown in Figure 4. Gd concentrations were calculated on a pixel-by-pixel basis using T1 relaxation times pre- and post-contrast in tumor ROIs and the in vitro r1 relaxivity constants obtained at 9.4T, before being converted to the heat maps shown. We hypothesize that binding of the SBK2 agent to its in vivo ligand may increase its in vivo r1 relaxivity constant. Since the Gd concentration calculated (equation 1) is inversely proportional to r1, the Gd concentrations shown may represent overestimates of the true Gd levels. For clarity, these were superimposed on the T1-weighted images that correspond to each time point shown. At time 0 (baseline), no Gd is detected in tumors from either animal. Fifteen minutes following injection of the agent, the Gd concentration in tumors from both sets of animals is approximately 0.06 mM. The concentration of Gd in the tumors of animals treated with SBK2-Lys-(Gd-DOTA) remains virtually unchanged at 30 min and is only slightly decreased by 60 min. This is in contrast to the Scrambled-treated animals, which have reduced Gd concentration at 30 min. Renal clearance of the agents is visible at 15 min in both groups of animals as indicated by the white signal accumulating in the bladders.
Figure 4.
LN-229 flank tumors in mice treated with SBK2-Lys-(Gd-DOTA) retain Gd longer than those in mice treated with the control agent. Representative Gd concentration maps of flank tumors overlaid onto T1-weighted images in animals treated with 0.1mmol Gd/kg of either the non-specific Scrambled agent (left) or SBK2 agent (right) at baseline (time 0), and at 15, 30 and 60 min following injection of the agent. The SBK2-Lys-(Gd-DOTA) concentration is sustained longer than the non-specific agent. The color bar indicates Gd concentration (mM) with blue representing no Gd and red representing 0.06 mM Gd.
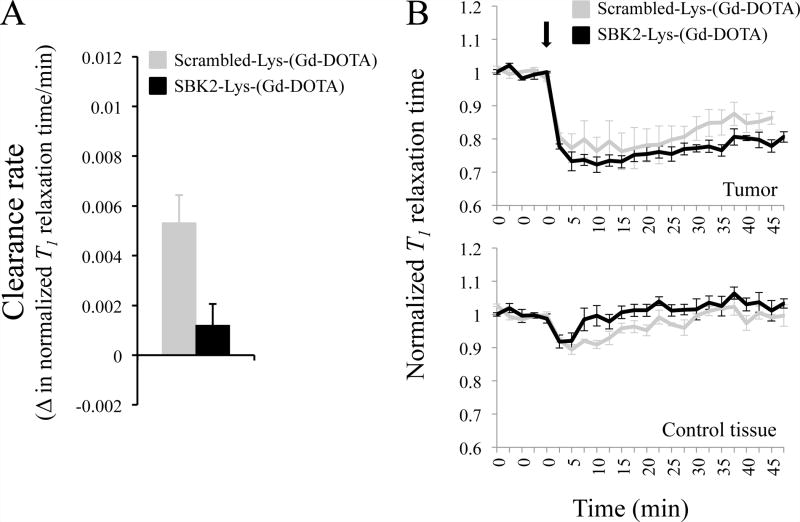
Finally, we tested the ability of the SBK2-Lys-(Gd-DOTA) to detect intracranial CNS-1 tumors. This tumor cell type is highly invasive and dispersive.23 Intracranial tumor centers were clearly visible by both T2-weighted and T1 scans; however, tumor margins were not possible to clearly distinguish. In contrast to imaging flank tumors, imaging of intracranial tumors is more difficult. T2-weighted, high-resolution MR images of the average cross sectional area of CNS-1 brain tumors is 2.2 mm2 (with a standard error of 0.3 mm2) compared to 20.7 mm2 (with a standard error of 2.8 mm2) for LN-229 flank tumors. Therefore, there is an almost 10 fold difference in size between the two different tumor models. It is likely that tumor recognition molecules, such as PTPμ, are present at a lower total number than in flank tumors simply due to size. In addition, circulating CAs have less access to intracranial tumors due to the blood brain barrier and higher intratumoral pressure.24,25 Nonetheless, we were able to specifically detect CNS-1 intracranial tumors with SBK2-Lys-(Gd-DOTA) (Figure 5). As shown in Figure 5A, the clearance rates as calculated by the change in normalized T1 relaxation value/time from 20 min to 35 min post injection are significantly different in the CNS-1 tumor-bearing animals receiving SBK2-Lys-(Gd-DOTA) compared to Scrambled-Lys-(Gd-DOTA). Following the initial drop in normalized T1, the SBK2 agent is cleared more slowly than the Scrambled agent from intracranial CNS-1 tumors (Figure 5B).
Figure 5.
SBK2-Lys-(Gd-DOTA) shows prolonged labeling of intracranial CNS-1 tumors at 0.2mmol Gd/kg compared to Scrambled-Lys-(Gd-DOTA). (A) The rate of agent clearance from 7 d CNS-1 tumors was determined by the change in T1 map value/time (min) from 20 to 35 min following intravenous injection of agent and is significantly different (p=0.026) between the mice treated with SBK2 and Scrambled agent. N=4 for each agent. (B) Normalized T1 map values over time for mice administered the indicated agent at 0.2mmol Gd/kg in CNS-1 intracranial tumor (top) or a contralateral control area (bottom). The agents were injected following acquisition of 5 baseline scans. Upon injection, the T1 map values decrease at a similar rate and to a similar extent but the SBK2 agent is cleared more slowly than the Scrambled agent in tumor. The lines show the mean +/− SE of 4 mice treated with SBK2 agent, and 4 mice treated with Scrambled agent. SBK2 and Scrambled agent show the same trend observed with flank tumors. The decrease in T1 signal is less pronounced in brains compared to flanks, despite twice the dose.
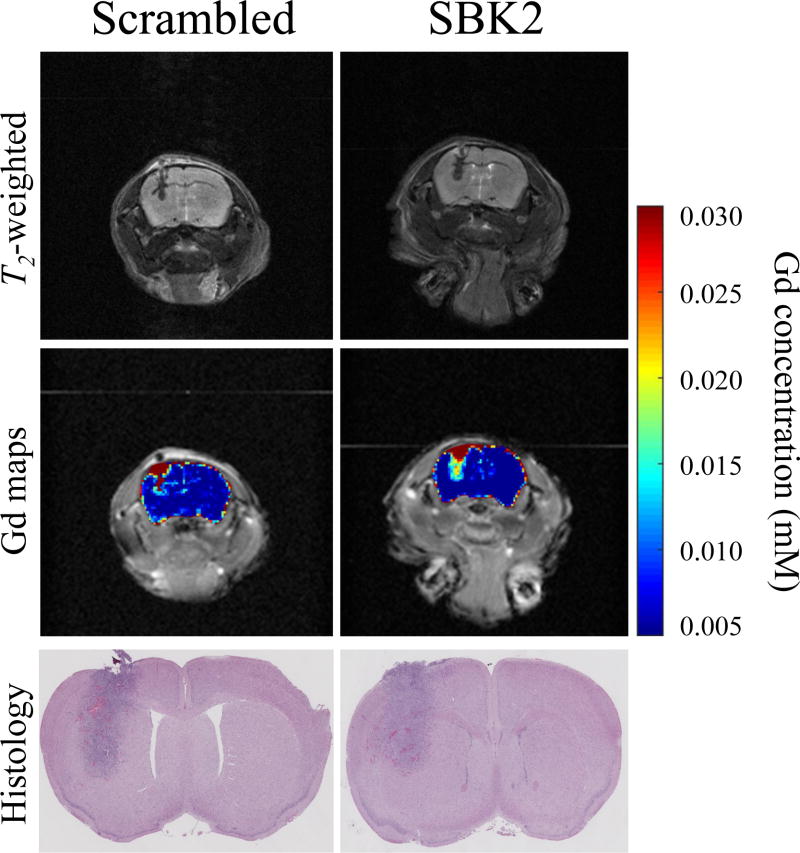
We were able to specifically detect CNS-1 intracranial tumors with SBK2-Lys-(Gd-DOTA), but this specific binding and corresponding slower clearance required 0.2mmol Gd/kg (Figure 5). Gd concentration maps (mM) are shown in Figure 6 along with High Resolution T2-weighted images delineating anatomic detail. Gd concentrations are calculated based on absolute T1 relaxation times pre- and post-contrast and in vitro r1 relaxivity constants measured at 9.4 T as described in equation 1. Note that the non-specific Scrambled agent has crossed the compromised blood brain barrier, as has been documented for other Gd-based contrast agents,24 and accumulates in the main tumor mass. Despite administering twice the dose, the highest Gd concentration (0.03 mM) is about half that detected in flank tumors (max of 0.06 mM). Figure 6 shows enhanced binding the SBK2-Lys-(Gd-DOTA) agent to the tumor relative to the Scrambled-Lys-(Gd-DOTA) agent. Viewed in light of the histology, the Gd concentration map of the SBK2-Lys-(Gd-DOTA) highlights to a fuller extent this invasive tumor compared to the control (Figure 6).
Figure 6.
Orthotopic intracranial CNS-1 tumors in mice treated with SBK2-Lys-(Gd-DOTA) highlights a fuller extent of the tumor compared to those in mice treated with the control agent. High resolution T2-weighted images for representative animals treated with 0.2 mmol Gd/kg of either Scrambled-Lys-(Gd-DOTA) (left) or SBK2-Lys-(Gd-DOTA) (right) are shown at the top. Heat maps depicting average post-contrast Gd concentration throughout the brain are superimposed on T1-weighted images. T1 mapping scans from the time of agent injection out to 30 min were averaged together and the Gd concentration was determined on a pixel-by-pixel basis. The color bar indicates Gd concentration (mM) with blue representing no Gd and red representing 0.030 mM Gd. The corresponding histology of the brain is shown.
To date, most of the single Gd-containing CAs belong to a family of molecules based on domain 1 of the cell adhesion molecule CD2, termed ProCA1-CD2. These CAs utilize optimized metal-binding characteristics of the CD2 domain 1 to promote specific binding to a Gd ion. This protein-based chelate can be coupled to peptides or affibodies to confer targeting capabilities.9,11–14,24 Biochemical features of the protein chelate, as well as its size, presumably contribute to the high relaxivity values measured.9,11–14 While in vitro and in vivo characterization of these protein-based chelates suggest many promising features, they have yet to be used with dynamic quantitative MR imaging methods in vivo. Without dynamic quantitative MR analyses, it is not possible to determine whether their characteristics translate into improved in vivo sensitivity and/or targeting compared to conventional agents. In terms of imaging glioma cells as opposed to angiography,26 there are limited examples of molecular CAs that cross the blood brain barrier with a single Gd chelate. One promising example involves the use of an antibody to c-Met, the HGF receptor, linked to Gd-DTPA-albumin, reported to enhance a mouse model of glioma for up to 3 hours after administration.10 All other examples use Gd chelates with hundreds to thousands of Gd ions per targeting molecule. The PTPμ-directed CA, SBK2-Lys-(Gd-DOTA), with its single Gd chelate represents a significant advance in the field of molecular MR agents and tumor detection. Furthermore, the specific detection of tumors will allow for improved evaluation of therapeutic efficacy.
Conclusions
These data clearly demonstrate that single Gd-containing PTPμ molecular agents, when combined with dynamic quantitative MR imaging methods, can specifically bind to, be retained by, and enhance recognition of tumors in vivo for over an hour. Sustained tumor enhancement is likely to have a significant clinical benefit as it permits imaging to occur over longer periods of time. We propose two scenarios of how SBK2 could be used clinically with these quantitative techniques: 1) specific binding to a tumor could be determined by analyzing clearance rates during the first 30 min following agent administration. 2) Analogous to procedures used for PET scans, one could inject the agent, allowing nonspecific signal to clear the body (~30–40 min) and the specific signal to be retained only in the area of interest prior to performing the MRI. In addition to demonstrating that this conventional chemical approach generates a glioma specific SBK2 contrast agent, a similar approach can be used in the development of other molecular MR agents. These simplified molecular contrast agents will lead to improved tumor detection and monitoring of therapeutic efficacy in the clinic.
Acknowledgments
We thank Jason Vincent for technical assistance and Catherine Doller for assistance with histology.
Funding Sources
This work was funded by the National Institutes of Health grants R01-CA179956, P30 CA043703, P30 EY11373 and by the Tabitha Yee-May Lou Endowment Fund for Brain Cancer Research.
ABBREVIATIONS
- CAs
contrast agents
- Gd
gadolinium
- MR
magnetic resonance
- MRI
magnetic resonance imaging
- PTPμ
protein tyrosine phosphatase mu
- ROI
region of interest
Footnotes
Author Contributions
The manuscript was written through contributions of all authors. Mette Johansen, Ying Gao, and Melanie Hutnick performed the experiments and/or contributed to data analysis; Jonathan Pokorski contributed expertise in chemical synthesis and revised the manuscript; Mette Johansen, Chris Flask and Susann Brady-Kalnay conceived and designed the experiments; and Mette Johansen, Sonya Craig, Chris Flask and Susann Brady-Kalnay analyzed the data and wrote the paper. All authors have given approval to the final version of the manuscript.
References
- 1.Caravan P. Chem Soc Rev. 2006;35:512–523. doi: 10.1039/b510982p. [DOI] [PubMed] [Google Scholar]
- 2.Huang CH, Tsourkas A. Curr Top Med Chem. 2013;13:411–421. doi: 10.2174/1568026611313040002. [DOI] [PMC free article] [PubMed] [Google Scholar]
- 3.Aime S, Castelli DD, Crich SG, Gianolio E, Terreno E. Acc Chem Res. 2009;42:822–831. doi: 10.1021/ar800192p. [DOI] [PubMed] [Google Scholar]
- 4.Burden-Gulley SM, Gates TJ, Burgoyne AM, Cutter JL, Lodowski DT, Robinson S, Sloan AE, Miller RH, Basilion JP, Brady-Kalnay SM. Neoplasia. 2010;12:305–316. doi: 10.1593/neo.91940. [DOI] [PMC free article] [PubMed] [Google Scholar]
- 5.Burden-Gulley SM, Zhou Z, Craig SE, Lu ZR, Brady-Kalnay SM. Transl Oncol. 2013;6:329–337. doi: 10.1593/tlo.12490. [DOI] [PMC free article] [PubMed] [Google Scholar]
- 6.Herrmann K, Johansen ML, Craig SE, Vincent J, Howell M, Gao Y, Lu L, Erokwu B, Agnes RS, Lu ZR, Pokorski JK, Basilion J, Gulani V, Griswold M, Flask C, Brady-Kalnay SM. Diagnostics (Basel) 2015;5:318–332. doi: 10.3390/diagnostics5030318. [DOI] [PMC free article] [PubMed] [Google Scholar]
- 7.Burden-Gulley SM, Qutaish MQ, Sullivant KE, Tan M, Craig SE, Basilion JP, Lu ZR, Wilson DL, Brady-Kalnay SM. Int J Cancer. 2013;132:1624–1632. doi: 10.1002/ijc.27838. [DOI] [PMC free article] [PubMed] [Google Scholar]
- 8.Pais A, Gunanathan C, Margalit R, Biton IE, Yosepovich A, Milstein D, Degani H. Cancer Res. 2011;71:7387–7397. doi: 10.1158/0008-5472.CAN-11-1226. [DOI] [PMC free article] [PubMed] [Google Scholar]
- 9.Qiao J, Xue S, Pu F, White N, Jiang J, Liu ZR, Yang JJ. J Biol Inorg Chem. 2014;19:259–270. doi: 10.1007/s00775-013-1076-3. [DOI] [PMC free article] [PubMed] [Google Scholar]
- 10.Towner RA, Smith N, Doblas S, Tesiram Y, Garteiser P, Saunders D, Cranford R, Silasi-Mansat R, Herlea O, Ivanciu L, Wu D, Lupu F. J Cell Mol Med. 2008;12:174–186. doi: 10.1111/j.1582-4934.2008.00220.x. [DOI] [PMC free article] [PubMed] [Google Scholar]
- 11.Xue S, Yang H, Qiao J, Pu F, Jiang J, Hubbard K, Hekmatyar K, Langley J, Salarian M, Long RC, Bryant RG, Hu XP, Grossniklaus HE, Liu ZR, Yang JJ. Proc Natl Acad Sci U S A. 2015;112:6607–6612. doi: 10.1073/pnas.1423021112. [DOI] [PMC free article] [PubMed] [Google Scholar]
- 12.Wei L, Li S, Yang J, Ye Y, Zou J, Wang L, Long R, Zurkiya O, Zhao T, Johnson J, Qiao J, Zhou W, Castiblanco A, Maor N, Chen Y, Mao H, Hu X, Yang JJ, Liu ZR. Mol Imaging Biol. 2011;13:416–423. doi: 10.1007/s11307-010-0342-9. [DOI] [PMC free article] [PubMed] [Google Scholar]
- 13.Pu F, Qiao J, Xue S, Yang H, Patel A, Wei L, Hekmatyar K, Salarian M, Grossniklaus HE, Liu ZR, Yang JJ. Sci Rep. 2015;5:16214. doi: 10.1038/srep16214. [DOI] [PMC free article] [PubMed] [Google Scholar]
- 14.Pu F, Salarian M, Xue S, Qiao J, Feng J, Tan S, Patel A, Li X, Mamouni K, Hekmatyar K, Zou J, Wu D, Yang JJ. Nanoscale. 2016;8:12668–12682. doi: 10.1039/c5nr09071g. [DOI] [PMC free article] [PubMed] [Google Scholar]
- 15.Haaf P, Garg P, Messroghli DR, Broadbent DA, Greenwood JP, Plein S. J Cardiovasc Magn Reson. 2016;18:89. doi: 10.1186/s12968-016-0308-4. [DOI] [PMC free article] [PubMed] [Google Scholar]
- 16.Puntmann VO, Peker E, Chandrashekhar Y, Nagel E. Circ Res. 2016;119:277–299. doi: 10.1161/CIRCRESAHA.116.307974. [DOI] [PubMed] [Google Scholar]
- 17.Taylor AJ, Salerno M, Dharmakumar R, Jerosch-Herold M. JACC Cardiovasc Imaging. 2016;9:67–81. doi: 10.1016/j.jcmg.2015.11.005. [DOI] [PubMed] [Google Scholar]
- 18.Schelbert EB, Messroghli DR. Radiology. 2016;278:658–676. doi: 10.1148/radiol.2016141802. [DOI] [PubMed] [Google Scholar]
- 19.Kruse CA, Molleston MC, Parks EP, Schiltz PM, Kleinschmidt-DeMasters BK, Hickey WF. J Neurooncol. 1994;22:191–200. doi: 10.1007/BF01052919. [DOI] [PubMed] [Google Scholar]
- 20.Herrmann K, Erokwu BO, Johansen ML, Basilion JP, Gulani V, Griswold MA, Flask CA, Brady-Kalnay SM. Transl Oncol. 2016;9:147–154. doi: 10.1016/j.tranon.2016.02.004. [DOI] [PMC free article] [PubMed] [Google Scholar]
- 21.Jakob PM, Hillenbrand CM, Wang T, Schultz G, Hahn D, Haase A. J Magn Reson Imaging. 2001;14:795–799. doi: 10.1002/jmri.10024. [DOI] [PubMed] [Google Scholar]
- 22.Banerjee SR, Ngen EJ, Rotz MW, Kakkad S, Lisok A, Pracitto R, Pullambhatla M, Chen Z, Shah T, Artemov D, Meade TJ, Bhujwalla ZM, Pomper MG. Angew Chem Int Ed Engl. 2015;54:10778–10782. doi: 10.1002/anie.201503417. [DOI] [PMC free article] [PubMed] [Google Scholar]
- 23.Burden-Gulley SM, Qutaish MQ, Sullivant KE, Lu H, Wang J, Craig SE, Basilion JP, Wilson DL, Brady-Kalnay SM. Cancer Res. 2011;71:5932–5940. doi: 10.1158/0008-5472.CAN-11-1553. [DOI] [PMC free article] [PubMed] [Google Scholar]
- 24.Woodworth GF, Dunn GP, Nance EA, Hanes J, Brem H. Front Oncol. 2014;4:126. doi: 10.3389/fonc.2014.00126. [DOI] [PMC free article] [PubMed] [Google Scholar]
- 25.Boucher Y, Salehi H, Witwer B, Harsh GRT, Jain RK. Br J Cancer. 1997;75:829–836. doi: 10.1038/bjc.1997.148. [DOI] [PMC free article] [PubMed] [Google Scholar]
- 26.Liu Y, Yang Y, Zhang C. Int J Nanomedicine. 2013;8:1083–1093. doi: 10.2147/IJN.S39880. [DOI] [PMC free article] [PubMed] [Google Scholar]


