

Abstract
African-Americans have an increased risk of developing chronic and end-stage kidney disease, with much of it attributed to two common genetic variants in the APOL1 gene, termed G1 and G2. Direct evidence demonstrating that these APOL1 risk alleles are pathogenic is still lacking as the APOL1 gene is only present in some primates and humans; thus experimental proof of causality of these risk alleles for renal disease has been challenging. Here, we generated mice with podocyte-specific inducible expression of the APOL1 reference allele (termed G0) or each of the risk alleles (G1 or G2). We show that mice with podocyte-specific expression of either APOL1 risk allele, but not the G0 allele, develop functional (albuminuria, azotemia), structural (foot process effacement and glomerulosclerosis) and molecular (gene expression) changes that closely resemble the human kidney disease. Disease development was cell-type specific, and likely reversible, and the severity correlated with the level of expression of the risk allele. We further found that expression of the APOL1 risk alleles interferes with endosomal trafficking and blocks autophagic flux, leading ultimately to inflammatory-mediated podocyte death and glomerular scarring. In summary, this is the first in vivo demonstration that expression of APOL1 risk alleles are causal for altered podocyte function and glomerular disease.
Keywords: APOL1, podocytes, albuminuria, glomerulosclerosis, pyroptosis
Introduction
African-Americans have a 3–5-fold increased risk of developing chronic kidney disease (CKD) and end-stage renal disease (ESRD)1,2. Recent studies indicate that coding region variants (G1 and G2) in the apolipoproteinL1 (APOL1) gene explain much of this excess risk3,4. APOL1 variants contribute to about 70% of non-diabetic ESRD (up to 40% of all ESRD) in African-Americans, and are associated with focal segmental glomerulosclerosis (FSGS), hypertension-attributed ESRD and HIV associated nephropathy (HIVAN) with odds ratios of 17, 7.3 and 29, respectively5. Unlike most disease-associated high penetrant variants the G1 and G2 alleles are present in the general population with a relatively high allele frequency6–8. It appears that these variants emerged as a result of a positive selection, as they protect against African sleeping sickness, caused by the parasite Trypanosoma brucei rhodesiense8. APOL1 functions as a component of the trypanolytic factor. It is taken up by the parasite, incorporates into endosomal membranes and transits to the lysosome. The low lysosomal pH induces a conformational change in the protein and it forms a pore-forming channel. The resulting ion transport causes osmotic lysosomal swelling and parasite death. The reference (G0) APOL1variant has lost its trypanolytic function in T.b.rhodesiense due to the emergence of a trypanosomal protein (serum resistance associated; SRA) that binds to and neutralizes the activity of APOL1 protein9. APOL1 risk variants (G1 and G2) have decreased affinity to SRA, and are able to lyse T.b.rhodesiense subspecies4.
Surprisingly, even six years after the discovery of this genetic association, very little is known about the functional role of APOL1 variants in kidney disease development. Proof of concept experiments, using animal models demonstrating that APOL1 G1 (double missense mutations) and G2 (an indel) polymorphisms are causal mutations for kidney disease are lacking, and indeed some recent studies failed to recapitulate kidney disease in animals expressing one of risk alleles10. Some of the key barriers have been that mice and other model organisms lack the APOL1 gene. In humans, APOL1 expression does not show tissue specificity, making it difficult to identify the cell type critical for renal disease development11. Furthermore, the variant is seemingly associated with diverse clinical phenotypes, including hypertensive nephrosclerosis, FSGS, HIVAN and lupus nephritis12. Recent pathological studies indicate increased incidence of solidified-type global sclerosis in subjects with high-risk APOL1 genotypes compared to people with kidney disease who carry the reference allele13–15. Observational cohort studies show that high-risk genotype subjects have higher albuminuria and faster GFR decline16–18.
The goal of this study was to answer the question whether kidney-specific expression of APOL1-G1 and G2 variants causes kidney disease. To address this issue we generated a new mouse model with conditional and inducible expression of APOL1 reference (G0) and risk alleles (G1, G2). We found that podocyte-specific expression of APOL1 risk alleles, but not the G0 allele, causes severe albuminuria and glomerulosclerosis. We show that this model recapitulates features of the human phenotype at functional, structural and molecular levels, indicating that the G1 and G2 variants are disease- causing alleles. On the mechanistic level we show that APOL1 mostly resides in the late endosomal compartment and risk variants show altered vesicular trafficking, decreased autophagic flux and shifting of cells to an inflammatory death pathway.
Results
Podocyte-specific expression of G1 or G2 in mice leads to kidney disease
We used the doxycycline inducible (rtTA) system (Fig. 1a) to generate mice with podocyte-specific conditionally inducible APOL1 expression under doxycycline control. Using this transgenic system we expressed GFP and either the APOL1 reference allele (G0) or one of the two risk alleles (G1 or G2) (Supplementary Fig. 1) from a bicistronic promoter (TRE-GFP/APOL1). We used the nephrin (NPHS1) rtTA promoter to drive podocyte-specific expression. Successful transgene expression following doxycycline administration was confirmed by immunohistochemistry (Fig. 1a). We identified at least three founders from each transgenic line that produced offspring expressing APOL1 and GFP transcripts and proteins. Male littermates of these founders were used for all further analysis. Double transgenic mice (NPHS1-rtTA/TRE-APOL1) are called transgenic mice and single transgenic mice (TRE-APOL1) are controls.
Figure 1. Generation of a mouse model with cell-type-specific inducible expression of APOL1 variants.
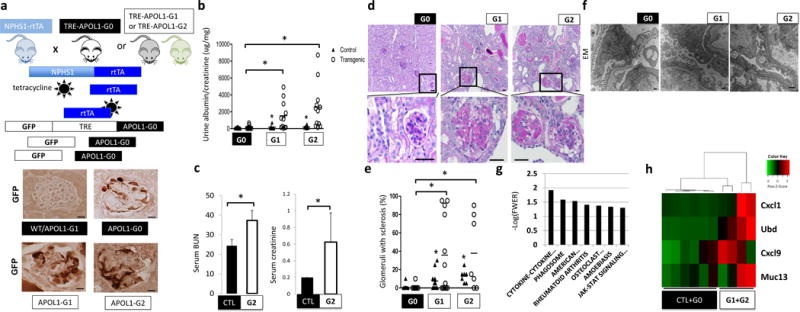
(a) Upper: schematic representation of mouse model generation. Lower: representative images of GFP immunostaining. (n = 15 per line) Scale bars, 10μm. (b) Urine albumin/creatinine ratio (ACR) of NPHS1-rtTA/TRE-APOL1-G0 (n = 11), NPHS1-rtTA/TRE-APOL1-G1 (n = 11), NPHS1-rtTA/TRE-APOL1-G2 (n = 12) mice. Single transgenic littermates served as controls (ctl) (n = 8, 6, 6 for G0, G1 and G2, respectively). Statistics was calculated by Student’s t-test, P = 0.0154 (G0 vs. G1), P=0.0077 (G0 vs. G2). (c) Serum blood urea nitrogen (BUN) and creatinine levels of control (CTL) (n = 6) and NPHS1-rtTA/TRE-APOL1-G2 (n = 4) mice on doxycycline diet for 12–19 days. Student’s t-test, P = 0.0042 (BUN), P = 0.0279 (creatinine). The data are presented as means ± s.d. (d) Representative PAS-stained kidney images of NPHS1-rtTA/TRE-APOL1-G0, NPHS1-rtTA/TRE-APOL1-G1 and NPHS1-rtTA/TRE-APOL1-G2 mice. The bottom images are higher magnifications of the boxed regions in the top images. (n > 5 per line) Scale bars: upper panels: 20μm; lower panels: 10μm. (e) Quantification of the histological findings of NPHS1-rtTA/TRE-APOL1-G0 (n = 12), NPHS1-rtTA/TRE-APOL1-G1 (n = 12), NPHS1-rtTA/TRE-APOL1-G2 (n = 7) mice. Student’s t-test, P = 0.0087 (G0 vs. G1), P = 0.0048 (G0 vs. G2). (f) Representative transmission electron micrographs (TEM) of NPHS1-rtTA/TRE-APOL1-G0/G1/G2 mice. (n = 26, 74, 54 for G0, G1, G2 mice, respectively) Scale bar: 500nm. (g) Differentially expressed pathways by RNAsequencing identified using gene set enrichment analysis. Y-axis log (p) of the false discovery rate (FWER: family-wise error rate). (h) Heatmap analysis of mouse orthologs of Ubd, Cxcl9, Cxcl1 and Muc13, previously reported to be differentially expressed in APOL1 high vs. low risk allele nephrotic syndrome subjects. Higher transcript levels are shown in red, while lower in green.
Littermates of double and single transgenic mice were placed on doxycycline diet at 3.5 weeks of age. Risk allele transgenic mice developed significant proteinuria as early as three weeks after doxycycline diet induction (data not shown). Both risk allele transgenic mice (NPHS1-rtTA/TRE-APOL1-G1 and NPHS1-rtTA/TRE-APOL1-G2) had significantly higher mean urinary albumin to creatinine ratio (ACR) compared to reference allele transgenic mice (NPHS1-rtTA/TRE-APOL1-G0) (Fig. 1b). Kidney functional analysis, including measurements of serum blood urea nitrogen (BUN) and serum creatinine, showed that mice expressing the G2 risk allele had significant azotemia compared to control (wild type) mice (Fig. 1c). The significant azotemia likely contributed to the greater mortality observed in G2 risk allele expressing mice compared to mice expressing reference (G0) allele (Supplementary Fig. 2a).
Structural examination performed by light microscopy analysis of PAS-stained kidney sections indicated increased global and segmental glomerulosclerosis in mice expressing either APOL1 risk allele (Fig. 1d). By three weeks after doxycycline induction G1 and G2 transgenic mice developed severe global (solidified-type) and segmental sclerosis compared to G0 control mice (Fig. 1e). Ultrastructural analysis using transmission electron microscopy (EM) showed increased foot process effacement, which is an important ultrastructural characteristic of proteinuric glomerulopathies in patients, in mice expressing a risk allele compared to those expressing the reference allele (Fig. 1f).
Next we performed molecular analysis of the NPHS1-rtTA/TRE-APOL1 mouse model by performing RNA-seq of whole kidneys from control, reference and risk allele mice (Supplementary Fig. 2b). This unbiased analysis identified many differentially expressed genes (Supplementary Table 1). We used gene set enrichment analysis to identify key pathways driving these transcriptional changes (Fig. 1g). The top differentially expressed pathways include JAK-STAT signaling, cytokine-cytokine receptor interaction and phagosome related genes indicated a potential connection between APOL1-associated kidney disease and immunity19 (Fig. 1g, Supplementary Fig. 2c and Supplementary Table 2). We have also examined the expression of five genes reported to be differentially expressed when patients with nephrotic syndrome with low- and high-risk APOL1 allele status were compared20. Except for one human-specific gene (SNORA14), all four genes that are present in mice showed increased expression in the mouse model (Fig. 1h) and statistical correlation with glomerulosclerosis (Supplementary Table 3).
G1 and G2 phenotypes are cell type-and dose-dependent
To show that the renal phenotype development after induced expression of G1 or G2 is not due to non-specific toxicity, we generated mice with tubule-specific expression of APOL1 by crossing the TRE-APOL1 transgenic mice with Pax8-rtTA mice. We confirmed transgene expression in the Pax8-rtTA/TRE-APOL1-G0 and Pax8-rtTA/TRE-APOL1-G1 mice by immunostaining (Supplementary Fig. 3a) and Western blotting (Supplementary Fig. 3b). Further, we performed structural analysis by PAS staining of mouse kidney sections and found no observable alterations in mice expressing risk allele APOL1 (Supplementary Fig. 3a). Serum creatinine, BUN, and urinary ACR measurements indicated no functional alterations in tubule-specific transgenic mice (Supplementary Fig. 3c). Furthermore transcript level analysis for kidney injury markers Kim1 and Col4a (by qRT-PCR) showed no significant differences among control mice and those expressing the G0, G1 or G2 alleles (Supplementary Fig. 3d).
To further show that disease development in podocytes specifically depends on the presence of the risk variants, we identified mice with equal expression of G0, G1 and G2 APOL1 in podocytes and examined their phenotype (Fig. 2a,b). In mice with equal expression of G0, G1 or G2, those with G1 and G2 variants had significantly higher albuminuria, indicated by the higher ACR level, compared to those with the G0 reference allele (P = 0.0029 and 0.0061, respectively) (Fig. 2b). Similarly, in vitro studies show that G1 and G2 APOL1 variants expressed in transfected HEK293 cells at the same level as G0 variant were associated with increased cytotoxicity compared to G0-APOL1 transfected cells (Fig. 2c). These findings are recapitulated in human samples (Supplementary Table 4). When glomerular expression of APOL1 was matched in low- and high-genetic risk samples, high-risk samples had significantly lower eGFR (P = 0.032) (Fig. 2d). In summary, the phenotype in mice and human subjects as well as the cytotoxicity in vitro is closely linked to the risk variants supporting the notion that disease development is not a result of broad cytotoxicity.
Figure 2. APOL1 risk variant-induced phenotype is cell type- and dose-dependent and likely reversible.
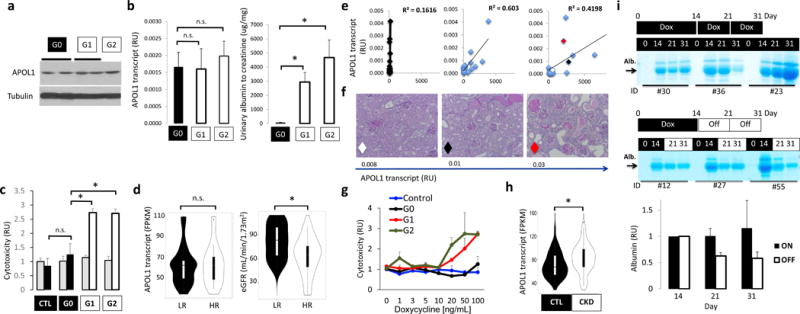
(a) Western blot showing APOL1 and tubulin levels in kidneys of NPHS1-rtTA/TRE-APOL1 transgenic mice on doxycycline for 3 (G1 and G2) to 17 (G0) weeks. (b) Left panel: Mice were matched for APOL1 transcript levels in NPHS1-rtTA/TRE-APOL1-G0/G1/G2 transgenic mice Right panel: urine albumin/creatinine ratio (ACR) of NPHS1-rtTA/TRE-APOL1-G0/G1/G2 transgenic mice after doxycycline diet for 3–6 weeks. (n = 5 per group). Data are presented as means ± s.e.m. and Student’s t-test, P = 0.0029 (G0 vs. G1), P = 0.00612 (G0 vs. G2). (c) Cell toxicity (measured by the ratio of dead to viable cells) assay in TRE-GFP/APOL1-G0, G1 or G2 transiently transfected HEK293 cells and normalized to GFP (APOL1) levels. Grey bars represent no doxycycline treated and black (in CTL or G0) or white bars (in G1 or G2) represent doxycycline treated cells. Student’s t-test, P = 0.0031 (G0 vs. G1), P = 0.016 (G0 vs. G2). (d) Violin plots of eGFR (right graph) in a group of low risk (LR) and high-risk (HR) APOL1 genotype patients matched by APOL1 expression level (left graph) (FPKM: fragments per kilobase million) and age, gender and other sequencing parameters (1:3=HR (n = 11): LR (n = 33)). Significance was calculated by conditional logistic regression P = 0.032 (right graph). (e) Correlation between APOL1 transcript levels (by qRT-PCR) and albumin/creatinine ratio for NPHS1-rtTA/TRE-APOL1-G0, G1 or G2 mice. n = 15 per group. The red, white and black diamonds in the graph for the G2 allele represent 3 mice of varying expression of this risk allele and used for analysis in f. (f) Representative PAS-stained kidney images of NPHS1-rtTA/TRE-APOL1-G2 with increasing levels of APOL1 transcript. The diamonds represent the same 3 mice shown in e for the G2 group. (n > 5 per line) (g) APOL1 cell toxicity in TRE-GFP/APOL1-G0, G1 or G2 transiently transfected HEK293 cells treated with different concentrations of doxycycline (increasing APOL1 expression), cell toxicity was normalized to GFP (APOL1) expression. (h) Violin plots of glomerular APOL1 transcript level measured by RNA sequencing on microdissected glomeruli from 286 human kidney samples in control (GFR> 60mL/min/1.73m2) and CKD (GFR<60ml/min/1.73m2) patients. Student’s t-test, P = 0.000283. (i) Coomassie gels of urine samples from mice that were placed on doxycycline food for 14 days and then either kept on doxycycline food (on group) or taken doxycycline diet off (off group). Urine samples were taken from day 0, 14, 21 and 31 following initiation of doxycycline food. Quantifications of albumin gel images are shown at the bottom. Intensity of the albumin of Day 21 and 31 were both normalized to that of day 14 (the time of splitting up the groups). All data are presented as means ± s.d. (unless otherwise indicated).
As APOL1 genetic variants represent a complex trait, not all human subjects and not all mice develop severe kidney disease. To understand the variation in disease severity, first we correlated APOL1 transcript levels with kidney functional changes. We found a strong linear correlation between APOL1 transcript levels and albuminuria in mice with G1 and G2 podocyte-specific expression, whereas no matter the expression level of the G0 allele we did not observe albuminuria (Fig. 2e). Similarly to albuminuria, histological damage was more severe in mice expressing higher levels of risk allele APOL1 compared to mice expressing the same risk allele at a lower level (Fig. 2f). Further, we inducibly expressed either a control vector, or one expressing either G0, G1 or G2 in transfected HEK293 cells using the doxycycline expression system we used in vivo. We found under escalating doses of doxycycline only expression of G1 or G2 at the highest doses resulted in greater cytotoxicity compared to cells expressing the G0 reference allele or a control vector, suggesting that G1 and G2 toxicity is dose dependent (Fig. 2g).
To understand whether the renal disease phenotype in patients also depends on APOL1 levels, we compared APOL1 transcript levels in glomeruli isolated from 286 human kidney samples. Patient characteristics are shown in Supplementary Table 4. We found that APOL1 transcript level (regardless of genotype) is significantly higher in glomeruli isolated from CKD kidneys (GFR < 60) compared to controls (GFR>60) (P = 0.000283) (Fig. 2h). This was true even when diabetic samples were excluded (Supplementary Fig. 4a). Furthermore we have also examined the correlation between glomerular APOL1 levels and GFR in low- and high-risk samples. APOL1 levels are higher in lower GFR samples both in low- and high-risk samples (Supplementary Fig. 4b). This relationship is much stronger in high-risk samples (Fig. 2d) when compared to low risk samples, just as we observed in our mouse model (Fig. 2e).
Our studies also indicated that interferon is a strong regulator of APOL1 levels both in low-and high-risk human podocytes (Supplementary Fig. 4c). We detected a strong statistically significant correlation between STAT1 and APOL1 transcript levels in human glomeruli (P < 2.2e-16) (Supplementary Fig. 4d) and found that STAT1 binds to APOL1 enhancers (Supplementary Fig. 4e).
Given the strong correlation between APOL1 levels and phenotype development we also examined whether turning APOL1 expression off in our mouse model would lessen disease severity. We placed mice on doxycycline-containing food for 14 days and either kept the mice on doxycycline or took them off the diet for 7 (at day 21) or 17 (at day 31) days. The decrease we observed in albuminuria by Coomassie-stained gels of urine samples when doxycycline treatment was halted indicates that albuminuria development strongly correlates with the expression of risk allele APOL1 in podocytes (Fig 2i).
A role of APOL1 in autophagic flux
Next, we examined the molecular mechanism of APOL1 variant-induced kidney disease. Immunogold electron micrographs of human kidney tissue samples showed that APOL1 localized to the plasma membrane and associated intracellular vesicles in podocytes (Fig. 3a). We used intracellular compartment-specific markers to determine APOL1 localization in cultured human podocytes. We found co-localization of APOL1 with early endosomal marker EEA1 and late endosomal marker Rab7 (Fig. 3b,c). There was minimal colocalization with the recycling endosomal marker Rab11, the autophagic vacuole marker LC3, the lysosomal marker LAMP2 (Fig. 3b,c), the Golgi marker GM130, the ER marker calnexin or the lipid droplet marker perilipin2 (Supplementary Fig. 5). Examination of GFP-APOL1 and RFP-Rab7 localization in transfected HEK293 cells further confirmed that APOL1 resides in the late endosomal compartment (Fig. 3d and Supplementary Video 1).
Figure 3. APOL1 risk allele cells show increased accumulation of intracellular vesicles, mainly late endosomes/autophagosomes.
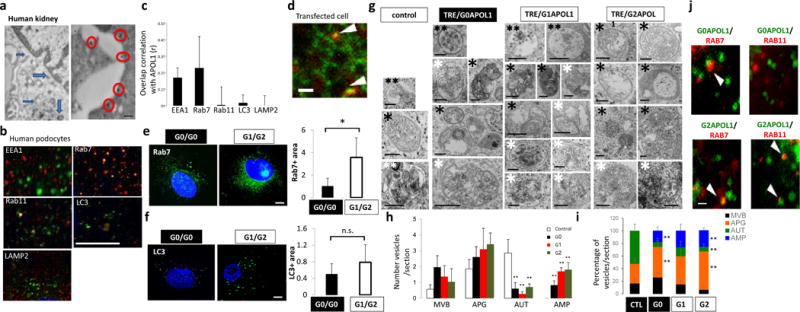
(a) Immunogold electron microscopy (EM) of APOL1 in human kidney podocytes. APOL1 localizes to plasma membrane (red circles) and intracellular vesicles (blue arrows). Scale bar, 200nm. (b) Double immunofluorescence micrographs of cultured human podocytes with APOL1 (red) and intracellular organelle markers (green) (EEA1-early endosome, Rab7-late endosome, Rab11-recycle endosome, LC3-autophagic vacuoles, LAMP2-lysosomes). Scar bar, 11μm. (c) Quantification of colocalization correlation using Pearson r correlation through ImageJ coloc2 function. n = 5 separate experiments, 3–10 cells for each genotype were analyzed. Data are presented as means ± s.e.m. (d) Representative frame from the supplementary video 1 of spinning disk confocal microscopy analysis of GFP-APOL1 (green) and RFP-Rab7 (late endosome) (red) in transfected HEK293 cells. Arrowheads, overlapping puncta of GFP-APOL1 and RFP-Rab7. Scale bar, 5μm. (e–f) Representative fluorescence images of confocal microscopy analysis of endogenous. (e) Rab7 and (f) LC3 immunofluorescence stain in cultured low risk genotype (G0/G0) and high risk genotype (G1/G2) human podocytes and quantification showing increased stain in G1/G2 cells. n = 5 separate experiments, 3–10 cells for each genotype were analyzed. Scale bars, 11μm. (g) Representative transmission electron micrographs from control, TRE-APOL1-G0, TRE-APOL1-G1 and TRE-APOL1-G2 transfected HEK293 cells. Examples of autophagy-related compartments include: **(two black asterisks): Late endosomes/MVB (MVB), *(one black asterisk): autophagosomes (APG), ** (two white asterisks): autolysosomes (AUT), * (one white asterisk): amphisomes (AMP). Scale bars, 0.5μm. (h) Quantification showing the number of each type of vesicle per section. n = 7 analyzed sections. Data are presented as means ± s.e.m. and Student’s t-test, P = 0.032, 0.0057, 0.011 for G0, G1, G2 comparing to control (AUT); while P = 0.024,0.00027, 0.00903 for G0, G1, G2 comparing control (AMP). (i) Quantification showing the relative percentage of each compartment. n = 7 analyzed sections. Data are presented as means ± s.e.m. and Student’s t-test, P = 0.0064 (G2 vs. CTL, APG), 0.0068 and 0.0.01005 (G0 and G2, respectively, vs. CTL, AUT), 0.034 and 0.00044 (G0 and G2, respectively, vs. CTL, AMP). (j) Representative frames from the supplementary videos 1 and 2 of spinning disk confocal microscopy analysis of GFP-APOL1-G0 or GFP-APOL1-G2 (green) and RFP-Rab7 or RFP-Rab11 (red) in transfected HEK293 cells. Scale bar, 5 μm. All data are presented as means ± s.d. (unless otherwise indicated).
We noted that expression of APOL1 in HEK293 cells using the TRE-APOL1 constructs (Supplementary Fig. 1) resulted in excessive accumulation of intracellular vesicles, which was more evident in the G1 and G2 variant cells compared to G0 controls (Supplementary Fig. 6a). Immunofluorescence studies in human podocytes from low risk (G0/G0) and high-risk allele subjects (G1/G2) indicated an increase in Rab7 (late endosome) (Fig. 3e) and LC3II (autophagosomes) (Fig. 3f) -positive intracellular organelles in the high-risk allele podocytes compared to low-risk allele podocytes. Similarly, there was an increase in total Rab7, Rab11 and steady state LC3II protein levels in APOL1 risk allele transfected HEK293 cells compared to reference allele transfected cells (Supplementary Fig. 6b,c). Transmission EM of APOL1 risk allele transfected cells indicated accumulation of different types of vesicles, including multivesicular bodies (MVB; also called late endosomes) and autophagic compartments compared to reference allele transfected cells (Fig. 3g–i). Analysis of the morphometric characteristics of the autophagic vacuoles revealed a significantly higher abundance of autophagosomes (APG or AP; double membrane vesicles with content of similar characteristics to the surrounding cytosol) and a decrease in autolysosome fraction (AUT or AL; single membrane vacuoles with cargo in an advanced stage of degradation) in high risk allele-transfected cells compared to that in G0 or control cells (Fig. 3h,i). In addition, we noticed an expansion of vesicular compartments compatible with amphisomes (AMP; resulting from the fusion of autophagosomes and MVB; and containing cytosolic material as well as multiple small vesicles); the size and frequency of this was even more abundant in cells transfected with APOL1 risk alleles compared to reference allele transfected cells (Fig. 3i). Immunofluorescence and confocal spinning disk microscopy showed increased colocalization of APOL1 risk variants with late (Rab7 positive) and recycling (Rab11 positive) endocytic compartments in transfected HEK293 cells (Fig. 3j, Supplementary Fig. 6d,e and Supplementary Video 2a,b).
To further characterize the APOL1-induced intracellular vesicle defect, we next examined autophagy, as there is a very dynamic interplay between autophagic and endocytic compartments under physiologic conditions. Furthermore, previous studies have proposed that APOL1 plays a role in autophagy21. First, we quantified the extent of autophagic vacuoles in reference and risk allele transfected HEK293 cells estimated by conjugated LC3 (LC3II) (Fig. 4a). In agreement with the immunofluorescence and EM data, we found that at baseline there was a greater amount of LC3II in cells expressing a risk allele compared to cells expressing reference allele (Fig. 4a).
Figure 4. Risk variants of APOL1 obstruct autophagy flux.
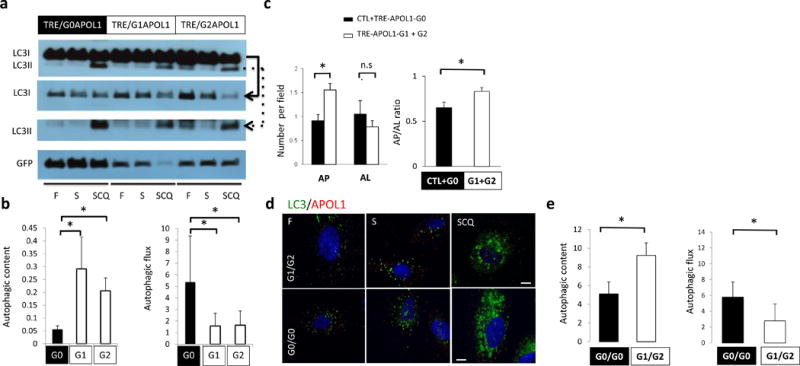
(a) Representative Western blot analysis and (b) quantification of LC3 and GFP in TRE-APOL1 transfected HEK293 cells under fed (F), starved (S) and starved+chloroquine treatment (SCQ) conditions. Top panel shows LC3I and LC3II bands on the same gel. Due to high LC3I content in the cells, different exposure times of the individual rows of LCI and LCII (see solid and dashed arrowed lines, respectively, pointing to the lower panels) were utilized for clear and quantifiable visibility of the bands. Data are presented as means ± s.e.m. and Student’s t-test compared to TRE-APOL1-G0 transfected cells. (c) Quantification of autophagosomes (AP) and autophagolysosomes (AL) by transmission EM and their ratio in transfected HEK293 cells. n = 35, 32, 54 and 42 cells for control, G0, G1 and G2 transfected cells were analyzed, respectively. All data are presented as means ± s.e.m. and Student’s t-test, P = 0.0013 (left panel), 0.025 (right panel) compare to non-transfected (CTL) + TRE-APOL1-G0 transfected cells. (d,e) LC3 staining of low risk (G0/G0) and high-risk (compound heterozygous G1/G2) genotype human podocytes under fed (F), starved (S) and starved plus chloroquine (SCQ) conditions (d) and quantification of this data (e). Scale bars, 11μm. n = 3, 9–20 cells were analyzed per condition. Data are presented as means ± s.e.m. and Student’s t-test, P = 0.0462 (left panel), 0.0104 (right panel) compared to low risk genotype (G0/G0) podocytes.
Increased LC3II can result from either increased autophagosome biogenesis or a blockage of autophagosome clearance. In order to distinguish between these possibilities, we examined autophagic vacuole content (amount of autophagic vesicles, represented by LC3II level in baseline conditions) and autophagic flux (lysosomal fusion and degradation of autophagic cargo, represented by the degree of increase in LC3II after pharmacological blockage of lysosomal degradation) (Fig. 4b). We speculated that the greater LC3II content associated with risk allele (G1 or G2) expression was likely a consequence of lower autophagic flux (and degradation of LC3II). We calculated the autophagic flux by blocking the lysosomal degradation of LC3 and demonstrated a lower degree of autophagic flux in risk allele-transfected HEK293 cells (compared to G0 allele expressing cells) (Fig. 4b). Analysis of transmission EM studies further confirmed that risk allele-transfected cells contained a greater amount of autophagic vacuoles (AP) but fewer autolysosomes (AL) compared to reference allele transfected cells indicating a blockage in autophagic flux (Fig. 3g and Fig. 4c).
To examine the relevance of these findings to the human condition we analyzed low-risk (G0/G0) and high-risk (G1/G2) human podocytes. These cells presented with a similar defect in autophagy; G1/G2 cells showed greater numbers of autophagic vacuoles at baseline, but defects in autophagic flux compared to G0/G0 cells (Fig. 4d,e).
APOL1 regulates the acidification of endocytic vesicles
Next we further analyzed the nature of the autophagic flux defect. A lysosomal defect would manifest as a defect in autolysosome formation (or reduced autophagic flux) therefore we first analyzed lysosomes in control- and risk allele-expressing cells. LysoTracker analysis of reference and risk allele-transfected HEK293 cells did not show significant differences in lysosomal content or acidification (Supplementary Fig. 7a). Identical results were seen in human podocytes harboring low- or high-risk alleles (Supplementary Fig. 7b), ruling out a gross defect in lysosomal function.
The most likely explanation to synthesize these results is that APOL1 risk alleles interfere with lysosomal fusion with autophagosomes. We examined the colocalization of the lysosomal SNARE protein VAMP822 with two autophagosome markers Stx17 (Supplementary Fig. 7c,d) and LC3II (Supplementary Fig. 7e,f). We found a decrease in colocalization between VAMP8 and both Stx17 and LC3II in APOL1-G1 and G2 risk allele transfected HeLa cells. These studies further support a defect in autophagosome maturation.
Many cells respond to reduced fusion of autophagosomes with the lysosome by increasing the fusion of autophagosomes directly with the endosome (resulting in amphisomes). To further characterize the endocytic compartment in APOL1 transfected cells, we analyzed the uptake of fluorescently labeled 10 kDa dextran in transfected HEK293 cells. In agreement with the EM data, cells expressing APOL1 risk alleles displayed a significant increase in the amount of endocytic vesicles compared to cells expressing the G0 reference allele (Supplementary Fig. 7g,h). We also examined endosomal pH using a 10 kDa dextran labeled with a pH sensitive dye (pHrodo). This dye reaches acidic compartments by endocytosis, in contrast to LysoTracker, that freely permeates membranes to reach cellular acid compartments (Supplementary Fig. 7g). We found that the acidification of the endosomes was defective in risk allele transfected HeLa cells (Supplementary Fig. 7i), as the ratio of fluorescence between pHrodo and labeled dextran was lower in APOL1 risk allele cells compared to G0 transfected HeLa cells. These studies indicate that in the presence of APOL1 risk alleles there is a defect in autophagosome maturation, likely resulting from diminished lysosomal fusion and impaired acidification of the late endocytic compartment, thus most likely resulting in a defect in autophagy flux. This defect in autophagy raises the possibility that APOL1 risk variant was not degraded and therefore accumulates in cells. However, our experiments indicated that this was not the case as APOL1 expression was generally slightly lower in risk allele cells when compared to reference allele transfected HEK293 cells (Supplementary Fig. 7j).
APOL1 variants result in inflammatory cell death (pyroptosis)
Podocyte loss due to cell death plays a critical role in the development of FSGS23,24; a common histological manifestation of APOL1-associated kidney disease. Upon examining the mechanism of APOL1-induced cytotoxicity, we failed to observe any increase in apoptosis in APOL1 risk allele-transfected cells (Fig. 5a). We therefore turned our attention to inflammatory cell death mechanisms as it has been shown that defect in non-inflammatory cell death can shift towards inflammatory cell death pathways including pyroptosis25,26. We found that cleaved caspase1, the key player in pyroptosis, was increased in APOL1 transfected cells. This was particularly pronounced in cells expressing the APOL1 risk alleles (Fig. 5b). In pyroptosis active caspase1 cleaves interleukin 1β (IL1β) into a mature and active protein that eventually leaks out of the cell. We found that the level of mature IL1β was increased in the medium of cells expressing APOL1 risk allele compared to reference allele transfected cells (Fig. 5b).
Figure 5. APOL1 risk variants induce inflammatory cell death (pyroptosis) in cells.
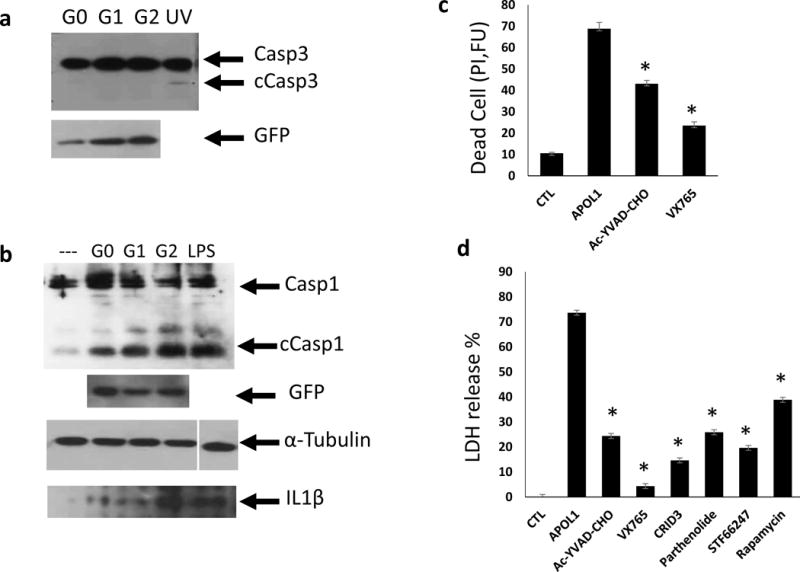
(a) Representative Western blot analysis of caspase3 (Casp3) and cleaved caspase3 (cCasp3) following transient transfection with TRE-APOL1-G0/G1/G2. UV exposure served as apoptosis positive control. n = 5. (b) Representative Western blot analysis of caspase1 (Casp1) and cleaved caspase1 (cCasp1) following transient transfection of TRE-APOL1-G0/G1/G2. GFP served as an APOL1 expression reference, α-tubulin as loading control and LPS as pyroptosis positive control. Western blot analysis of mature IL1β in medium from the same transfected HeLa cells. (c) Cell toxicity (measured by propidium iodide staining) in stably transfected TRE-GFP/APOL1-G1 HEK293 cells, with (APOL1) or without (CTL) doxycycline and in the presence of the indicated caspase1 inhibitors (concentration see Methods). Experiments were done in triplicates. Data are presented as means ± s.e.m, and Student’s t-test, P = 0.0015 (Ac-YVAD-CHO), 0.00018 (VX765) compared to APOL1. (d) Cell toxicity (measured by LDH release to the medium) in stably transfected TRE-GFP/APOL1-G1 HEK293 cells with (APOL1) or without (CTL) doxycycline and with indicated inhibitors (concentration see Methods). A representative experiment out of three is presented; each experiment was done in triplicates. All data are presented as means ± s.e.m, and Student’s t-test, P < 0.05.
To prove that pyroptosis contributes to APOL1 risk allele-induced toxicity we treated cells with caspase1-specific inhibitors Ac-YVAD-CHO and VX765 and found that APOL1 risk allele-induced cytotoxicity was significantly reduced (Fig. 5c). NLRP3 is a component of the inflammasome that activates caspase1 during pyroptosis. CRID3 and Parthenolide, as NLRP3 inhibitors, also reduced APOL1 risk allele-induced cytotoxicity (Fig. 5d). In line with our hypothesis that defective autophagy is the critical inducer of pyroptosis, we found that autophagy inducers rapamycin (an mTOR inhibitor)27 and STF66247 decreased the APOL1-induced cytotoxicity (Fig. 5d).
Risk alleles increase inflammatory cell death in mice
As our in vitro data suggested an inflammatory cell death in risk allele-expressing cells, we examined whether such a mechanism contributes to podocyte pathology in risk allele-expressing transgenic mice. We found a marked reduction in podocyte number in risk allele transgenic mice (Fig. 6a,b) and severe podocyte dedifferentiation indicated by decreased staining of nephrin in risk allele mice (Fig. 6a). DNA fragmentation, evident by TUNEL staining was increased in APOL1 risk allele mice (Fig. 6a, b), indicating severe podocyte injury and death.
Figure 6. Mice with podocyte specific APOL1 risk allele expression show increased podocyte loss, autophagy block and increased inflammatory cell death.
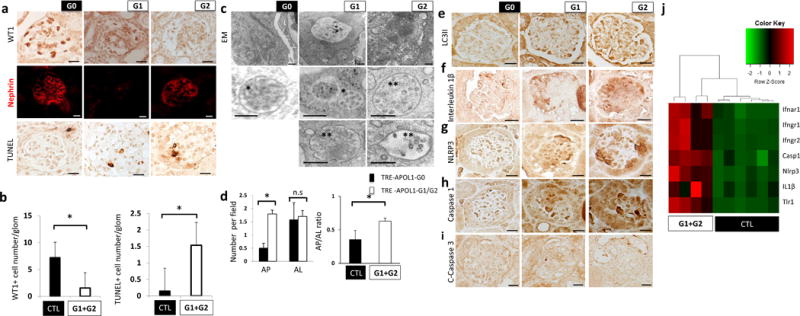
(a) Representative immunohistochemistry images of WT1 (upper), nephrin (middle) and TUNEL staining (lower) in NPHS1-rtTA/TRE-APOL1-G0/G1/G2 mouse kidney sections. (n > 5 per line) Scale bars, 10μm. (b) Left panel: Quantification of stained cells per glomerulus of WT1 (a podocyte marker), in transgenic mice. n = 11 analyzed images per condition. Student’s t-test, P =0.0036 compared to NPHS1-rtTA/TRE-APOL1-G0 mice and single transgenic control mice. Right panel: Quantification of stained cells per glomerulus of TUNEL stain from transgenic mice. n = 12 analyzed images per condition. Student’s t-test, P = 0.0011 compared to NPHS1-rtTA/TRE-APOL1-G0 mice and single transgenic control. (c) Representative transmission EM images of podocytes from transgenic mice showing increased numbers of MVB and autophagosomes. Inserts show multivesicular bodies (*) and amphisome-like structures (**). Scale bars, 500nm. (d) Quantification of autophagosomes (AP) and autolysosomes (AL) in transgenic mice. Note increased ratio of AP to AL in G1 and G2 mice compared to G0 mice. n > 50 analyzed organelles per each condition. Data are presented as means ± s.e.m. and Student’s t-test, P = 8.1816e-07 (left panel), 0.037 (right panel) compared to NPHS1-rtTA/TRE-APOL1-G0 mice. (e) Representative immunohistochemistry images of LC3II from transgenic mice. Note the increased podocyte stain in G1 and G2 mice compared to G0 mice, suggesting increase in autophagic vacuole content. (n > 5 per line) Scale bars, 10μm. (f–h) Representative immunohistochemistry images of IL1β, NLRP3 and caspase1, showing increased stain of pyroptosis proteins in podocytes of G1 and G2 mice, compared to G0 mice. (n > 5 per line) Scale bars, 10 μm. (j) Representative immunohistochemistry images of cleaved caspase3 from transgenic mice. Note lack of detectable stain, indicating apoptosis is not significantly induced in transgenic mice. (n > 5 per line) Scale bars, 10 μm. (i) Differential expression of a set of genes by RNA-seq analysis in kidneys of NPHS1-rtTA/TRE-APOL1-G0/G1/G2 mice. Single transgenic littermates and NPHS1-rtTA/TRE-APOL1-G0 are controls.
Next we examined whether an autophagy defect similar to the one we observed in vitro, can be detected in vivo in mice expressing either the APOL1 reference or one of the risk alleles. Transmission EM indicated a greater number of multivesicular bodies/amphisomes and autophagosomes in risk allele mice compared to G0 mice (Fig. 6c). The autophagosome (AP) to autolysosome (AL) ratio was greater in mice expressing APOL1 risk allele in podocytes compared to G0 mice (Fig. 6d). Similarly to our in vitro finding, LC3II staining was greater in APOL1 risk allele mice compared to G0 mice (Fig. 6e).
To further analyze the cell death mechanism in vivo, we focused on pyroptosis. We detected signs of greater inflammatory death in mice with podocyte-specific deletion of Atg7 (NPHS2creAtg7flox/flox), the gatekeeper of autophagy as IL1β and NLRP3 expression was greater in Atg7-deleted mice podocytes compared to single transgenic controls (Supplementary Fig. 8), pointing towards a link between decreased autophagy and increased pyroptosis in vivo. In mice with podocyte-specific expression of APOL1, immunostaining for IL1β, NLRP3 and caspase1 showed greater protein expression in kidney sections of risk allele transgenic mice compared to those expressing the reference allele (Fig. 6f–h), while we did not detect active caspase3 activity in risk allele mice (Fig. 6i). RNA-seq-based unbiased analysis indicated that caspase1, IL1β and NLRP3 were greater in expression when risk allele mice were compared to reference allele and control mice (Fig. 6i).
Discussion
G1 and G2 APOL1 variants have been strongly and reproducibly associated with kidney disease in patients. With the advent of whole genome and whole exome sequencing hundreds of disease-associated variants have been identified, but animal model experiments represent the mainstay of distinguishing causality from association in human genetics. Here we generated a mouse model with podocyte-specific inducible expression of APOL1 reference and risk variants. We show that risk variants recapitulate critical features of the human condition indicating that these variants are not only disease associated but indeed disease causing. Functional changes, such as albuminuria and azotemia present in the risk allele-expressing transgenic mice are consistently observed in patients. Structural changes in the mouse model include foot process effacement and mostly solidified-type global sclerosis with some segmental sclerosis and tubulointerstitial fibrosis. While further human studies are needed, recent observations indicated that increased solidified-type global sclerosis and more severe tubulointerstitial fibrosis distinguishes subjects with high-risk APOL1 variants from subjects with low-risk genotypes13,14. Our mouse model studies here indicate that this lesion could represent an APOL1-specific phenotype that is superimposed on other CKD etiologies, such as hypertension, HIV or lupus (thus contributing to the seemingly variable phenotype of APOL1 kidney disease in humans). Moreover, APOL1 risk variant could act as a disease accelerating mechanism by inducing global glomerulosclerosis. The phenotype development in the mouse model not only closely resembled the human condition, but we found it was cell type and genotype restricted, indicating specific rather than non-specific toxicity.
Our results also strongly indicate that phenotype development not only depends on the presence of G1 and G2 risk variants, but also on risk variant expression levels. The correlation between APOL1 G1 or G2 levels and disease severity was also observed in human glomerular samples obtained from a large and diverse patient population. It is also in line with publications indicating that interferon (IFN) injection can lead to disease development in high-risk subjects28. Interferon seems to be a strong regulator of APOL1 expression and in human subjects STAT1 shows a remarkable correlation with APOL1 levels. We found that interferon increases cytotoxicity in high risk cells but its effect is not additive to the transgenic overexpression of APOL1. We therefore suggest that the level of APOL1-G1 and G2 represents a “second hit”; once risk variant APOL1 level rises above a critical threshold, disease develops (Supplementary Fig. 9). Besides the regular gene expression cues, environmental triggers, such as interferon treatment or infection, increase APOL1 risk allele expression in kidney podocytes, which subsequently blocks autophagy and activates caspase1-mediated inflammatory cell death (pyroptosis), resulting in disease progression. The recessive mode of inheritance is also in line with the “threshold” hypothesis, as heterozygous subjects have an average of 50% risk variant levels that is less likely to reach a critical threshold in geographical areas where the “environmental trigger” is less strong. A recent publication indicates that in Sub-Saharan Africa, where both APOL1 risk variants and HIV incidence is much higher, even heterozygous individuals have a statistically significant increased disease risk29.
Recently a mouse model with podocyte-specific non-inducible expression of either G0 or G2-APOL1 was published10. The authors have described pre-eclampsia but no glomerulosclerosis in this model, which seems to be different from the human phenotype. In this model APOL1 expression was significantly lower in risk allele mice. Given our results in this study that the kidney phenotype is strongly associated with APOL1 levels, this lower expression level might have played a role in the lack of observed renal disease. APOL1 expression in this model is constitutive, potentially causing a selective pressure and decreasing toxicity. Speaking to this issue in the pre-eclampsia model, the authors have obtained significantly fewer founders for the risk allele than for the reference allele mice. The conditional inducible expression system we used here likely circumvented such problems.
On the mechanistic level, APOL1 interferes with intracellular vesicle trafficking by disrupting autophagosome maturation, leading instead to expansion of mixed endocytic/autophagic compartments. The molecular mechanism whereby APOL1 affects autophagy and vesicular trafficking is not fully understood. We have found that acidification of endocytic vesicles was altered in cells expressing one of the risk alleles. Although dissipation of acidic endosomal pH could be secondary to rerouting of autophagosomes towards fusion with endosomes instead of lysosomes, the most likely explanation for this defect is that APOL1 acts as an ion channel in vesicles. Acidification of vesicles occurs by the action of a vacuolar ATPase, an electrogenic process; therefore an ion channel is needed to compensate the electric changes. APOL1 has been shown to function as an ion channel in lipid bilayers30, and therefore it is possible that it also functions as such in podocytes. Other possible mechanisms include a potential interaction of APOL1 with a GTPase or a SNARE protein, which would interfere with autophagosome maturation and lysosomal fusion. Future studies are needed to distinguish between these or other possibilities.
We show that the effect of APOL1 on endocytic/autophagic maturation results in lower autophagic flux in cells expressing one of the APOL1 risk alleles. It has been suggested that autophagy is induced by APOL1, as it has a BH3 domain, and BH3-only proteins and BH3 mimetics induce autophagy through beclin-1 and the class III phosphorinositide3-kinase complex21,31. Also, both reference and risk alleles of APOL1 increase LC3II levels, yet autophagic flux was not specifically investigated in these studies32–34. Although induction of autophagosome formation could be in part responsible for the higher number of autophagosomes observed in cells expressing a APOL1 risk allele, our studies support the conclusion that most of the increase in steady state levels of autophagosomes is due to reduced autophagic flux (lysosomal fusion and degradation of autophagic cargo). Podocytes, like other terminally differentiated cells, such as neurons, have high basal autophagy rates and autophagy is known to play an important role in podocyte homeostasis35. Indeed, defects in autophagy in podocytes have been shown to induce podocyte loss, focal segmental glomerulosclerosis and proteinuria36–39.
Our results indicate that this defect in autophagy and endocytic trafficking is associated with inflammatory cell death. Caspase1 and IL1β play a key role in APOL1-induced cytotoxicity. These results offer new therapeutic possibilities for APOL1-associated kidney disease with already approved IL-1 inhibitors or other inflammatory cell death inhibitors40,41. Given that caspase1 knockout animals develop normally42, this pathway is potentially targetable.
Importantly, it seems that a positive feedback regulatory loop exists between APOL1 and inflammatory pathways. While APOL1 is part of the innate immune system and is strongly regulated by inflammatory cytokines; its expression results in inflammatory cell death21. Cytokines released following cell death can up-regulate APOL1 levels leading to further death. This regulatory loop likely explains the toxicity associated with APOL1 expression in vitro and in vivo. It may also explain the additive effect of HIV and APOL1 risk allele on glomerulosclerosis development, in light of the cytokine inducing effect of HIV and the potential additive activation of pyroptosis by the virus43,44.
In summary we show that expression of either APOL1 risk allele in podocytes causes lesions that recapitulate the human APOL1-associated kidney disease at the functional, structural and molecular levels, thus proving that these variants are disease-causing mutations. Targeting these variants may reduce the increased kidney disease risk among millions of people of African descent.
Online Methods
Antibodies and reagents
The following primary antibodies were used: GFP (immunohistochemistry (IHC), Clontech #632380, 1:500; western blot (WB), 1:3000), WT1 (IHC, Santa Cruz #M3561, 1:40), EEA1 (immunofluorescence (IF), BD transduction #610456, 1:100), Vamp8 (IF, Sigma #SAB1409943, 1:100), Rab7 (IF, Sigma #R8779, 1:100), Rab11 (IF, BD transduction #610656 1:100), LAMP2 (IF, BD transduction #555803, 1:100), LC3II (WB, Sigma #L7543, 1:1000; IF, cell signaling #27755, 1:100), STX17 (IF, Sigma #HPA001204, 1:100), APOL1 (WB, Sigma #HPA018885, 1:1000; IF, Sigma, 1:100), GM130 (IF, BD transduction #610822, 1:100), calnexin (IF, BD transduction #610523, 1:200), perilipin2 (IF, Sigma #611042, 1:500), Nephrin (IF, Fitzgerald Industries Intl Inc #20R-NP002, 1:100), cleaved-Caspase-3 (WB and IHC, cell signaling #9664, 1:1000), Caspase-1 (WB, Santa Cruz #SC515, 1:1000; IHC, Thermo Fisher #PA5-38099, 1:100), IL1β (WB, R&D #AF-201-NA, 1:1000; IHC, cell signaling #12242S, 1:100), NLRP3 (IHC, Novus #NBP2-12446, 1:100), α-tubulin (WB, Sigma #T6199, 1:3000). The following experimental materials were used: RPMI 1640 (Cellgro), MEM eagle (Sigma), DMEM 1× (Cellgro), FBS (Atlanta Biologicals), Tet system approved FBS (Clontech), Penicillin-Streptomycin (Cellgro), insulin transferrin selenium (ITS) (Cellgro), L-glutamine (Cellgro), Doxycycline (Clontech), Digitonin (CalBioChem). The following inhibitors were used: Ac-YVAD728 CHO (Cayman Chemicals, 50μM), VX765 (Toronto Research Chemicals, 10μM), CRID3 (Tocris bioscience, 50μM), Parthenolide (ENZO, 100μM), rapamycin (LC laboratories, 1ng/ml), STF62247 (Cayman Chemicals, 1.25μM).
Transgenic mice
TRE-APOL1 mice were generated by cloning APOL1 (G0/G1/G2) cDNA into the pBI734 EGFP vector containing tetracycline response element (TRE). The transgenic construct was injected into FVB/N oocytes. Transgenic mice were identified by genomic PCR analysis using transgene (APOL1 and GFP) specific primers. We detected transgene integration in more than 10 founder lines for each allele. We then characterized 6 founders for G0, 8 for G1 and 4 for G2 by mating them with nephrin and Pax8 rtTA animals. Transgene expression was induced by doxycycline containing food (200mg/kg, BioServ). No blinding or randomization was used during animal handling. NPHS1rtTA transgenic mice were generated by Jeffrey Miner45. The Pax8rtTA mice were purchased from Jackson Laboratories (007176). Animal studies were approved by the Animal Care Committee of the University of Pennsylvania.
Phenotype analysis
Urine albumin and creatinine were determined using mouse albumin specific ELISA (Albuwell M kit, Exocell and Bethyl Laboratories) and creatinine reagent (Sciteck Diagnostics), per manufacturer’s protocol.
For NPHS1-rtTA/TRE-APOL1G2/WT mice, the serum creatinine and BUN were measured by i-STAT CHEM8+ Cartridge according to manufacturer’s instructions (Abbott).
For Pax8-rtTA/TRE-APOL1 transgenic mice, serum creatinine and BUN were determined by Mouse Creatinine Kit (Crystal Chem) and TRACE DMA Urea kit (Thermo Electron Corporation), respectively, according to manufacturers’ instructions.
Histological analysis was performed on formalin fixed paraffin embedded kidney sections stained by PAS (periodic acid Schiff).
Electron microscopy
Tissues for electron microscopic examination were fixed with 2.5% glutaraldehyde, 2.0% paraformaldehyde in 0.1M sodium cacodylate buffer, pH7.4, overnight at 4oC. Samples were post759 fixed in 2.0% osmium tetroxide. The tissue was infiltrated and embedded in EMbed-812 (Electron Microscopy Sciences, Fort Washington, PA). Thin sections were stained with uranyl acetate and lead citrate and examined with a JEOL 1010 electron microscope fitted with a Hamamatsu digital camera and AMT Advantage image capture software. Morphometric analysis of micrographs was performed using conventional criteria46. Scoring of vesicular compartments was performed blinded. For each group 32–54 sections and 100–117 compartments were examined. Type of compartment was determined by the following criteria: autophagosomes were identified as ribosome-free double or partially double membrane vesicles with identified cargo or content of s comparable density to the surrounding cytosol; autolysosomes were identified as single membrane vesicles with content of lower density than the surrounding cytosol and cargo suggestive of breakdown; late endosome/multivesicular bodies were identified as single membrane vesicles containing homogenous single membrane vesicles in their low density lumen; amphisomes were defined using the same criteria of late endosome/multivesicular bodies, only containing cytosolic material of different density in their lumen. The membrane of amphisomes often presented invaginating vesicles representing multivesicular body formation. Immunogold studies were performed on human samples using APOL1 (Sigma #HPA018885) antibody.
Western blotting
Whole kidney was removed from NPHS1-rtTA/TRE-APOL1 or Pax8-rtTA/TRE-APOL1 transgenic mice and subject to western blot analysis. Briefly, kidney lysates were homogenized in 1% SDS lysis buffer (1% SDS, 1% Triton x-100, 50mM Tris pH7.4, 150mM NaCl, 1mM EDTA) containing protease inhibitor cocktail (Complete Mini, Roche). Equal amount of total protein (35ug) were resolved on a 10% gels, transferred to a polyvinylidene difluoride membranes, blocked with 5% non fat milk in TBS-tween and probed with primary antibodies as described above at 4oC overnight, and proper secondary antibodies: anti-rabbit (Cell Signaling, 1:3000) and anti-mouse (Cell Signaling, 1:3000) IgG horseradish peroxidase (HRP) and donkey anti785 goat IgG HRP (Santa Cruz, 1:3000). Blots were detected by enhanced chemiluminescence (Western Lightning-ECL, Thermo Scientific) or Pierce ECL (BioRad).
HeLa Tet-On 3G cells (Clontech), transfected HEK293 cells or GFP-TRE-G1APOL1 HEK293, urinary podocytes were cultured at 37°C in appropriate medium as described above in the presence of 5% CO2. Cell lysates were prepared with 1% SDS lysis buffer as above. Proteins were resolved on a 10–15% gradient gels, and then follow the subsequent western blot procedure as above. in the presence of 5% CO2. Cell lysates were prepared with 1% SDS lysis buffer as above. Proteins were resolved on a 10–15% gradient gels, and then follow the subsequent western blot procedure as above.
Podocyte, HEK293 and HeLa cell culture and transfection
Transformed human podocytes were generated as previously described47. Subjects gave informed consent for genetic studies and for podocyte culture under protocols approved by the NIDDK Institutional Review Board. Human urinary podocytes were cultured in RPMI 1640 supplemented with 10% fetal bovine serum, 1% insulin-transferrin-selenium and 1% penicillin-streptomycin at 33oC. Differentiation was induced when cells were approximately 60–70% confluent by thermoshifting to 37°C for 14d.
HEK293 Tet-On 3G cells (Clontech) were cultured in Eagle MEM with 10% Tet system approved fetal bovine serum (FBS), 10% L-glutamine and 1% penicillin-streptomycin. Cells were transfected with the TRE-GFP/APOL1 construct using Xfect kit (Clontech) per manufacturer’s protocol. On the following day, transfected cells were treated with doxycycline to induce APOL1 expression.
HeLa Tet-On 3G cells (Clontech) were cultured at 37°C in complete DMEM 1× with 10% tet system approved FBS and penicillin-streptomycin. Cells were transfected using Xfect according to manufacturer’s protocol. APOL1 expression was induced by doxycycline. Cells were incubated at 37°C for 24–48h after doxycycline addition before subjected to further analysis.
Stably transfected (GFP-TRE-G1APOL1) HEK293 cells were generated by puromycin selection followed by FACS sorting (GFP) and cylinder cloning. We have confirmed doxycycline inducible APOL1 expression on Western blots.
Cytotoxicity assays
HEK293 3G cells or G1APOL1 were plated in 96-well plate. Transfection of HEK293 cells with APOL1 plasmid was carried out as described above and doxycycline was added for 12hr. The plate was read using SpectraMax for 485ex-535em for GFP signal. Then the medium was carefully removed and cells were incubated with HBSS (with Ca2+ and Mg2+) and 5μM propidium iodide (PI) at 37°C for 30 min. The plate then was read using SpectraMax for 530ex – 620em for dead cells. Without removing HBSS+PI, cells were incubated with equal volume of CellTiter Glo 2.0 reagent (Promega) at room temp for 10 min. Finally, the plate was read using SpectraMax for luminescence, which indicated live cell count. The ratio between dead cell reading, live cell and GFP (APOL1 expression) reading was calculated, unless otherwise indicated.
LDH release test was preformed using CytoTox 96® Non-Radioactive Cytotoxicity Assay (Promega). Transfected Hela cells or GFP-TRE-G1APOL1 HEK293 cells were plated asdescribed above and treated with or without doxycycline and with or without inhibitors for 8–24 h. Medium was collected in triplicates, spun down and incubated in a 96 well plate with the CytoTox reagent for 20–30 min. After addition of stop solution, the absorbance signal was measured at 490nm in a plate reader.
RNAseq; Mouse kidneys
Total RNA of transgenic and control mice kidneys was isolated using RNeasy Mini Kit (Qiagen). RNA quality was assessed with the Agilent Bioanalyzer 2100 and RIN scores above 7 were used. Libraries were prepared using the Illumina TruSeq RNA Preparation Kit. Samples were sequenced using Illumina HiSeq for single-end 100bp. Trimmed reads were aligned to the Gencode mouse genome (GRCm38) with STAR-2.4.1d. The readcount of each sample was obtained using HTSeq-0.6.1 (htseq-count) and then tested with DESeq2 for differential gene expression. Top differentially regulated pathways were determined using GSEA and KEGG pathway analysis software.
RNAseq; Human kidneys
Kidney samples were obtained from routine surgical nephrectomies. Samples were deidentified and clinical information was collected via an honest broker. Pathology examination was performed by local nephropathologist. The study was approved by the institutional review board (IRBs) of the University of Pennsylvania. The kidney tissue was immediately placed and stored in RNAlater (Ambion) according to manufacturer’s instruction. The tissue was manually microdissected under a microscope in RNAlater for glomerular and tubular compartments. Dissected glomerular tissue was homogenized, and RNA prepared using RNAeasy mini columns (Qiagen, Valencia, CA) according to manufacturer’s instructions. RNA quality and quantity were determined as described above. RNA library preparation, sequencing and analysis were performed as described above. Reads were mapped to the reference genomes (Gencode human genome (GRCh37)) using Spliced Transcripts Alignment to a Reference (STAR).
Reversibility study
NPHS1-rtTA/TRE-APOL1-G2 mice were placed on doxycycline diet at 3–9 weeks of age for 14 days. Then the mice were separated into two groups. One was continuing on doxycycline diet and the other one was fed normal chow diet. The urine samples from each mouse were collected twice a week. Urinary albumin levels on day 7 (day 21 total) and day 17 (day 31 total) after separating were monitored by SDS-PAGE and Coomassie stain.
Immunohistochemistry, immunofluorescence and TUNEL
For Immunohistochemistry, sections were deparaffinized, hydrated in ethyl alcohol and washed in tap water. Antigen retrieval was carried out in 0.4% pepsin (WT1) or TRIS-EDTA, pH 9.0 (LC3II, EGFP) in 37°C incubator for 10 min; or by boiling in sodium citrate pH6 for 10 min (caspase1, IL1β, NLRP3, c-casp3). Endogenous peroxidase activity was blocked in 3% H2O2 for 10 min. Endogenous biotin was blocked with avidin/biotin blocking kit (Vector Labs). Sections were blocked in 3% BSA (WT1), MOM kit blocking reagent (Vector Labs) (EGFP, IL1β) or Vectastain rabbit kit (Vector Labs) (caspase1, NLRP3, LC3II) for 1 hour at room temperature and incubated overnight at 40C with primary antibody and at room temperature for 30 min with secondary antibody. Staining was visualized using peroxidase-conjugated antibodies using either Vectastain Elite kit or MOM kit, and 3,3-diaminobenzidine (DAB), as per the manufacturer’s protocol (Vector Labs). For tissue immunofluorescence, 4μm thick, O.C.T. Compound (Sakura) embedded cryosections were fixed in formalin, and then blocked and probed as described above. For cell immunofluorescence, cells were cultured on cover slips, fixed in 4% paraformaldehyde, permeabilized with 0.003% digitonin and blocked with 3%BSA. Cells were incubated with primary antibody for 1 hour and with secondary conjugated antibody (Alexa Fluor 555 donkey anti rabbit or Alexa Fluor 665 goat anti mouse IgG antibodies, Life Technologies, 1:500) for 30 min in room temperature. For TUNEL stain, sections were processed as described above for IHC and labeled with TdT using the ApopTag peroxidase in situ apoptosis detection kit (Millipore #S7100). Staining was visualized using DAB.
Endocytosis
Doxycycline-treated transfected HEK293 cells were incubated with 75 μM Alexa647 dextran (an endocytosis marker) and with 75 μM pHRodo Red Dextran (a pH sensitive endosomal marker) (Life technologies) for 16 h and then medium was changed to dextran-free medium with doxycycline for an 8h chase period. Hoechst dye was added and cells were imaged using Leica confocal microscopy. Dextran loading and imaging was done after changing medium to Live Cell Imaging Solution (Life Technologies). Images were quantified over whole cells using imageJ and normalized to background. A minimum of 20 cells were analyzed for each group in each experiment.
LysoTracker labeling
Doxycycline-treated transfected HEK293 cells or human urinary podocytes were incubated with 50 nM LysoTracker Red DND-99 reagent (Thermo Fisher Scientific) for 2 h and then medium was changed and cells were visualized using a Leica confocal microscope. A minimum of 20 cells were analyzed for each group.
Spinning disc confocal microscopy
Live cell imaging were performed as described previously48. Briefly, GFP-APOL1, or GFP-APOL1 D388, and mRFP-Rab7 (Addgene), or DsRed-Rab11 (Addgene) tagged proteins were coexpressed in Cos7 cells by electroporation (Gene Pulser II (Bio-Rad)). Transfected cells were seeded in glass-bottomed 35-mm dishes (no. 1.5 thickness; MatTek) and imaged 18 h later. Before imaging, medium was replaced with an imaging buffer (containing 136 mM NaCl, 2.5 mM KCl, 2 mM CaCl2, 1.3 mM MgCl2, and 10 mM HEPES [pH 7.4]). Cells were imaged using an Andor spinning confocal microscope with ×60 oil immersion objectives.
Statistical analyses
Differences between two groups were analyzed using Student’s 2-tailed t-test assuming unequal variance. Differences between more than two groups were analyzed using one-way ANOVA test. All data are presented as the means ± s.d., unless otherwise indicated. P < 0.05 was considered to be significant. n.s., P > 0.05. We did not perform analyses to predetermine sample sizes. Rather, the sample sizes were chosen empirically based on our previous experiences in the calculation of experimental variability. The numbers of animals used are described in the corresponding figure legends. All experiments were done with at least three biological replicates. No animals or samples were excluded from the analysis.
Supplementary Material
Acknowledgments
Work in the Susztak lab is supported by the National Institute of Health (NIH) DK105821, DK087635, DK076077 and DP3 DK108220. The human kidney RNAsequencing project was performed in collaboration with Boehringer Ingelheim. J.Bi-Karchin was supported by T32-DK07785 (NIH). J.B.Kopp and P.D.Dummer were supported by the Intramural Research Program, NIDDK, NIH. J.H.Miner was supported by R01DK078314 and R01DK058366, T.Rohacs by GM093290 and NS055159, A.M.Cuervo by AG054108 (NIH). M.A.Saleem was supported by Kids Kidney Research, and the Bristol Nutrition NIHR-BRU. We would also like to thank the Electron Microscopy Resource Laboratory (EMRL) core facility in University of Pennsylvania for their technical support.
Footnotes
Data Availability Statement
RNA sequencing data that support the findings of this study have been deposited in ArrayExpress with the accession code E-MTAB-5390.
Author Contribution
P.B. and J.B.-K. designed and performed the experiments, wrote and revised the manuscript. A.S.D.P. performed initial animal characterization and in vitro studies (EM and IF). C.Q. analyzed RNAsequencing data. P.D.D. and J.B.K. helped with the discussion and generated mCherry-APOL1-G0/G1/G2 stable cell lines (not used in the paper). I.S. generated TRE-GFP/APOL1-G1 stable HEK293 cell line. C.M.B.-K. and S.S.P. contributed to the human data presented in the paper. J.H.M. provided the NPHS1 transgenic mice. C.-A.A.H. provided the original APOL1 constructs. T.R. made the bicistronic plasmids containing TRE-GFP/APOL1-G0/G1/G2. K.I. and S.I. provided help with spinning disk confocal microscopy M.A.S. provided human podocytes. M.B.P. performed the pathological characterization. A.M.C. helped with autophagy studies. K.S. designed and supervised the study, wrote and revised the manuscript.
Competing Financial Interests
No competing financial interest
References
- 1.USRDS. US Renal Data System. 2015 [Google Scholar]
- 2.Lipworth L, et al. Incidence and predictors of end stage renal disease among low456 income blacks and whites. PloS one. 2012;7:e48407. doi: 10.1371/journal.pone.0048407. [DOI] [PMC free article] [PubMed] [Google Scholar]
- 3.Tzur S, et al. Missense mutations in the APOL1 gene are highly associated with end stage kidney disease risk previously attributed to the MYH9 gene. Human genetics. 2010;128:345–350. doi: 10.1007/s00439-010-0861-0. [DOI] [PMC free article] [PubMed] [Google Scholar]
- 4.Genovese G, et al. Association of trypanolytic ApoL1 variants with kidney disease in African Americans. Science. 2010;329:841–845. doi: 10.1126/science.1193032. [DOI] [PMC free article] [PubMed] [Google Scholar]
- 5.Freedman BI, et al. Differential Effects of MYH9 and APOL1 Risk Variants on FRMD3 Association with Diabetic ESRD in African Americans. PLoS Genet. 2011;7:e1002150. doi: 10.1371/journal.pgen.1002150. [DOI] [PMC free article] [PubMed] [Google Scholar]
- 6.Foster MC, et al. APOL1 variants associate with increased risk of CKD among African Americans. Journal of the American Society of Nephrology: JASN. 2013;24:1484–1491. doi: 10.1681/ASN.2013010113. [DOI] [PMC free article] [PubMed] [Google Scholar]
- 7.Friedman DJ, Pollak MR. Genetics of kidney failure and the evolving story of APOL1. The Journal of clinical investigation. 2011;121:3367–3374. doi: 10.1172/JCI46263. [DOI] [PMC free article] [PubMed] [Google Scholar]
- 8.Thomson R, et al. Evolution of the primate trypanolytic factor APOL1. Proceedings of the National Academy of Sciences of the United States of America. 2014;111:E2130–2139. doi: 10.1073/pnas.1400699111. [DOI] [PMC free article] [PubMed] [Google Scholar]
- 9.Lecordier L, et al. Adaptation of Trypanosoma rhodesiense to hypohaptoglobinaemic serum requires transcription of the APOL1 resistance gene in a RNA polymerase I locus. Molecular microbiology. 2015;97:397–407. doi: 10.1111/mmi.13036. [DOI] [PubMed] [Google Scholar]
- 10.Bruggeman LA, et al. APOL1-G0 or APOL1-G2 Transgenic Models Develop Preeclampsia but Not Kidney Disease. Journal of the American Society of Nephrology: JASN. 2016 doi: 10.1681/ASN.2015111220. [DOI] [PMC free article] [PubMed] [Google Scholar]
- 11.Madhavan SM, et al. APOL1 localization in normal kidney and nondiabetic kidney disease. Journal of the American Society of Nephrology: JASN. 2011;22:2119–2128. doi: 10.1681/ASN.2011010069. [DOI] [PMC free article] [PubMed] [Google Scholar]
- 12.Yu H, et al. A role for genetic susceptibility in sporadic focal segmental glomerulosclerosis. The Journal of clinical investigation. 2016;126:1067–1078. doi: 10.1172/JCI82592. [DOI] [PMC free article] [PubMed] [Google Scholar]
- 13.Larsen CP, et al. Histopathologic findings associated with APOL1 risk variants in chronic kidney disease. Mod Pathol. 2015;28:95–102. doi: 10.1038/modpathol.2014.92. [DOI] [PMC free article] [PubMed] [Google Scholar]
- 14.Kopp JB, et al. Clinical Features and Histology of Apolipoprotein L1-Associated Nephropathy in the FSGS Clinical Trial. Journal of the American Society of Nephrology: JASN. 2015;26:1443–1448. doi: 10.1681/ASN.2013111242. [DOI] [PMC free article] [PubMed] [Google Scholar]
- 15.Ng DK, et al. APOL1-associated glomerular disease among African-American children: a collaboration of the Chronic Kidney Disease in Children (CKiD) and Nephrotic Syndrome Study Network (NEPTUNE) cohorts. Nephrology, dialysis, transplantation: official publication of the European Dialysis and Transplant Association - European Renal Association. 2016 doi: 10.1093/ndt/gfw061. [DOI] [PMC free article] [PubMed] [Google Scholar]
- 16.Jotwani V, et al. APOL1 Genotype and Glomerular and Tubular Kidney Injury in Women With HIV. American journal of kidney diseases: the official journal of the National Kidney Foundation. 2015;65:889–898. doi: 10.1053/j.ajkd.2015.02.329. [DOI] [PMC free article] [PubMed] [Google Scholar]
- 17.Parsa A, et al. APOL1 risk variants, race, and progression of chronic kidney disease. The New England journal of medicine. 2013;369:2183–2196. doi: 10.1056/NEJMoa1310345. [DOI] [PMC free article] [PubMed] [Google Scholar]
- 18.Tin A, et al. Patterns of Kidney Function Decline Associated with APOL1 Genotypes: Results from AASK. Clinical journal of the American Society of Nephrology: CJASN. 2016;11:1353–1359. doi: 10.2215/CJN.12221115. [DOI] [PMC free article] [PubMed] [Google Scholar]
- 19.Ledo N, et al. Functional genomic annotation of genetic risk loci highlights inflammation and epithelial biology networks in CKD. Journal of the American Society of Nephrology: JASN. 2015;26:692–714. doi: 10.1681/ASN.2014010028. [DOI] [PMC free article] [PubMed] [Google Scholar]
- 20.Sampson MG, et al. Integrative Genomics Identifies Novel Associations with APOL1 Risk Genotypes in Black NEPTUNE Subjects. Journal of the American Society of Nephrology: JASN. 2016;27:814–823. doi: 10.1681/ASN.2014111131. [DOI] [PMC free article] [PubMed] [Google Scholar]
- 21.Zhaorigetu S, Wan G, Kaini R, Jiang Z, Hu CA. ApoL1, a BH3-only lipid-binding protein, induces autophagic cell death. Autophagy. 2008;4:1079–1082. doi: 10.4161/auto.7066. [DOI] [PMC free article] [PubMed] [Google Scholar]
- 22.Furuta N, Amano A. SNARE mediates autophagosome–lysosome fusion. Journal of Oral Biosciences. 2012;54:83–85. [Google Scholar]
- 23.Muller-Deile J, Schiffer M. Podocyte directed therapy of nephrotic syndrome-can we bring the inside out? Pediatric nephrology (Berlin, Germany) 2016;31:393–405. doi: 10.1007/s00467-015-3116-4. [DOI] [PubMed] [Google Scholar]
- 24.Tao J, Polumbo C, Reidy K, Sweetwyne M, Susztak K. A multicolor podocyte reporter highlights heterogeneous podocyte changes in focal segmental glomerulosclerosis. Kidney international. 2014;85:972–980. doi: 10.1038/ki.2013.463. [DOI] [PMC free article] [PubMed] [Google Scholar]
- 25.Byrne BG, Dubuisson JF, Joshi AD, Persson JJ, Swanson MS. Inflammasome components coordinate autophagy and pyroptosis as macrophage responses to infection. mBio. 2013;4:e00620–00612. doi: 10.1128/mBio.00620-12. [DOI] [PMC free article] [PubMed] [Google Scholar]
- 26.Shahzad K, et al. Caspase-1, but Not Caspase-3, Promotes Diabetic Nephropathy. Journal of the American Society of Nephrology: JASN. 2016 doi: 10.1681/ASN.2015060676. [DOI] [PMC free article] [PubMed] [Google Scholar]
- 27.Inoki K. mTOR signaling in autophagy regulation in the kidney. Seminars in nephrology. 2014;34:2–8. doi: 10.1016/j.semnephrol.2013.11.002. [DOI] [PMC free article] [PubMed] [Google Scholar]
- 28.Nichols B, et al. Innate immunity pathways regulate the nephropathy gene Apolipoprotein L1. Kidney international. 2015;87:332–342. doi: 10.1038/ki.2014.270. [DOI] [PMC free article] [PubMed] [Google Scholar]
- 29.Kasembeli AN, et al. APOL1 Risk Variants Are Strongly Associated with HIV-Associated Nephropathy in Black South Africans. Journal of the American Society of Nephrology: JASN. 2015;26:2882–2890. doi: 10.1681/ASN.2014050469. [DOI] [PMC free article] [PubMed] [Google Scholar]
- 30.Thomson R, Finkelstein A. Human trypanolytic factor APOL1 forms pH-gated cation527 selective channels in planar lipid bilayers: relevance to trypanosome lysis. Proceedings of the National Academy of Sciences of the United States of America. 2015;112:2894–2899. doi: 10.1073/pnas.1421953112. [DOI] [PMC free article] [PubMed] [Google Scholar]
- 31.Wan G, et al. Apolipoprotein L1, a novel Bcl-2 homology domain 3-only lipid-binding protein, induces autophagic cell death. The Journal of biological chemistry. 2008;283:21540–21549. doi: 10.1074/jbc.M800214200. [DOI] [PMC free article] [PubMed] [Google Scholar]
- 32.Cheng D, et al. Biogenesis and cytotoxicity of APOL1 renal risk variant proteins in hepatocytes and hepatoma cells. Journal of lipid research. 2015;56:1583–1593. doi: 10.1194/jlr.M059733. [DOI] [PMC free article] [PubMed] [Google Scholar]
- 33.Galindo-Moreno J, et al. Apolipoprotein L2 contains a BH3-like domain but it does not behave as a BH3-only protein. Cell death & disease. 2014;5:e1275. doi: 10.1038/cddis.2014.237. [DOI] [PMC free article] [PubMed] [Google Scholar]
- 34.Heneghan JF, et al. BH3 domain-independent apolipoprotein L1 toxicity rescued by BCL2 prosurvival proteins. American journal of physiology Cell physiology. 2015;309:C332–347. doi: 10.1152/ajpcell.00142.2015. [DOI] [PMC free article] [PubMed] [Google Scholar]
- 35.Hartleben B, et al. Autophagy influences glomerular disease susceptibility and maintains podocyte homeostasis in aging mice. The Journal of clinical investigation. 2010;120:1084–1096. doi: 10.1172/JCI39492. [DOI] [PMC free article] [PubMed] [Google Scholar]
- 36.Hartleben B, Wanner N, Huber TB. Autophagy in glomerular health and disease. Seminars in nephrology. 2014;34:42–52. doi: 10.1016/j.semnephrol.2013.11.007. [DOI] [PubMed] [Google Scholar]
- 37.Kawakami T, et al. Deficient Autophagy Results in Mitochondrial Dysfunction and FSGS. Journal of the American Society of Nephrology: JASN. 2015;26:1040–1052. doi: 10.1681/ASN.2013111202. [DOI] [PMC free article] [PubMed] [Google Scholar]
- 38.Tagawa A, et al. Impaired Podocyte Autophagy Exacerbates Proteinuria in Diabetic Nephropathy. Diabetes. 2016;65:755–767. doi: 10.2337/db15-0473. [DOI] [PubMed] [Google Scholar]
- 39.Yamamoto-Nonaka K, et al. Cathepsin D in Podocytes Is Important in the Pathogenesis of Proteinuria and CKD. Journal of the American Society of Nephrology: JASN. 2016 doi: 10.1681/ASN.2015040366. [DOI] [PMC free article] [PubMed] [Google Scholar]
- 40.Gabay C, Lamacchia C, Palmer G. IL-1 pathways in inflammation and human diseases. Nature reviews Rheumatology. 2010;6:232–241. doi: 10.1038/nrrheum.2010.4. [DOI] [PubMed] [Google Scholar]
- 41.Turner CM, Arulkumaran N, Singer M, Unwin RJ, Tam FW. Is the inflammasome a potential therapeutic target in renal disease? BMC nephrology. 2014;15:21. doi: 10.1186/1471-2369-15-21. [DOI] [PMC free article] [PubMed] [Google Scholar]
- 42.Li P, et al. Mice deficient in IL-1 beta-converting enzyme are defective in production of mature IL-1 beta and resistant to endotoxic shock. Cell. 1995;80:401–411. doi: 10.1016/0092-8674(95)90490-5. [DOI] [PubMed] [Google Scholar]
- 43.Doitsh G, et al. Cell death by pyroptosis drives CD4 T-cell depletion in HIV-1 infection. Nature. 2014;505:509–514. doi: 10.1038/nature12940. [DOI] [PMC free article] [PubMed] [Google Scholar]
- 44.Haque S, et al. HIV Promotes NLRP3 Inflammasome Complex Activation in Murine HIV560 Associated Nephropathy. The American journal of pathology. 2016;186:347–358. doi: 10.1016/j.ajpath.2015.10.002. [DOI] [PMC free article] [PubMed] [Google Scholar]
- 45.Lin X, Suh JH, Go G, Miner JH. Feasibility of repairing glomerular basement membrane defects in Alport syndrome. Journal of the American Society of Nephrology: JASN. 2014;25:687–692. doi: 10.1681/ASN.2013070798. [DOI] [PMC free article] [PubMed] [Google Scholar]
- 46.Klionsky DJ, et al., editors. Guidelines for the use and interpretation of assays for monitoring autophagy. Autophagy. (3rd) 2016;12:1–222. doi: 10.1080/15548627.2015.1100356. [DOI] [PMC free article] [PubMed] [Google Scholar]
- 47.Sakairi T, et al. Conditionally immortalized human podocyte cell lines established from urine. American journal of physiology. Renal physiology. 2010;298:F557–567. doi: 10.1152/ajprenal.00509.2009. [DOI] [PMC free article] [PubMed] [Google Scholar]
- 48.Soda K, et al. Role of dynamin, synaptojanin, and endophilin in podocyte foot processes. The Journal of clinical investigation. 2012;122:4401–4411. doi: 10.1172/JCI65289. [DOI] [PMC free article] [PubMed] [Google Scholar]
Associated Data
This section collects any data citations, data availability statements, or supplementary materials included in this article.