Abstract
Metastasis is the leading cause of death for cancer patients. This multi-stage process requires tumour cells to survive in the circulation, extravasate at distant sites, then proliferate; it involves contributions from both the tumour cell and tumour microenvironment (‘host’, which includes stromal cells and the immune system1). Studies suggest the early steps of the metastatic process are relatively efficient, with the post-extravasation regulation of tumour growth (‘colonization’) being critical in determining metastatic outcome2. Here we show the results of screening 810 mutant mouse lines using an in vivo assay to identify microenvironmental regulators of metastatic colonization. We identify 23 genes that, when disrupted in mouse, modify the ability of tumour cells to establish metastatic foci, with 19 of these genes not previously demonstrated to play a role in host control of metastasis. The largest reduction in pulmonary metastasis was observed in sphingosine-1-phosphate (S1P) transporter spinster homologue 2 (Spns2)-deficient mice. We demonstrate a novel outcome of S1P-mediated regulation of lymphocyte trafficking, whereby deletion of Spns2, either globally or in a lymphatic endothelial-specific manner, creates a circulating lymphopenia and a higher percentage of effector T cells and natural killer (NK) cells present in the lung. This allows for potent tumour cell killing, and an overall decreased metastatic burden.
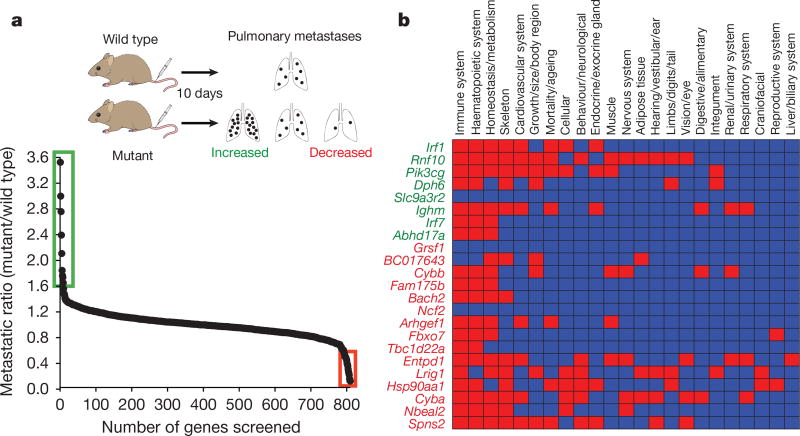
To identify microenvironmental genes that regulate metastatic colonization, we performed an ‘experimental metastasis assay’ involving intravenous injection of B16-F10 mouse metastatic melanoma cells, used previously in the development of checkpoint inhibitors such as CTLA4 and PD-1 (refs 3, 4), and the assessment of pulmonary colonization (Fig. 1a). The 810 mutant mouse lines we assayed were randomly selected and cover a diverse range of molecular functions (Extended Data Fig. 1a and Supplementary Table 1). Using a stringent two-stage selection process, we identified 23 mutant lines showing significantly decreased or increased numbers of pulmonary melanoma foci, defined as a ratio of ≤0.6 or ≥1.6 and P ≤ 0.0175 (Mann–Whitney test) for mutant mice versus wild types assayed concurrently (in the initial cohort assayed (Fig. 1a)), and P < 0.01 in an integrative data analysis performed on three or more additional cohorts (Supplementary Table 2 and Methods). Since these strains were extensively phenotyped5, we were able to determine that alterations of immune-related phenotypic traits featured prominently in these 23 mutant lines (Fig. 1b), highlighting the key role of the immune system in microenvironmental regulation of metastasis.
Figure 1. Identification of microenvironmental regulators of metastatic colonization of the lung.
a, Experimental model (schematic) and results from stage 1 of the screen: experimental metastasis assay performed on 810 mutant mouse lines (detailed in the Extended Methods). Those lines with a metastatic ratio of ≤0.6 (red box) or ≥1.6 (green box) and Mann–Whitney test P ≤ 0.0175 were taken forward to stage 2 as detailed in Methods. b, Top-level mammalian phenotype ontology terms for the 23 statistically significant genes following an integrative data analysis of experimental metastasis assay results from three or more additional cohorts (green is increased metastasis and red is decreased). In the heatmap, red boxes indicate a phenodeviant call, and blue no phenotype annotated (either no phenotype detected or not assayed) as detailed in Methods.
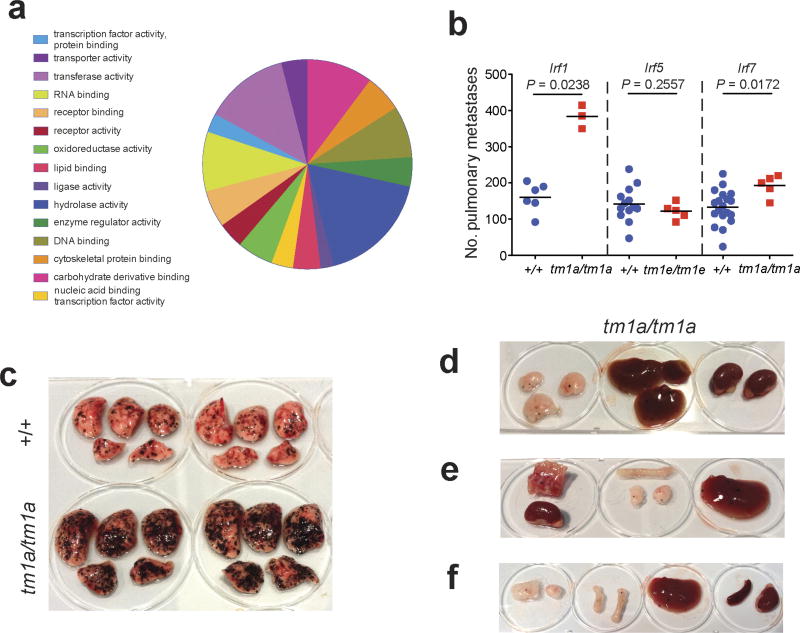
Of the eight genes identified as suppressors of pulmonary metastases, two were members of the interferon regulatory family (IRF), important for immune function; loss of Irf1 or Irf7 increased pulmonary metastasis (as well as extra-pulmonary metastases in Irf1tm1a/tm1a mice), probably related to defects in their type-I interferon (IFN)-dependent response6,7. In contrast, Irf5-deficient mice, with their largely intact type-I IFN response8, showed no altered pulmonary metastasis phenotype (Extended Data Fig. 1b–f). Similarly, the increased metastasis seen in the p110 catalytic subunit of phosphoinositide 3-kinase (Pik3cg)-deficient mice may be related to the critical function of this gene in multiple aspects of T cell, NK cell and neutrophil function9,10, and the increased metastasis seen in immunoglobulin heavy chain 6 (Ighm)-deficient mice is probably due to their multiple immune system abnormalities11. In contrast, very little is known about the other four genes we identified as microenvironmental suppressors of metastasis, namely Abhd17a, Dph6, Slc9a3r2 and Rnf10, which represent novel factors for further studies. Of the 15 mutant mouse lines we identified as having decreased pulmonary melanoma colonies, only four have been previously described as having roles in regulating metastasis: Entpd1 (Cd39), Nbeal2, Cybb and Hsp90aa1, contributing to regulatory T-cell control of NK cells12, platelet α-granule function13, generation of phagocyte-derived oxygen radicals14 and the chaperoning of client proteins involved in tumour progression15, respectively.
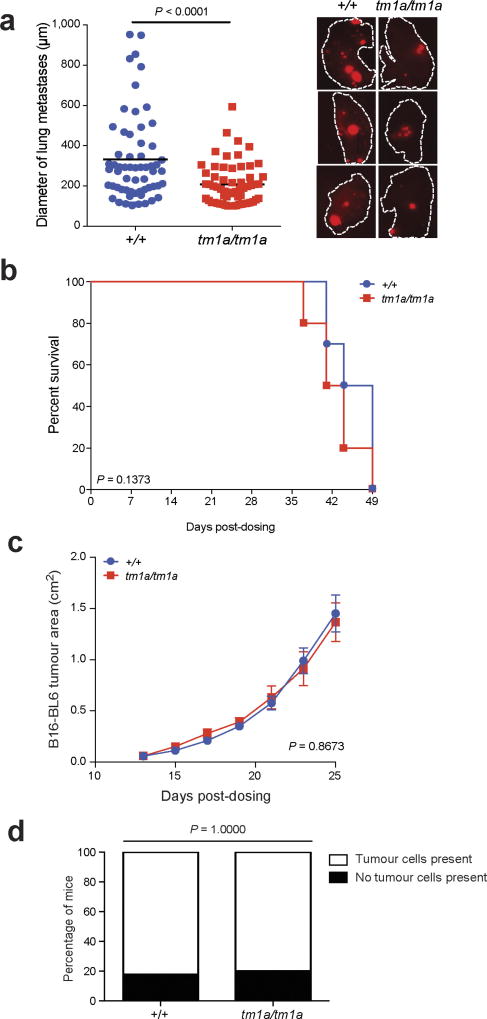
We focused on the S1P transporter Spns2, as Spns2tm1a/tm1a mice showed the greatest suppression in the number of pulmonary metastatic melanoma foci, with Spns2tm1a/+ mice showing an intermediate phenotype (Fig. 2a). Further, Spns2tm1a/tm1a mice showed reduced numbers of foci in the lungs after tail vein administration of lung CMT-167, colorectal MC-38 or breast EO771.LMB cancer cells (Fig. 2b), and decreased spontaneous pulmonary metastasis (both in number and size of metastatic foci) after subcutaneous administration of HCmel12–mCherry melanoma cells (Fig. 2c and Extended Data Fig. 2a). In contrast, there was no difference in the growth rate of the primary tumour between wild-type and Spns2tm1a/tm1a mice, either for HCmel12–mCherry or B16-BL6 melanoma cells, and no difference in the spontaneous incidence of cancer in aged wild-type and Spns2tm1a/tm1a mice (Extended Data Fig. 2b–d). Tail vein administration of transformed melanocyte WT31 cells (Fig. 2d) and intra-splenic administration of B16-F10 cells (Fig. 2e) resulted in a reduced number of foci in the livers of Spns2tm1a/tm1a mice, suggesting that resistance to metastatic colonization is not pulmonary-restricted.
Figure 2. Ability of Spns2-deficient mice to regulate metastatic colonization.
a, Experimental metastasis assay using B16-F10 cells in +/+ (blue), tm1a/+ (green) or tm1a/tm1a (red) male mice. b, Experimental metastasis assay using CMT-167 (+/+, n = 8; tm1a/tm1a, n = 6 female mice), MC-38 (+/+, n = 10; tm1a/tm1a, n = 5 male mice) and EO771. LMB cells (+/+, n = 12; tm1a/tm1a, n = 5 female mice). c, Spontaneous metastasis assay using HCmel12–mCherry melanoma cells in male mice (n = 10 per genotype). d, Experimental metastasis assay using WT31 transformed melanocytes in +/+ (n = 18) and tm1a/tm1a (n = 6) male mice. e, Intra-splenic administration of B16-F10 cells in +/+ (n = 16) and tm1a/tm1a (n = 15) female mice. Shown are representative data from two (b, CMT-167) or three independent experiments (a, b (MC-38 and EO771.LMB), d) or cumulative results of two independent experiments (c, e) with mean ± s.e.m. (b–e) or symbols representing individual mice with horizontal bar at the mean (a). P values are indicated from one-way analysis of variance (ANOVA) with Šídák’s multiple comparisons adjusting for multiple testing (a), Mann–Whitney test (b–d) or one-tailed unpaired t-test (e).
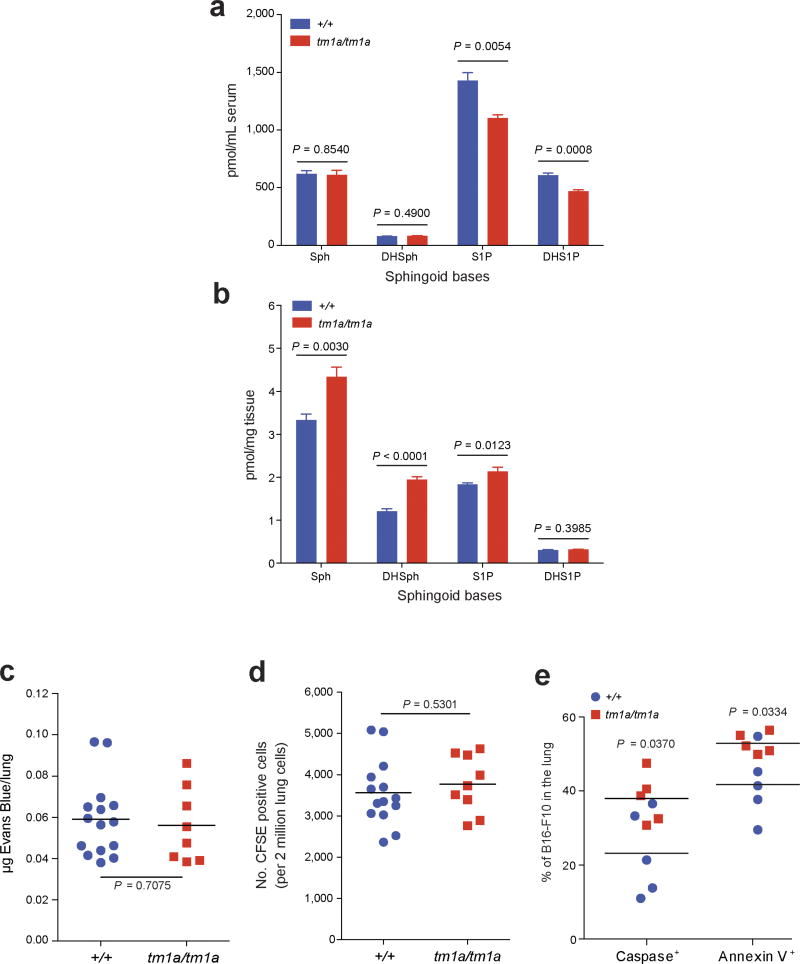
S1P is a bioactive lipid mediator that plays important roles in diverse cellular functions such as cell proliferation, differentiation, migration and tumorigenesis16. Previous studies have shown that SPNS2 functions as a cell-surface S1P transporter that allows intracellular S1P to be secreted into the blood and lymph17–19. In agreement with previous studies17,19, S1P was decreased in serum and increased in lungs of Spns2tm1a/tm1a mice (Extended Data Fig. 3a, b). Although extracellular S1P is a key regulator of endothelial barrier homeostasis20, vascular permeability/extravasation of Evans Blue dye in Spns2tm1a/tm1a mice was the same as in controls (Extended Data Fig. 3c), as was the arrival of B16-F10 cells in the lung 90 min after tail vein administration (Extended Data Fig. 3d). However, a significant increase in the number of pulmonary B16-F10 cells showing evidence of apoptosis was observed after 12 h (Extended Data Fig. 3e), suggesting that the lungs of Spns2tm1a/tm1a mice represent a hostile environment for tumour cell engraftment. RNA sequencing (RNA-seq) analysis comparing viable B16-F10 cells isolated from lungs 24 h after their administration identified nine differentially expressed (upregulated) genes (Supplementary Table 3); six of these genes (Pla2g16, Epsti1, Traf1, Glipr2, Marcksl1 and Ccl5) are known to be involved in pro-metastatic phenotypes of tumour cells, and H2-Q7-positive B16 cells have been shown to be targeted by both NK and cytotoxic T cells21. Thus, the transcriptional profile of B16-F10 cells from Spns2tm1a/tm1a lungs suggests they are upregulating genes to facilitate their survival in a hostile environment, while at the same time provoking activation of the immune system.
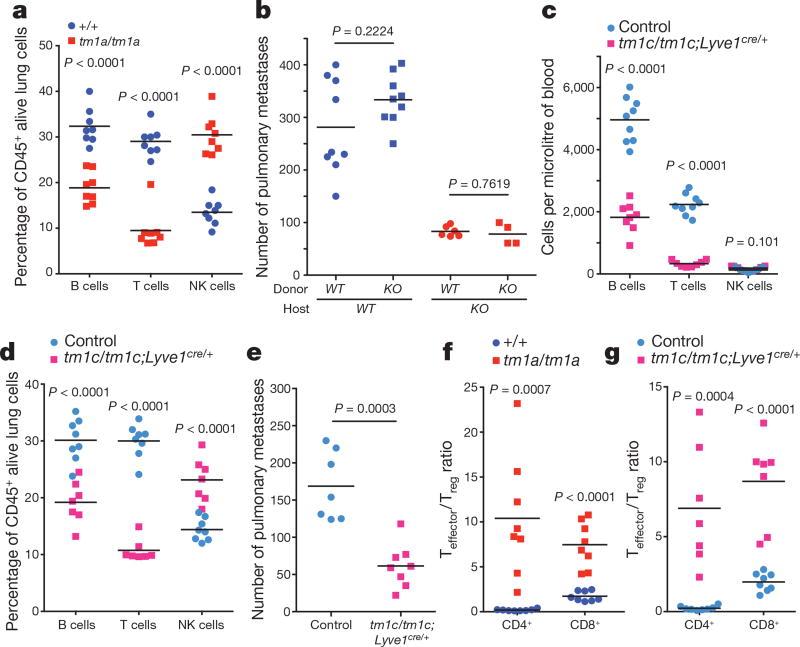
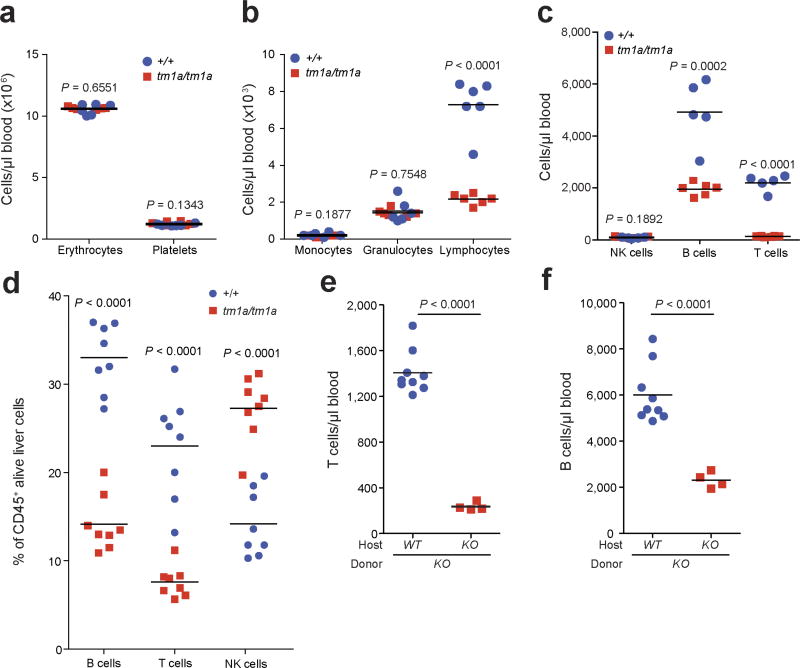
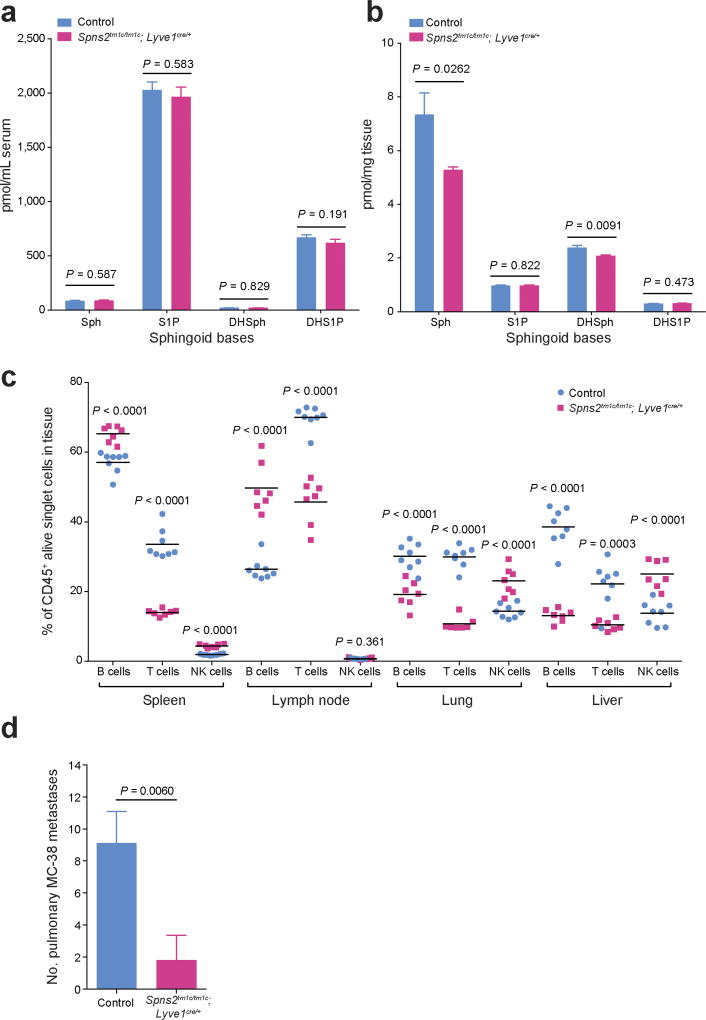
One of the most notable effects of S1P is the regulation of lymphocyte trafficking22. SPNS2 has been reported to function as an S1P transporter in endothelial cells but not in erythrocytes or platelets17. In agreement with others17–19,23, Spns2tm1a/tm1a mice have a profound reduction in circulating T and B cells, with all other leukocyte (including NK cells) and blood cell lineages unaffected (Extended Data Fig. 4a–c). In the lung, the percentage of T cells was significantly reduced with a small reduction in the B cell percentage and increased NK cells (Fig. 3a), with similar phenotypes observed in the liver (Extended Data Fig. 4d). Consistent with Spns2 expression in endothelial cells17, bone marrow chimaeras showed a lymphocyte and metastatic colonization phenotype identical to the genotype of the host (Fig. 3b and Extended Data Fig. 4e, f), confirming that non-haematopoietic stroma regulates these observations. Expression of Spns2 by endothelial cells is required for the maintenance of an S1P gradient in the lymph that is critical for regulating lymphocyte circulation18. In agreement with this, we showed that mice with lymphatic endothelial cell (LEC)-specific deletion of Spns2 (Spns2tm1c/tm1c; Lyve1cre/+ mice) did not have altered serum or lung S1P levels (Extended Data Fig. 5a, b), yet displayed lymphopenia in the blood (Fig. 3c), lungs (Fig. 3d) and other tissues examined (Extended Data Fig. 5c). Critically, this resulted in a decreased number of pulmonary metastasis in Spns2tm1c/tm1c; Lyve1cre/+ mice administered either B16-F10 or MC-38 cells (Fig. 3e and Extended Data Fig. 5d).
Figure 3. Characterization of the lymphocyte composition and phenotype in Spns2-deficient mice.
a, The percentage of lymphocyte subsets in the lungs of +/+ and tm1a/tm1a female mice. b, Number of metastases in B16-F10-dosed male bone marrow chimaeras (genotypes: +/+ (WT) and tm1a/tm1a (KO)). c, Numbers of lymphocytes in the blood of control and tm1c/tm1c; Lyve1cre/+ male mice. d, The percentage of lymphocyte subsets in the lungs of control and tm1c/tm1c; Lyve1cre/+ male mice. e, Experimental metastasis assay using B16-F10 cells in control and tm1c/tm1c; Lyve1cre/+ female mice. f, g, Effector:regulatory T-cell ratio in the lungs of +/+ and tm1a/tm1a female mice or control and tm1c/tm1c; Lyve1cre/+ male mice. Shown are representative data from two (b) or three independent experiments (a, c–g) with symbols representing individual mice with horizontal bar at the mean. P values are indicated from two-tailed unpaired t-test adjusted by the Holm–Šídák method with α set to 5% (a, c–d, f, g) or Mann–Whitney test (b, e).
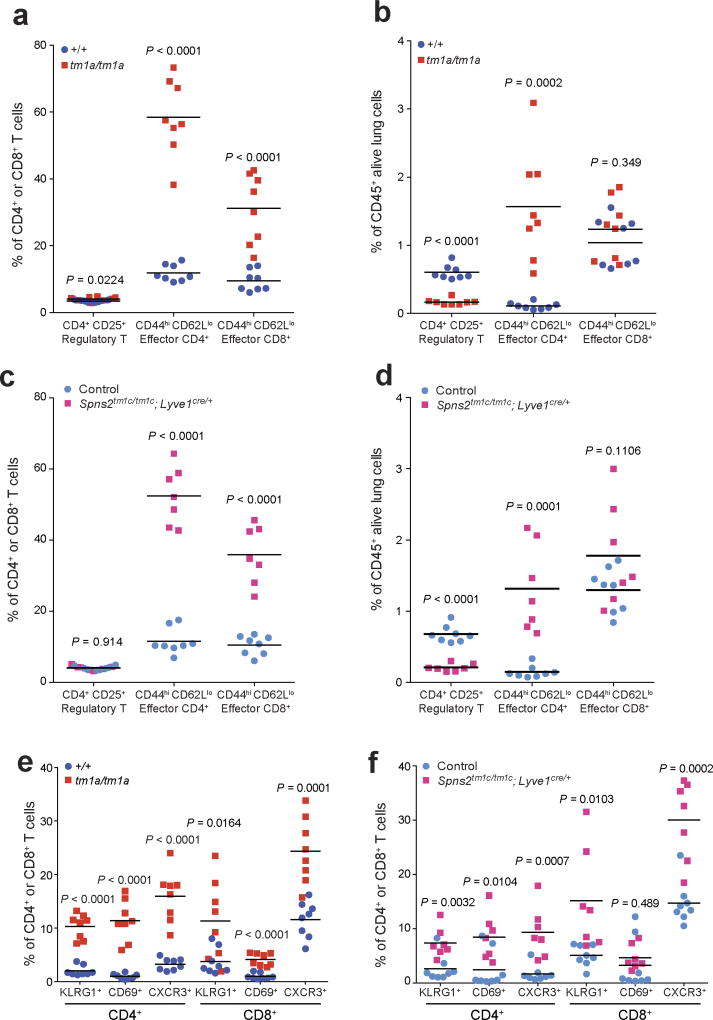
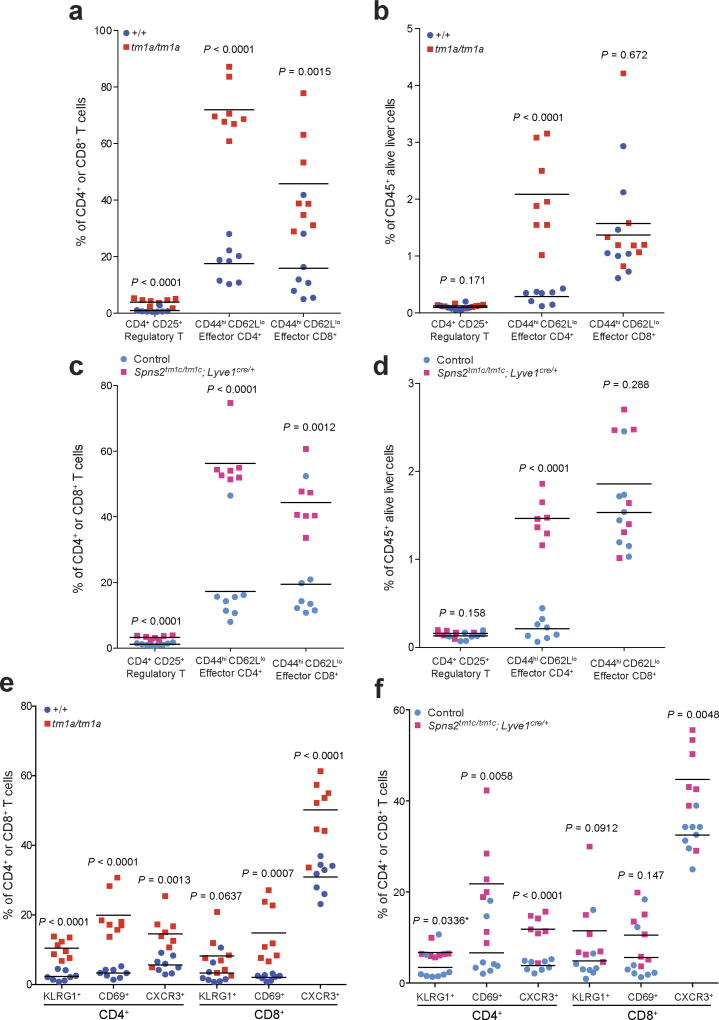
We next set out to establish the contribution of SPNS2 to the pulmonary immune microenvironment. S1P–S1PR1 signalling is essential for the recirculation of naive T cells; however, memory T cells downregulate S1PR1 expression and rely on chemokine receptors for trafficking24. In contrast, NK cell trafficking in response to S1P requires S1PR5 not S1PR1 (ref. 25). In agreement with this differential requirement of S1P for trafficking, Spns2tm1a/tm1a mice showed a significantly higher percentage of anti-tumoural effector memory T cells (CD44hiCD62Llo) relative to immune suppressive regulatory T cells (CD4+CD25+), thus providing an enhanced effector:regulatory T cell ratio (Fig. 3f and Extended Data Fig. 6a, b), with the same observed in Spns2tm1c/tm1c; Lyve1cre/+ mice (Fig. 3g and Extended Data Fig. 6c, d). An increased proportion of activated T cells (KLRG1+, CD69+ and CXCR3+) were also observed in the lungs of Spns2tm1a/tm1a and Spns2tm1c/tm1c; Lyve1cre/+ mice (Extended Data Fig. 6e, f), with a similar phenotype seen in the liver (Extended Data Fig. 7).
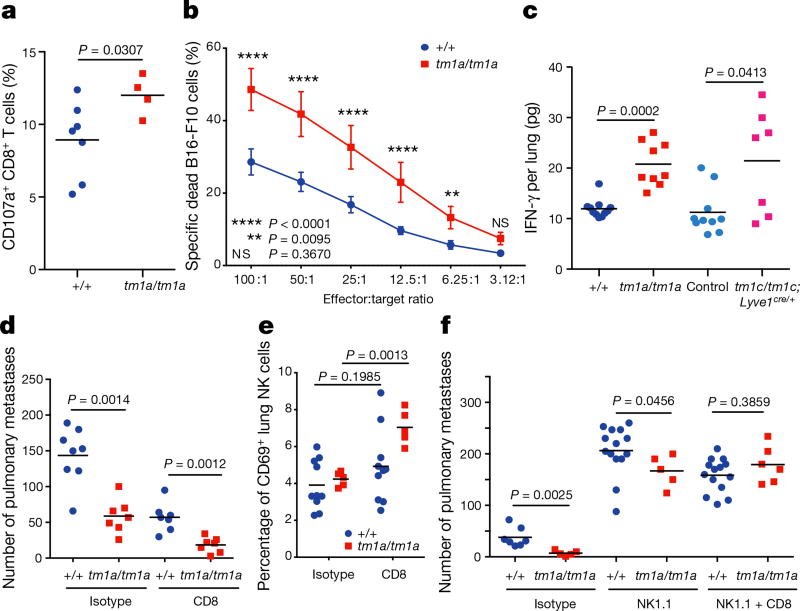
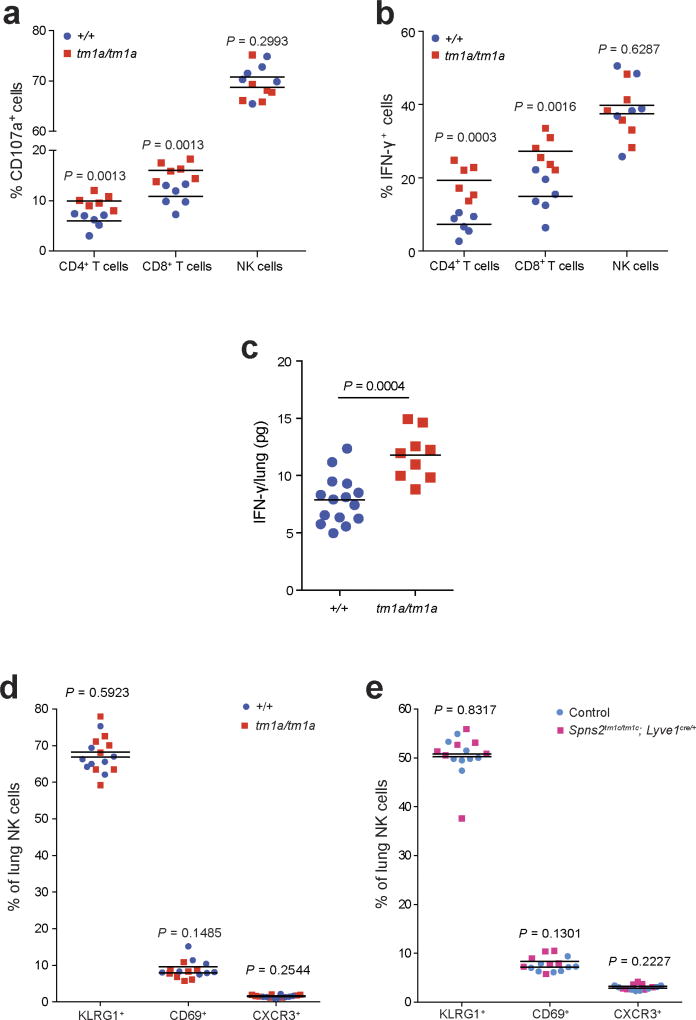
Based on this activated phenotype, we performed ex vivo re-stimulation assays, where T cells were isolated from the lungs of Spns2tm1a/tm1a and control mice 5 days after in vivo activation with B16-F10 cells. Using pharmacological stimulation, both CD4+ and CD8+ T cells from Spns2tm1a/tm1a mice showed an enhanced degranulation response (cell surface expression of CD107a/LAMP1), and increased intracellular interferon-γ (IFN-γ) relative to control mice (Extended Data Fig. 8a, b). Interestingly, only CD8+ T cells demonstrated enhanced degranulation when co-cultured with B16-F10 cells ex vivo suggestive of the presence of an improved antigen-specific response towards B16-F10 (Fig. 4a). This functionally resulted in enhanced B16-F10 target cell killing in an ex vivo cytotoxicity assay (Fig. 4b), and increased IFN-γ in lung lysates from B16-F10-stimulated Spns2tm1a/tm1a and Spns2tm1c/tm1c; Lyve1cre/+ mice (Fig. 4c). Similarly, increased IFN-γ was also observed in lung lysates from MC-38-stimulated Spns2tm1a/tm1a mice (Extended Data Fig. 8c) indicating that this is not a B16-F10 restricted phenomenon. Although there was a significant increase in the relative proportion of NK cells in the lung, no difference in NK cell function could be observed ex vivo in Spns2tm1a/tm1a mice (Extended Data Fig. 8a, b), in agreement with normal NK cell KLRG1, CD69 and CXCR3 expression in both Spns2tm1a/tm1a and Spns2tm1c/tm1c; Lyve1Cre/+ mice (Extended Data Fig. 8d, e).
Figure 4. Lymphocyte regulation of metastatic colonization in Spns2-deficient mice.
a, Degranulation assay on pulmonary leukocytes from B16-F10-stimulated +/+ and tm1a/tm1a female mice in response to in vitro re-stimulation with B16-F10. b, Cytotoxicity assay on pulmonary leukocytes from B16-F10-stimulated +/+ and tm1a/tm1a female mice (n = 8 per genotype). c, Measurement of IFN-γ in lungs of B16-F10-stimulated +/+ and tm1a/tm1a female mice, and control and tm1c/tm1c; Lyve1cre/+ male mice. d, Experimental metastasis assay using B16-F10 cells in +/+ and tm1a/tm1a female mice treated with either isotype or anti-CD8 antibody. e, The proportion of activated (CD69+) NK cells present in the lungs of +/+ and tm1a/tm1a female mice dosed with isotype or anti-CD8 antibody. f, Experimental metastasis assay using B16-F10 cells in +/+ and tm1a/tm1a male mice treated with isotype, anti-NK1.1 or anti-NK1.1 and CD8 antibody. Shown are representative data from three independent experiments, with symbols representing individual mice with horizontal bar at the mean (a, c–f) or mean ± s.e.m. (b). P values are indicated from two-tailed unpaired t-test with Welch’s correction (a, c, e), two-way repeated measures ANOVA with Šídák’s multiple comparisons test for each effector:target ratio (b) or Mann–Whitney test (d, f).
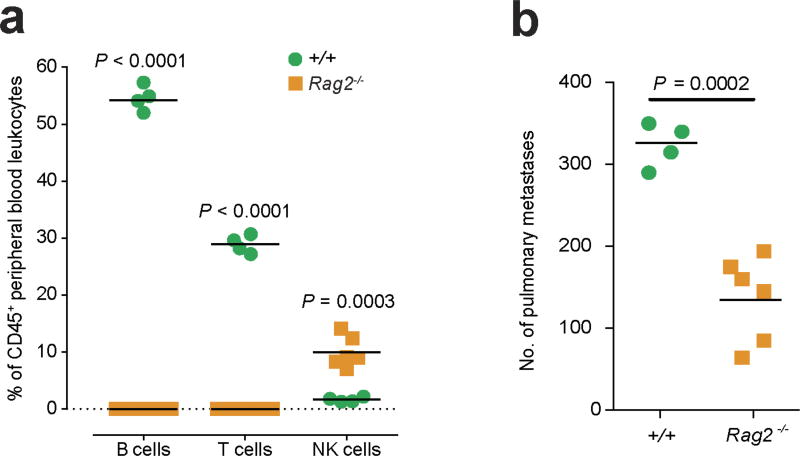
To determine whether the beneficial effects of Spns2 in regulating metastatic colonization could be mediated by CD8+ T cells, we performed in vivo depletion experiments using anti-CD8 antibodies. However, paradoxically, depletion of CD8+ T cells (or all T and B cells, such as in Rag1 knockout mice) has previously been shown to decrease B16-F10 pulmonary metastasis (but not primary tumour growth); this phenomenon has been explained by the ‘pro-tumoural’ phenotype of CD8+ T cells before tumour cell exposure versus the ‘anti-tumoural’ effect of antigen-specific CD8+ T cells26. Indeed, we replicated this finding observing decreased pulmonary B16-F10 metastases in CD8+ T-cell-depleted wild-type mice (Fig. 4d; and Rag2 knockout mice, Extended Data Fig. 9); however, a genotype-specific effect was still observed in Spns2tm1a/tm1a mice, suggesting the involvement of additional cell types in the regulation of metastatic colonization. Given that we observed compensatory NK cell activation (CD69+) in the lungs of CD8+ T-cell-depleted Spns2tm1a/tm1a mice (Fig. 4e), we hypothesized NK cells could be responsible for the significantly reduced metastasis count compared with wild types. To explore this observation further, we performed NK cell depletion, resulting in increased B16-F10 metastases as reported previously26; however, Spns2tm1a/tm1a mice still showed a significantly reduced number of metastatic foci compared with wild types (Fig. 4f), in agreement with the enhanced CD8+ response to B16-F10 cells observed ex vivo (Fig. 4a). To demonstrate the dual cellular identity responsible for protection in Spns2tm1a/tm1a we co-depleted NK and CD8+ cells in vivo restoring the number of metastatic foci observed in Spns2tm1a/tm1a mice to those of wild-type (Fig. 4f). Thus, we demonstrate that both CD8+ T cells and NK cells can contribute to the reduced pulmonary metastatic burden observed in Spns2tm1a/tm1a mice. An alteration of lymphatic endothelial cell function or lung sphingolipid levels in Spns2-deficient mice may also contribute to the reduced pulmonary metastatic burden we observe.
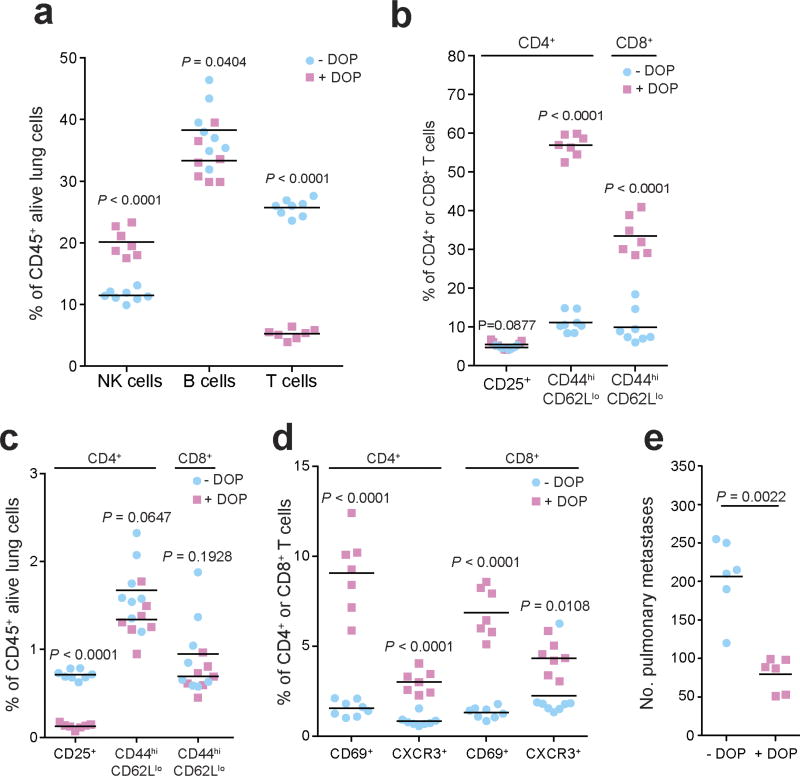
Finally, we sought to manipulate the S1P axis pharmacologically by inhibiting S1P lyase, which degrades S1P, using 4′-deoxypyridoxine (DOP), a compound previously shown to increase lymphoid tissue S1P levels and induce a circulating lymphopenia22. DOP treatment phenocopied the immune and pulmonary metastasis phenotype of Spns2tm1a/tm1a mice (Extended Data Fig. 10), further validating the importance of the S1P axis in control of pulmonary metastatic burden. Importantly modulation of SPNS2 could be a more favourable approach than the S1P-blocking antibody Sphingomab27,28 or the prodrug FTY720 (ref. 24) (which is phosphorylated in vivo to a functional antagonist of S1PR1) as these interventions increase regulatory T cell activity, suppress proliferation of effector T cells29,30 and increase vascular permeability18. Furthermore, as lymphatic endothelial cell-specific deletion of Spns2 is sufficient to regulate lymphocyte circulation to allow a higher percentage of effector T cells and NK cells in the lung (and liver) and more tumour cell killing, targeting SPNS2 is potentially a more promising option for regulating metastatic colonization than existing S1P pathway modulators.
Methods
Mice
The generation and genotyping of Spns2tm1a(KOMP)Wtsi (referred to as tm1a/tm1a)23, Lyve1tm1.1(EGFP/cre)Cys/J (referred to as Lyve1cre) mice31 and Rag2tm1Fwa mice32 have been described previously. Spns2tm1c(KOMP)Wtsi (referred to as tm1c/tm1c) mice were generated from crossing Spns2tm1a(KOMP)Wtsi mice with Flp-deleter mice33 and crossed to Lyve1cre mice to generate experimental mice (tm1c/tm1c; Lyve1cre/+) with littermates used as controls (tm1c/+; Lyve1+/+ and tm1c/tm1c; Lyve1+/+; referred to as ‘controls’). The care and use of all mice in this study were in accordance with the UK Animals in Science Regulation Unit’s Code of Practice for the Housing and Care of Animals Bred, Supplied or Used for Scientific Purposes, the Animals (Scientific Procedures) Act 1986 Amendment Regulations 2012, and all procedures were performed under a UK Home Office Project licence, which was reviewed and approved by the Sanger Institute’s Animal Welfare and Ethical Review Body (unless otherwise stated). Housing and husbandry conditions were as described previously34, with the exceptions that a cage density of one to six mice per cage was used and mice were maintained on Mouse Breeders Diet (Laboratory Diets, 5021-3) throughout the study. Unless specified otherwise, all mice were used at 6–12 weeks of age.
General experimental design
For most experiments, random allocation to treatment group was achieved through the process of Mendelian inheritance, with age- and sex-matched mice being selected across different litters and matings (to minimize potential litter and/or cage effects). The two exceptions were the NK cell depletion study and bone marrow chimaera study: in these studies, Mendelian inheritance was used to randomize assignment of animals to a genotype group; then, within this block, alternate allocation was used to assign treatment. Unless specified otherwise, the researcher was not blinded to the identity of the genotype and/or treatment of a mouse during any procedures because these were written on the cage card. Pilot experiments were performed to determine sample size with adequate statistical power for all studies except the high throughput screen where this this was not possible owing to the scale of breeding that would be required. For each procedure, exclusion criteria used are listed where applicable in the materials and methods. If no exclusion criteria are detailed, all data were included. The manuscript was prepared to meet ARRIVE reporting guidelines35.
Cell lines
The mouse melanoma B16-F10 cell line was purchased from ATCC (CRL-6475) and the highly metastatic mouse melanoma B16-BL6 cell line was purchased from the University of Texas, MD Anderson Cancer Center and authenticated by whole genome and transcriptome sequencing. The mouse lung carcinoma CMT-167 cell line was purchased from Sigma-Aldrich (10032302) and the other cell lines were obtained from the laboratories that generated them. Specifically, the metastatic mouse colorectal MC-38 cell line36 was a gift from L. Borsig (University of Zurich, Switzerland), the metastatic mouse mammary cancer EO771.LMB cell line37 was a gift from R. L. Anderson (Peter MacCallum Cancer Centre, Australia), the metastatic HCmel12–mCherry melanoma cell line38 was a gift from T. Tuting (University Hospital Magdeburg, Germany) and the transformed mouse melanocyte WT31 cell line (Tyr::NrasQ61K/°; INK4a−/−)39 was a gift from O. Sansom (Beatson Institute for Cancer Research, Scotland). None of the cell lines used appears in the International Cell Line Authentication Committee database. All cells (apart from WT31 cells) were maintained in DMEM with 10% (v/v) fetal calf serum and 2 mM glutamine, 100 U/mL penicillin/streptomycin (with the addition of 20 mM HEPES for EO771.LMB cells) at 37 °C, 5% CO2. WT31 cells were maintained in RPMI with 10% (v/v) fetal calf serum and 2 mM glutamine, 100 U/mL penicillin/streptomycin at 37 °C, 5% CO2. All cell lines were screened for the presence of mycoplasma and mouse pathogens (at Charles River Laboratories, USA) before culturing and never cultured for more than five passages. The B16-F10–mCherry cells, stably expressing mCherry, were generated by co-transfection of B16-F10 cells with 4.5 µg of PB-CAGG-LUC-2A–mCherry–PURO-PB plasmid (a gift from D. Ryan, Wellcome Trust Sanger Institute) and 0.5 µg of PBase-expressing plasmid using Fugene HD (Promega) according to the manufacturer’s recommendations. After selection in 5 µg/mL puromycin (Gibco BRL) for 10 days, cell sorting was performed (MoFlo XDP, Beckman Coulter) to select for those cells expressing high levels of mCherry and was maintained in 5 µg/mL puromycin.
Experimental metastasis assay
B16-F10 (4 × 10⁵), CMT-167 (1 × 10⁵), MC-38 (4 × 10⁵), EO771.LMB (4 × 10⁵) or WT31 (2.5 × 10⁶) cells resuspended in 0.1 mL phosphate buffered saline (PBS) were injected into the tail vein of 6- to 12-week-old sex-matched syngeneic control and mutant mice. After 10 days (or 30 days if WT31 cells were used) the mice were killed, their lungs removed (or livers removed if WT31 cells were used) and the number of metastatic foci counted macroscopically (for B16-F10 and WT31 cells) or microscopically from formalin-fixed haematoxylin and eosin-stained sections by a pathologist (for CMT-167, MC-38 and EO771.LMB cells; the pathologist was blinded to the genotypes of the samples). For intrasplenic injections of B16-F10 melanoma cells, the mice were anaesthetized under isofluorane gas and a laparotomy performed to expose the spleen. B16-F10 cells (1 × 10⁴) resuspended in 0.03 mL PBS were injected into the tail of the spleen, after which surgical incisions were sutured and surgical clips applied. Animals were monitored throughout recovery with dietary support and analgesia (Rimadyl 100 µg/mL ad libitum) provided, as approved by the Glasgow University Ethics Committee. After 14 days, the mice were killed, their livers removed and the number of metastatic foci counted macroscopically.
Metastatic colonization screen
The experimental metastasis assay (detailed above) was performed by administering 4 × 10⁵ B16-F10 cells to age- and sex-matched wild-type and mutant mice. The mice were 6–12 weeks old (typically 6–8 weeks) at time of dosing and dosing cohorts typically consisted of 12–24 control mice with 3–5 different mutant alleles being screened (3–8 mutant mice per allele). To ensure consistency, preparation of the cells, administration into the tail vein and counting of pulmonary metastatic foci were performed by the same individual. To ensure a high level of accuracy, a two-stage process was implemented, with final calls only being made after data had been collected from multiple independent cohorts (the data from all mice were included in the analysis except for when the full 0.1 mL of cell suspension were not successfully administered because of difficulties at the time of injection). The first stage was a high-throughput process to identify lines of potential interest for the second stage; in this stage, mutant lines with a ‘metastatic ratio’ (mean number of metastatic foci in the mutant cohort divided by mean number of metastatic foci in the wild-type cohort) ≤ 0.6 or ≥ 1.6 and P ≤ 0.0175 in the Mann–Whitney test (a subsequent analysis estimated a false discovery rate of 15%) progressed to the second stage. In the second stage, at least three additional cohort(s) of mice (of both sexes) were independently studied and the data combined into an integrative data analysis (IDA) as detailed in the Statistics section.
Bone-marrow chimaeras
Wild-type (CD45.1 congenically marked syngeneic) and tm1a/tm1a mice were given 2 × 4.2 Gy whole-body irradiation followed by tail vein administration of 3 × 10⁶ bone marrow cells from either wild-type (CD45.1 congenic) or tm1a/tm1a mice. Six weeks after transplantation, a tail vein blood sample was taken from the mice to assess the relative proportion of CD45.1 versus CD45.2 cells and the number of T and B lymphocytes present in the peripheral blood; 2 days later, an experimental metastasis assay was performed.
In vivo depletion studies
Mice were given intraperitoneal doses of antibodies (anti-CD8 (clone YTS169.4), rat IgG2b isotype control (clone LTF-2), anti-NK1.1 (clone PK136), mouse IgG2a (clone C1.18.4)), 200 µg in 0.1 mL PBS on days −3, 0 and +5, with B16-F10 cells administered by tail vein on day 0 (CD8-depletion mice were dosed with 4 × 10⁵ B16-F10 cells; NK and NK/CD8-depletion mice were dosed with 2 × 10⁵ B16-F10 cells). Tail vein blood samples were collected from all mice on day +1 to confirm the depletion was effective. All antibodies were ‘InVivoMAb’ from BioXCell.
S1P lyase inhibitor studies
For S1P lyase inhibitor studies, the mice were either given glucose (10 g/L) or glucose plus 4′ deoxypyridoxine (DOP, 30 mg/L; Sigma) in their drinking water 1 week before any experimentation (with mice remaining on treatment for the duration of the experiment)22.
Primary tumour growth studies
For examination of orthotopic tumour growth, wild-type and tm1a/tm1a male and female mice at 6–8 weeks of age were subcutaneously administered 2.5 × 10³ B16-BL6 melanoma cells in the flank. The developing tumours were measured every second day and if they had reached (or were very close to) 2 cm2 on the day of measurement the mice were immediately culled (no tumour was ever more than 2.4 cm2), as approved by a Home Office Inspector under the authority of the Animals (Scientific Procedures) Act 1986.
Spontaneous metastasis assay
Wild-type and tm1a/tm1a mice were subcutaneously dosed with 2 × 10⁵ HCmel12–mCherry melanoma cells and the resulting tumour growth was monitored by inspection and palpation. The size of the tumour was measured weekly using Vernier callipers and recorded as mean diameter. Mice were killed when progressively growing melanomas exceeded 20 mm in size and tissues collected for further analyses (in accordance with institutional and national guidelines for the care and use of laboratory animals with approval by the local government authorities (LANUV, NRW, Germany)). The number of macroscopically visible metastases present on the lung surface were counted by two independent investigators in a blinded fashion.
Preparation of tissue cell suspensions
Mice were perfused with 20 mL PBS by cardiac puncture and the tissues were disrupted in C tubes using program m_lung_01 with an gentleMACS (Miltenyi Biotec) in Hanks Balanced Salt solution (HBSS) containing calcium and magnesium. Liberase DL (Collagenase with low dispase content, Roche, Burgess Hill, UK) was added to a final concentration of 0.1 U/mL and incubated for 30 min at 37 °C. The tubes were then processed using program m_lung_02 and DNase (0.1 mg/mL) was added for a further 30 min at 37 °C. The resulting cell suspension was centrifuged at 400 g for 5 min, resuspended in 2 mL fluorescence-activated cell sorting (FACS) buffer (D-PBS without calcium and magnesium containing 2 mM EDTA, 0.5% fetal calf serum and 0.09% sodium azide), passed through a 30 µm cell strainer and analysed on the flow cytometer. To determine the number or viability of melanoma cells present in the lungs of mice, the mice were dosed with either 1 × 10⁶ B16-F10 cells labelled with 10 µM CFSE (Molecular Probes, Invitrogen) at 90 min before perfusion or 1 × 10⁶ B16-F10–mCherry cells at 12 h before perfusion. In each case, the lung cell suspension was analysed on the flow cytometer. For lung/liver leukocyte analysis, the leukocytes were enriched from other cell types in the cell suspension on a Percoll discontinuous gradient (67.5%/44%) and washed three times with FACS buffer. Single cell suspensions from spleen and lymph nodes (pooled inguinal) were prepared using frosted end of microscope slides in FACS buffer. Red blood cells were lysed from spleen samples by the addition of 2 mL PharmLyse (BD Biosciences) for 90 s at room temperature then stopped by the addition of 10 mL FACS buffer. Both spleen and lymph node samples were passed through a 30 µm cell strainer before staining. ‘Naive’ mice were those that had not been administered B16-F10 cells and ‘stimulated’ mice were those that had been tail vein administered B16-F10 cells 3 or 5 days before analysis as indicated in the figure legend.
FACS immunostaining
Samples were blocked with 1 µg of Mouse BD FC Block (anti CD16/32, clone 2.4G2, BD Biosciences) for 10 min before addition of multicolour antibody cocktails using titrated amounts to give saturating binding (see Supplementary Table 4 for more details). After washing, cells were stained with a viability dye (Live/Dead Blue, Invitrogen, 1 in 1,000 dilution in PBS) for 10 min at room temperature, then washed before acquisition. For determination of apoptosis, lung preparations were prepared as above and were stained with Caspglow reagent (eBioscience UK) according to the manufacturer’s instructions for 1 h at 37 °C. Cells were washed with Annexin binding buffer and stained with Annexin V-APC (both BD Biosciences) according to the manufacturer’s instructions for 15 min at room temperature. Cells were washed with Annexin binding buffer and resuspended Annexin V binding buffer containing 1 µg/mL DAPI (Life Technologies) before acquisition. To determine absolute cell counts of leukocyte populations, whole blood was counted with a haematology analyser (Scil Vetabc) and the white blood cell count was used to derive the number cells per microlitre of blood, with the immune cell populations as percentage of leukocytes.
Lung leukocyte cytotoxicity
Leukocytes were prepared from perfused lungs 5 days after B16-F10 injection as described above. B16-F10 target cells were labelled with 1 µM CFSE (Molecular Probes, Invitrogen). Target cells and lung leukocytes were added to 96-well round-bottomed plates at effector to target ratios indicated for 4 hours at 37 °C in complete DMEM medium (prepared as described in ‘Cell lines’). The cells were washed twice with ice-cold PBS then resuspended in 100 µL Live/Dead far red (Invitrogen, 1 in 1,000 dilution in PBS) for 10 min at room temperature. Cells were washed twice and resuspended in BD Cell Fix for 10 min at room temperature and washed twice with FACS buffer, before acquisition where 2,000 target cells were collected. Cytotoxicity was calculated according to the following equation: (percentage of dead target cells with effector cells) − (percentage of dead target cells with no effector cells added).
Leukocyte degranulation and IFN-γ production
Leukocytes were prepared from perfused lungs 5 days after B16-F10 injection as described above. Cells were stimulated with target cells (B16-F10 at effector to target ratio of 2.5:1) or phorbol myristate acetate (PMA) and ionomycin (100 ng/mL and 150 ng/mL, respectively both Sigma-Aldrich). Cells and stimulus were added to 96-well round-bottomed plates in the presence of anti-CD107a antibody and BD GolgiStop (monensin, final concentration 2 µM) in complete DMEM medium for 4 hours at 37 °C. The plates were washed twice with ice-cold FACS buffer before blocking then staining with anti-TCRβ, CD45, NK1.1 and CD8α antibodies. Cells were then stained with a fixable viability indicator (Live/Dead Blue, Invitrogen) before intracellular staining for IFN-γ according to standard methods and analysed by flow cytometry where a minimum of 50,000 CD45+ alive leukocyte events were collected. CD107a and IFN-γ gates were set on unstimulated leukocyte samples and specific degranulation or intracellular IFN-γ staining was calculated by subtracting the leukocyte alone unstimulated values from the treated values.
Flow cytometry
All samples were analysed on an LSR II or LSRFortessa (both BD Biosciences) that were standardized using BD Cytometer Setup and Tracking Beads and software. Compensation was determined using Ultracomp eBeads (eBioscience) for all antibodies, and ArC amide binding beads (Invitrogen) for live/dead stains. Data acquisition was controlled with BD FACSDiva version 6.3 or version 8.0.1 software. For the analysis of B16-F10 apoptosis, a threshold was applied to the mCherry channel (561 nm laser 610/20 BP) to exclude 90% of the lung cells. For the analysis of cytotoxicity, a threshold was applied to the CFSE channel (488 nm laser 530/30 BP) to exclude 90% of the lung leukocytes. In both cases these were established using B16-F10 mCherry- or CFSE-labelled B16-F10 cells. In all other cases an FSC-A threshold was used to exclude debris. All samples were analysed using FlowJo 10.7 and were analysed genotype and/or treatment blind. For all phenotyping data, doublets were excluded using FSC-A versus FSC-H gates, sample acquisition issues (such as clumps and unstable event rate) were excluded using a time gate against a fluorescent parameter that was off the laser with the longest time delay, dead cells were excluded from all tissue analysis using a viability indicator and debris excluded with FSC-A versus SSC-A gates. A leukocyte gate was set with CD45 and SSC-A and all cell subsets are reported as the percentage of this parent gate. T cells were defined as TCRγδ− CD3+ NK1.1− or TCRβ+ NK1.1− with CD4+ and CD8+ gates defined on this parent population, NK cells defined as NK1.1+ CD3− or TCR−, and B cells defined as CD19+. T and NK cell phenotypes were determined using fluorescent minus one controls to establish gating. Data from a sample were excluded if there were insufficient events in the parent gate to allow analysis: for example, if there were fewer than 50,000 CD45+ alive leukocytes in lung phenotyping data, these were excluded from the data set.
Lung IFN-γ determination
Five days after B16-F10 injection lungs were saline perfused and homogenized in Tris-buffered saline with 0.5% Triton X100 using M tubes and a gentleMACS (Miltenyi Biotec) with program protein_01. Samples were cleared by centrifugation for 10 min at 20,000 g at 4 °C. IFN-γ levels in the lung lysates were determined using a Ready Set Go ELISA kit (eBioscience, Hatfield, UK) according to the manufacturer’s instructions.
Transcriptome sequencing
Wild-type and tm1a/tm1a mice tail vein dosed with 1 × 10⁶ B16-F10–mCherry cells were killed after 24 h and lung cell suspensions prepared as described above. Using a cell sorter (MoFlo XDP), B16-F10–mCherry cells were identified after displaying in a bivariate plot of SSC-log versus mCherry by gating on high forward scatter versus side scatter to exclude some debris and dead cells and positively sorted. RNA was extracted from the sorted cells using the RNeasy Mini kit (Qiagen), according to the manufacturer’s instructions, and used to generate cDNA with the Smart-seq2 protocol40,41. Multiplexed sequencing libraries were generated from amplified cDNA using Nextera XT (Illumina). The multiplexed mRNaseq libraries were pooled and sequenced across multiple lanes on the Illumina Hiseq 2000 (version 3). Paired-end 100 bp reads were aligned with STAR version 2.3.0 (ref. 42), allowing a minimum (50 bp) and maximum intron size (500,000 bp). STAR genome index files were generated using a GTF file corresponding to gene models from ENSEMBL version 74 and reference genome version GRCm38. Read counting was performed with htseq-count from the HTSeq package (version 0.5.4p5)43. The htseq-count software was run with the options ‘intersection-nonempty’ mode, non-stranded, minimum quality 10, and ‘exon’ was used as the feature type, with ‘gene_id’ as the GTF feature ID. The Bioconductor (version 3.1)44 package DESeq2 (version 1.8.1)45 was used for differential expression analysis. We used the local fit parameter for dispersion fitting and obtained the significance with the DESeq2 negative binomial Wald test function. Genes with adjusted to P < 0.05 after Benjamini–Hochberg correction and a log2(fold change) less than −0.59 or greater than 0.59 was considered significantly differentially expressed.
Analysis of sphingolipids by LC-ESI-MS/MS
Serum and saline perfused lung tissues were collected from the mice. After the addition of internal standards (0.5 nmol each; Avanti Polar Lipids, Alabaster, Alabama, USA) the lipids were extracted and sphingolipids were quantified by LC-ESI-MS/MS (4000 QTRAP, AB Sciex, Framingham, Massachusetts, USA) as described previously46.
Statistics
Statistical tests were selected to be appropriate for the data properties (for example, normality or homogeneity of variance) and experimental design such that the assumptions of the test would be met. Where multiple testing occurred within a study, it was managed by controlling the family-wise error rate as detailed in the associated figure legend. Integrative data analysis (also called mega-analysis)47 was completed using R (package nlme version 3.1), treating each experiment as a fixed effect. An iterative top-down modelling strategy was implemented starting with the most comprehensive model (either equations (1) or (2)) appropriate for the collection strategy implemented and ensuring the model only included terms where they could be independently assessed:
| (1) |
| (2) |
The optimization process first selected a covariance structure for the residual, then the model was reduced by removing non-significant fixed effects, and finally the genotype effect was tested and model diagnostics visualized. For the hypothesis test of primary interest, the impact of genotype, the per-comparison error rate threshold P values were adjusted to account for the multiple comparisons to control the family-wise error rate to 5% using the Hochberg method48.
Bioinformatic analysis of molecular functions and phenotype
Using the Mouse Genome Informatics (MGI) portal (http://www.informatics.jax.org), all 810 mutant lines screened were separated into unique symbols (to separate out microRNA clusters) and annotated with molecular function using the Gene Ontology (GO) batch query selecting the GO_Slim annotations. Phenotypic information was pulled from MGI as a batch query (MGI 6.06, release date 5 October 2016) and supplemented with annotations from the International Mouse Phenotyping Consortium (IMPC – release 4.3, 26 April 2016) portal (http://www.mousephenotype.org). The reported mammalian phenotype (mp) terms returned were collapsed to the top-level term for the generation of the heatmap. We were not able to discriminate between no phenotype detected and no phenotypic data present; thus both outcomes are represented with a blue cell with the presence of phenotypes indicated by the red cell.
Data availability
The data that support the findings of this study are available from the corresponding author upon reasonable request. The data for Extended Data Fig. 2c are available in the online version of this paper. The data for the results of the experimental metastasis assay from stage 1 of the screen and the integrative data analysis are available in the online version of this paper. All RNA-seq data are available under European Nucleotide Archive accession number ERP005660 and ArrayExpress accession number E-ERAD-287, with the results of the analysis shown in Supplementary Table 3.
Extended Data
Extended Data Figure 1. Molecular function of 810 mutant mouse lines screened and phenotypic characterization members of the interferon regulatory factor (Irf) family.
a, Molecular function Gene Ontology annotation of the 810 mutant mouse lines screened as detailed in Methods. b, Experimental metastasis assay using B16-F10 cells in Irf1tm1a/tm1a, Irf5tm1e/tm1e, Irf7tm1a/tm1a and concurrent control female mice. Shown are representative data from two (Irf5), four (Irf1) or six (Irf7) independent experiments. Symbols represent individual mice with a horizontal bar at the mean. P values are from a Mann–Whitney test. c–f, Representative photographs showing B16-F10 metastatic colonies on the (c) lungs of +/+ and Irf1tm1a/tm1a mice and (d–f) the presence of extra-pulmonary metastases in Irf1tm1a/tm1a mice (tissues from three mice shown).
Extended Data Figure 2. Spontaneous pulmonary metastases and primary tumour growth in Spns2 mice.
a, Size measurements of spontaneous pulmonary HCmel12–mCherry melanoma cell metastases of male mice with representative fluorescent images (lines indicate the edge of the lungs); n = 10 per genotype, horizontal bars represent mean (of 50 individual metastases counted per genotype) (one-way ANOVA with blocking factor of experiment, cumulative results of two independent experiments shown). b, Survival curve of +/+ and tm1a/tm1a male mice (n = 10 per genotype) in a spontaneous metastasis assay using HCmel12–mCherry cells (log-rank test (Mantel–Cox), cumulative results of two independent experiments shown). c, Growth of subcutaneously administered B16-BL6 cells in +/+ (four male, five female) and tm1a/tm1a (five male, one female) mice. Symbols represent mean ± s.e.m. with a two-tailed unpaired t-test with Welch’s correction used to compare the area under the curve. d, Incidence of cancer in aged (> 40 weeks) +/+ (n = 15; 4 males, 11 females) and tm1a/tm1a (n = 18; 5 males, 13 females) mice. Statistical analysis was performed using a Fisher’s exact test.
Extended Data Figure 3. Phenotyping of the serum and lungs of Spns2 mice.
Sphingoid base levels in the (a) serum (+/+, n = 5; tm1a/tm1a, n = 4) and (b) lungs (+/+, n = 6; tm1a/tm1a, n = 5) of male mice; data are mean ± s.e.m., multiple two-tailed unpaired t-tests with P value adjusted by the Holm–Šídák method with α set to 5%. Sph, sphingosine; DHSph, dihydrosphingosine; S1P, sphingosine-1-phosphate; DHS1P, dihydrosphingosine-1-phosphate. c, Micrograms of extravasated Evans blue dye in the lungs of +/+ and tm1a/tm1a male mice. d, Number of CFSE-labelled B16-F10 cells present in the lungs of female mice 90 min after administration. e, Levels of apoptosis in B16-F10–mCherry cells 12 h after administration to male mice. Shown are representative data from three independent experiments, with symbols representing individual mice. P values are indicated from two-tailed unpaired t-test with Welch’s correction (c–e).
Extended Data Figure 4. Phenotypic characterization of the haematopoietic system of Spns2 mice.
a–c, The numbers of erythrocytes and platelets, monocytes, granulocytes and lymphocyte subsets present in the blood of naive +/+ and tm1a/tm1a female mice (multiple two-tailed unpaired t-tests with P value adjusted by the Holm–Šídák method with α set to 5%; data shown are representative of three independent experiments). d, Analysis of lymphocyte subsets in the liver of naive +/+ and tm1a/tm1a female mice (multiple two-tailed unpaired t-tests with P value adjusted by the Holm–Šídák method with α set to 5%; data shown are representative of three independent experiments). e, f, T- and B-lymphocyte numbers in the blood of male naive (unstimulated) bone marrow chimaeras (unpaired two-tailed t-test with Welch’s correction; data shown are representative of two independent experiments). Symbols represent individual mice; horizontal bars represent mean.
Extended Data Figure 5. Characterization of the phenotype of lymphatic endothelial cell Spns2 deficient mice.
a, b, Sphingoid base levels in the (a) serum or (b) lung of control and Spns2tm1c/tm1c; Lyve1cre/+ male mice (data are mean ± s.e.m., control n = 11, Spns2tm1c/tm1c; Lyve1cre/+ n = 10, multiple two-tailed unpaired t-tests with P value adjusted by the Holm–Šídák method with α set to 5%). Sph, sphingosine; DH-Sph, dihydrosphingosine; S1P, sphingosine-1-phosphate; DH-S1P, dihydrosphingosine-1-phosphate. c, Lymphocyte subsets in the spleen, lymph node, lung and liver of +/+ and tm1a/tm1a male mice (symbols represent individual mice, horizontal bars represent mean, multiple two-tailed unpaired t-tests with P value adjusted by the Holm–Šídák method with α set to 5%; data shown are representative of three independent experiments). d, Experimental metastasis assay using MC-38 cells in control (n = 9) and Spns2tm1c/tm1c; Lyve1cre/+ (n = 5) in female mice. Data shown are mean ± s.e.m., Mann–Whitney test, representative of three independent experiments.
Extended Data Figure 6. T cell subsets in the lungs of Spns2 mice.
The proportion of T cell subsets present in the lungs of naive +/+ and tm1a/tm1a female mice (a, b, e) and control and Spns2tm1c/tm1c; Lyve1cre/+ male mice (c, d, f). Data are shown as percentage of parent CD4+ and CD8+ T cells (a, c, e, f) or percentage of CD45+ alive lung cells present (b, d). Symbols represent individual mice with horizontal bar at the mean. P values are indicated from two-tailed unpaired t-test adjusted by the Holm–Šídák method with α set to 5%. Data shown are representative of three independent experiments.
Extended Data Figure 7. T cell subsets in the liver of Spns2 mice.
The proportion of T cell subsets present in the liver of naive +/+ versus tm1a/tm1a female mice and control versus Spns2tm1c/tm1c; Lyve1cre/+ male mice. Data are shown as percentage of parent CD4+ and CD8+ T cells (a, c, e, f) or percentage of CD45+ alive liver cells present (b, d). Symbols represent individual mice; statistical analysis used multiple two-tailed unpaired t-tests with P value adjusted by the Holm–Šídák method with α set to 5%, with * indicating a P value not considered significant after correcting for multiple testing. Data shown are representative of three independent experiments.
Extended Data Figure 8. Phenotyping of Spns2 lungs.
a, b, Ex vivo re-stimulation (PMA/ionomycin) of pulmonary leukocytes from B16-F10-stimulated +/+ and tm1a/tm1a female mice (two-tailed unpaired t-test adjusted by the Holm–Šídák method with α set to 5%). c, Measurement of IFN-γ in lungs of MC-38-stimulated +/+ and tm1a/tm1a male mice (two-tailed unpaired t-test with Welch’s correction). d, e, The proportion of NK cell subsets present in the lungs of naive +/+ versus tm1a/tm1a female mice (d) and control versus Spns2tm1c/tm1c; Lyve1cre/+ male mice (e) (multiple two-tailed unpaired t-tests with P value adjusted by the Holm–Šídák method with α set to 5%). Symbols represent individual mice, horizontal bars represent mean; data shown are representative of three independent experiments.
Extended Data Figure 9. Studies in T- and B-cell-deficient mice.
a, Measurement of lymphocyte subsets in the blood of +/+ and Rag2−/− mice (multiple two-tailed unpaired t-tests with P value adjusted by the Holm–Šídák method with α set to 5%). b, Experimental metastasis assay using B16-F10 cells in +/+ and Rag2−/− female mice (Mann–Whitney test). Symbols represent individual mice, horizontal bars represent mean; data shown are representative of three independent experiments.
Extended Data Figure 10. Characterization of the leukocyte composition and phenotype in DOP-treated mice.
a–d, The number of leukocytes and T cell subsets present in the lungs of B16-F10-dosed glucose- or DOP-treated wild-type male mice presented as the percentages of viable CD45+ lung leukocytes (a, c) or parent CD4+ or CD8+ T cells (b, d) (multiple unpaired t-tests with P value adjusted by the Holm–Šídák method with α set to 5%). e, Experimental metastasis assay in B16-F10 dosed glucose- or DOP-treated wild-type female mice (Mann–Whitney test). Symbols represent individual mice, horizontal bars represent mean; data shown are representative of two independent experiments.
Supplementary Material
Acknowledgments
This work was supported by grants from Cancer Research UK (D.J.A. and O.J.S.), the Wellcome Trust (WT098051), Combat Cancer (D.J.A.), the European Research Council (311301 COLONCAN to O.J.S. and A.D.C.), National Institutes of Health U54HG004028 (N.A.K.), and Department of Defense BCRP Program Award W81XWH-14-1-0086 (S.S.). T.T. was funded by project A27N in the SFB854, and T.B. was funded in part by an EMBO Long-Term Fellowship (ALTF 945-2015) and the European Commission (Marie Curie Action LTFCOFUND2013, GA-2013-609409). We thank J. Allegood for sphingolipid analyses and acknowledge the VCU Lipidomics Core, which is supported in part by funding from the National Institutes of Health–National Cancer Institute (NIH–NCI) Cancer Center Support Grant P30CA016059, V. Iyer (Wellcome Trust Sanger Institute) for bioinformatics analysis, and members of the Wellcome Trust Sanger Institute Research Support Facility for their care of the mice.
Footnotes
Online Content Methods, along with any additional Extended Data display items and Source Data, are available in the online version of the paper; references unique to these sections appear only in the online paper.
Supplementary Information is available in the online version of the paper.
Author Contributions L.v.d.W. devised and implemented the pulmonary metastasis screen, performing all the primary screen, confirmation and characterization studies. M.J.A. analysed the histopathological sections. A.D.C. and O.J.S. performed and analysed the intrasplenic B16-F10 assays. T.B. and T.T. performed and analysed the spontaneous metastasis assay. H.W.-J. and N.G. managed mouse breeding and were responsible for issuing phenotyping cohorts. M.D.C.V.-H., T.V., I.C.M. and K.W. performed the RNA-seq analysis. D.G. and E.R. genotyped the mice and performed gene expression analysis. S.C., A.G., E.T. and E.L.C. performed additional phenotypic characterization. The Sanger Mouse Genetics Project generated and phenotyped the mice as part of a primary phenotyping pipeline. S.S. oversaw the lipidomic analysis and provided input to the project and the manuscript. A.O.S. devised, performed and analysed the immunophenotyping assays. L.v.d.W., A.O.S. and D.J.A. led the project. L.v.d.W., A.O.S. and D.J.A. wrote the manuscript with contributions from all authors.
The authors declare no competing financial interests.
References
- 1.Quail DF, Joyce JA. Microenvironmental regulation of tumor progression and metastasis. Nature Med. 2013;19:1423–1437. doi: 10.1038/nm.3394. [DOI] [PMC free article] [PubMed] [Google Scholar]
- 2.Chambers AF, et al. Critical steps in hematogenous metastasis: an overview. Surg. Oncol. Clin. N. Am. 2001;10:243–255. [PubMed] [Google Scholar]
- 3.Blank C, et al. PD-L1/B7H-1 inhibits the effector phase of tumor rejection by T cell receptor (TCR) transgenic CD8+ T cells. Cancer Res. 2004;64:1140–1145. doi: 10.1158/0008-5472.can-03-3259. [DOI] [PubMed] [Google Scholar]
- 4.van Elsas A, Hurwitz AA, Allison JP. Combination immunotherapy of B16 melanoma using anti-cytotoxic T lymphocyte-associated antigen 4 (CTLA-4) and granulocyte/macrophage colony-stimulating factor (GM-CSF)-producing vaccines induces rejection of subcutaneous and metastatic tumors accompanied by autoimmune depigmentation. J. Exp. Med. 1999;190:355–366. doi: 10.1084/jem.190.3.355. [DOI] [PMC free article] [PubMed] [Google Scholar]
- 5.White JK, et al. Genome-wide generation and systematic phenotyping of knockout mice reveals new roles for many genes. Cell. 2013;154:452–464. doi: 10.1016/j.cell.2013.06.022. [DOI] [PMC free article] [PubMed] [Google Scholar]
- 6.Ogasawara K, et al. Requirement for IRF-1 in the microenvironment supporting development of natural killer cells. Nature. 1998;391:700–703. doi: 10.1038/35636. [DOI] [PubMed] [Google Scholar]
- 7.Honda K, et al. IRF-7 is the master regulator of type-I interferon-dependent immune responses. Nature. 2005;434:772–777. doi: 10.1038/nature03464. [DOI] [PubMed] [Google Scholar]
- 8.Purtha WE, Swiecki M, Colonna M, Diamond MS, Bhattacharya D. Spontaneous mutation of the Dock2 gene in Irf5−/− mice complicates interpretation of type I interferon production and antibody responses. Proc. Natl Acad. Sci. USA. 2012;109:E898–E904. doi: 10.1073/pnas.1118155109. [DOI] [PMC free article] [PubMed] [Google Scholar]
- 9.Sasaki T, et al. Function of PI3Kγ in thymocyte development, T cell activation, and neutrophil migration. Science. 2000;287:1040–1046. doi: 10.1126/science.287.5455.1040. [DOI] [PubMed] [Google Scholar]
- 10.Tassi I, et al. p110γ and p110δ phosphoinositide 3-kinase signaling pathways synergize to control development and functions of murine NK cells. Immunity. 2007;27:214–227. doi: 10.1016/j.immuni.2007.07.014. [DOI] [PubMed] [Google Scholar]
- 11.Kitamura D, Roes J, Kühn R, Rajewsky K. A B cell-deficient mouse by targeted disruption of the membrane exon of the immunoglobulin μ chain gene. Nature. 1991;350:423–426. doi: 10.1038/350423a0. [DOI] [PubMed] [Google Scholar]
- 12.Sun X, et al. CD39/ENTPD1 expression by CD4+Foxp3+ regulatory T cells promotes hepatic metastatic tumor growth in mice. Gastroenterology. 2010;139:1030–1040. doi: 10.1053/j.gastro.2010.05.007. [DOI] [PMC free article] [PubMed] [Google Scholar]
- 13.Guerrero JA, et al. Gray platelet syndrome: proinflammatory megakaryocytes and α-granule loss cause myelofibrosis and confer metastasis resistance in mice. Blood. 2014;124:3624–3635. doi: 10.1182/blood-2014-04-566760. [DOI] [PubMed] [Google Scholar]
- 14.Okada F, et al. The role of nicotinamide adenine dinucleotide phosphate oxidase-derived reactive oxygen species in the acquisition of metastatic ability of tumor cells. Am. J. Pathol. 2006;169:294–302. doi: 10.2353/ajpath.2006.060073. [DOI] [PMC free article] [PubMed] [Google Scholar]
- 15.Kang BH, et al. Targeted inhibition of mitochondrial Hsp90 suppresses localised and metastatic prostate cancer growth in a genetic mouse model of disease. Br. J. Cancer. 2011;104:629–634. doi: 10.1038/bjc.2011.9. [DOI] [PMC free article] [PubMed] [Google Scholar]
- 16.Takabe K, Spiegel S. Export of sphingosine-1-phosphate and cancer progression. J. Lipid Res. 2014;55:1839–1846. doi: 10.1194/jlr.R046656. [DOI] [PMC free article] [PubMed] [Google Scholar]
- 17.Fukuhara S, et al. The sphingosine-1-phosphate transporter Spns2 expressed on endothelial cells regulates lymphocyte trafficking in mice. J. Clin. Invest. 2012;122:1416–1426. doi: 10.1172/JCI60746. [DOI] [PMC free article] [PubMed] [Google Scholar]
- 18.Mendoza A, et al. The transporter Spns2 is required for secretion of lymph but not plasma sphingosine-1-phosphate. Cell Reports. 2012;2:1104–1110. doi: 10.1016/j.celrep.2012.09.021. [DOI] [PMC free article] [PubMed] [Google Scholar]
- 19.Nagahashi M, et al. Spns2, a transporter of phosphorylated sphingoid bases, regulates their blood and lymph levels, and the lymphatic network. FASEB J. 2013;27:1001–1011. doi: 10.1096/fj.12-219618. [DOI] [PMC free article] [PubMed] [Google Scholar]
- 20.Wilkerson BA, Argraves KM. The role of sphingosine-1-phosphate in endothelial barrier function. Biochim. Biophys. Acta. 2014;1841:1403–1412. doi: 10.1016/j.bbalip.2014.06.012. [DOI] [PMC free article] [PubMed] [Google Scholar]
- 21.Chiang EY, Henson M, Stroynowski I. Correction of defects responsible for impaired Qa-2 class Ib MHC expression on melanoma cells protects mice from tumor growth. J. Immunol. 2003;170:4515–4523. doi: 10.4049/jimmunol.170.9.4515. [DOI] [PubMed] [Google Scholar]
- 22.Schwab SR, et al. Lymphocyte sequestration through S1P lyase inhibition and disruption of S1P gradients. Science. 2005;309:1735–1739. doi: 10.1126/science.1113640. [DOI] [PubMed] [Google Scholar]
- 23.Nijnik A, et al. The role of sphingosine-1-phosphate transporter Spns2 in immune system function. J. Immunol. 2012;189:102–111. doi: 10.4049/jimmunol.1200282. [DOI] [PMC free article] [PubMed] [Google Scholar]
- 24.Garris CS, Blaho VA, Hla T, Han MH. Sphingosine-1-phosphate receptor 1 signalling in T cells: trafficking and beyond. Immunology. 2014;142:347–353. doi: 10.1111/imm.12272. [DOI] [PMC free article] [PubMed] [Google Scholar]
- 25.Walzer T, et al. Natural killer cell trafficking in vivo requires a dedicated sphingosine 1-phosphate receptor. Nature Immunol. 2007;8:1337–1344. doi: 10.1038/ni1523. [DOI] [PubMed] [Google Scholar]
- 26.Cuff S, Dolton G, Matthews RJ, Gallimore A. Antigen specificity determines the pro- or antitumoral nature of CD8+ T cells. J. Immunol. 2010;184:607–614. doi: 10.4049/jimmunol.0804089. [DOI] [PubMed] [Google Scholar]
- 27.Ponnusamy S, et al. Communication between host organism and cancer cells is transduced by systemic sphingosine kinase 1/sphingosine 1-phosphate signalling to regulate tumour metastasis. EMBO Mol. Med. 2012;4:761–775. doi: 10.1002/emmm.201200244. [DOI] [PMC free article] [PubMed] [Google Scholar]
- 28.Visentin B, et al. Validation of an anti-sphingosine-1-phosphate antibody as a potential therapeutic in reducing growth, invasion, and angiogenesis in multiple tumor lineages. Cancer Cell. 2006;9:225–238. doi: 10.1016/j.ccr.2006.02.023. [DOI] [PubMed] [Google Scholar]
- 29.Liu G, Yang K, Burns S, Shrestha S, Chi H. The S1P(1)-mTOR axis directs the reciprocal differentiation of T(H)1 and T(reg) cells. Nature Immunol. 2010;11:1047–1056. doi: 10.1038/ni.1939. [DOI] [PMC free article] [PubMed] [Google Scholar]
- 30.Liu Y, et al. The sphingosine-1-phosphate receptor agonist FTY720 and its phosphorylated form affect the function of CD4+CD25+ T cells in vitro. Int. J. Mol. Med. 2012;30:211–219. doi: 10.3892/ijmm.2012.973. [DOI] [PubMed] [Google Scholar]
- 31.Pham TH, et al. Lymphatic endothelial cell sphingosine kinase activity is required for lymphocyte egress and lymphatic patterning. J. Exp. Med. 2010;207:17–27. doi: 10.1084/jem.20091619. [DOI] [PMC free article] [PubMed] [Google Scholar]
- 32.Shinkai Y, et al. RAG-2-deficient mice lack mature lymphocytes owing to inability to initiate V(D)J rearrangement. Cell. 1992;68:855–867. doi: 10.1016/0092-8674(92)90029-c. [DOI] [PubMed] [Google Scholar]
- 33.Kranz A, et al. An improved Flp deleter mouse in C57Bl/6 based on Flpo recombinase. Genesis. 2010;48:512–520. doi: 10.1002/dvg.20641. [DOI] [PubMed] [Google Scholar]
- 34.Karp NA, et al. Impact of temporal variation on design and analysis of mouse knockout phenotyping studies. PLoS ONE. 2014;9:e111239. doi: 10.1371/journal.pone.0111239. [DOI] [PMC free article] [PubMed] [Google Scholar]
- 35.Kilkenny C, Browne WJ, Cuthill IC, Emerson M, Altman DG. Improving bioscience research reporting: the ARRIVE guidelines for reporting animal research. PLoS Biol. 2010;8:e1000412. doi: 10.1371/journal.pbio.1000412. [DOI] [PMC free article] [PubMed] [Google Scholar]
- 36.Borsig L, Wong R, Hynes RO, Varki NM, Varki A. Synergistic effects of L- and P-selectin in facilitating tumor metastasis can involve non-mucin ligands and implicate leukocytes as enhancers of metastasis. Proc. Natl Acad. Sci. USA. 2002;99:2193–2198. doi: 10.1073/pnas.261704098. [DOI] [PMC free article] [PubMed] [Google Scholar]
- 37.Johnstone CN, et al. Functional and molecular characterisation of EO771. LMB tumours, a new C57BL/6-mouse-derived model of spontaneously metastatic mammary cancer. Dis. Model. Mech. 2015;8:237–251. doi: 10.1242/dmm.017830. [DOI] [PMC free article] [PubMed] [Google Scholar]
- 38.Bald T, et al. Ultraviolet-radiation-induced inflammation promotes angiotropism and metastasis in melanoma. Nature. 2014;507:109–113. doi: 10.1038/nature13111. [DOI] [PubMed] [Google Scholar]
- 39.Lindsay CR, et al. P-Rex1 is required for efficient melanoblast migration and melanoma metastasis. Nature Commun. 2011;2:555. doi: 10.1038/ncomms1560. [DOI] [PMC free article] [PubMed] [Google Scholar]
- 40.Picelli S, et al. Smart-seq2 for sensitive full-length transcriptome profiling in single cells. Nature Methods. 2013;10:1096–1098. doi: 10.1038/nmeth.2639. [DOI] [PubMed] [Google Scholar]
- 41.Picelli S, et al. Full-length RNA-seq from single cells using Smart-seq2. Nature Protocols. 2014;9:171–181. doi: 10.1038/nprot.2014.006. [DOI] [PubMed] [Google Scholar]
- 42.Dobin A, et al. STAR: ultrafast universal RNA-seq aligner. Bioinformatics. 2013;29:15–21. doi: 10.1093/bioinformatics/bts635. [DOI] [PMC free article] [PubMed] [Google Scholar]
- 43.Anders S, Pyl PT, Huber W. HTSeq—a Python framework to work with high-throughput sequencing data. Bioinformatics. 2015;31:166–169. doi: 10.1093/bioinformatics/btu638. [DOI] [PMC free article] [PubMed] [Google Scholar]
- 44.Gentleman RC, et al. Bioconductor: open software development for computational biology and bioinformatics. Genome Biol. 2004;5:R80. doi: 10.1186/gb-2004-5-10-r80. [DOI] [PMC free article] [PubMed] [Google Scholar]
- 45.Love MI, Huber W, Anders S. Moderated estimation of fold change and dispersion for RNA-seq data with DESeq2. Genome Biol. 2014;15:550. doi: 10.1186/s13059-014-0550-8. [DOI] [PMC free article] [PubMed] [Google Scholar]
- 46.Hait NC, et al. Regulation of histone acetylation in the nucleus by sphingosine-1-phosphate. Science. 2009;325:1254–1257. doi: 10.1126/science.1176709. [DOI] [PMC free article] [PubMed] [Google Scholar]
- 47.Curran PJ, Hussong AM. Integrative data analysis: the simultaneous analysis of multiple data sets. Psychol. Methods. 2009;14:81–100. doi: 10.1037/a0015914. [DOI] [PMC free article] [PubMed] [Google Scholar]
- 48.Hochberg Y. A sharper Bonferroni procedure for multiple tests of significance. Biometrika. 1988;75:800–802. [Google Scholar]
Associated Data
This section collects any data citations, data availability statements, or supplementary materials included in this article.
Supplementary Materials
Data Availability Statement
The data that support the findings of this study are available from the corresponding author upon reasonable request. The data for Extended Data Fig. 2c are available in the online version of this paper. The data for the results of the experimental metastasis assay from stage 1 of the screen and the integrative data analysis are available in the online version of this paper. All RNA-seq data are available under European Nucleotide Archive accession number ERP005660 and ArrayExpress accession number E-ERAD-287, with the results of the analysis shown in Supplementary Table 3.


