Abstract
Sperm cell activation plays a critical role in a range of biological and engineering processes, from fertilization to cryopreservation protocol evaluation. Across a range of species, ionic and osmotic effects have been discovered that lead to activation. Sperm cells of zebrafish (Danio rerio) initiate motility in a hypoosmotic environment. In this study, we employ a microfluidic mixer for the purpose of rapidly diluting the extracellular medium to initiate the onset of cell motility. The use of a microchannel offers a rapid and reproducible mixing profile throughout the device. This greatly reduces variability from trial to trial relative to the current methods of analysis. Coupling these experiments with numerical simulations, we were able to investigate the dynamics of intracellular osmolality as each cell moves along its path through the micromixer. Our results suggest that intracellular osmolality, and hence intracellular ion concentration, only slightly decreases, contrary to the common thought that larger changes in these parameters are required for activation. Utilizing this framework, microfluidics for controlled extracellular environments and associated numerical modeling, has practical applicability in standardizing high-throughput aquatic sperm activation, and more fundamentally, investigations of the intracellular environment leading to motility.
Keywords: Microfluidic, Sperm analysis, Numerical modeling, Transport modeling, Zebrafish sperm cell activation
1 Introduction
The sperm cells of externally reproducing fish lead a unique and short life. Depending on the species of fish, these cells are released into a hypo- or hyperosmotic environment. The initially dormant sperm cells become motile in this environment, and a number of potential mechanisms of this sudden activation have been studied in detail (Cosson 2004; Wilson-Leedy and Ingermann 2007; Wilson-Leedy et al. 2009; Takai and Morisawa 1995; Morisawa and Suzuki 1980; Morisawa et al. 1983; Oda and Morisawa 1993). Once motile, spermatozoa use internal reserves of ATP as an energy source to swim towards an egg cell. When the intracellular reserves of ATP are depleted, the cells return to a quiescent state (Cosson 2004; Wilson-Leedy and Ingermann 2007; Wilson-Leedy et al. 2009). Duration of sperm motility varies from species to species, ranging from 60 to 90 s in zebrafish spermatozoa (Wilson-Leedy et al. 2009; Dreanno et al. 1999) to 800 s for turbot (Psetta maxima) sperm cells.
Proposed mechanisms for sperm cell activation are species dependent; typically the sperm of marine fishes activate in a hypertonic medium while those of freshwater fishes activate in a hypotonic medium (Cosson 2004). In the instance of the freshwater zebrafish, a widely used model for biomedical research (Lieschke and Currie 2007), a hypoosmotic environment is necessary for activation (Wilson-Leedy et al. 2009; Park et al. 2012). A postulated cascade of events has been published for turbot, a marine fish, spermatozoa activation upon encountering hyperosmotic conditions: the extracellular osmolality increases, water leaves the cell, internal osmolality increases along with internal ion concentrations, dynein motor proteins initiate flagellar movement, and eventually ATP stores become too low to maintain motility (Cosson 2004). An analogous cascade could be postulated for freshwater sperm placed in a hypotonic envrionment, but little is known about how much of a decrease in intracellular osmolality and the concentration of intracellular ions are requisite for activation.
The study of sperm cell activation and motility has traditionally been a time-consuming process; manual dilution followed by microscopic observation and motile cell counting is slow and results show wide variability (Park et al. 2011). Computer-assisted semen analysis (CASA) has recently remedied human error in motile cell counting (Wilson-Leedy and Ingermann 2007; Park et al. 2011), but manual dilution of water and sperm samples still makes the process inefficient and difficult to reproduce. This bottleneck affects related research in other fields such as cryopreservation of aquatic species, where evaluation of motility is used to evaluate freezing and thawing protocols, as well as cryoprotective agent dosages (Park et al. 2011).
Microfluidic sample manipulation and analysis has become a useful tool in bioengineering research, notable for the enablement of short processing times and small sample volumes (Squires and Quake 2005; Stone et al. 2004). The small scale, on the order of microns, allows unique analysis and processing conditions over a wide range of cellular phenomena, including: cell motility and migration (Ricart et al. 2011), cryopreservation (Song et al. 2009; Scherr et al. 2013; Fleming et al. 2007), as well as cell detection and filtration (Henslee et al. 2011). A potential remedy to the problems with sperm activation studies, microfluidic devices offer these activation studies both high throughput and high reproducibility. The Reynolds number (Eq. 1) inside of a microchannel depends on the fluid density (ρ), the fluid viscosity (µ), a characteristic velocity (U), and a characteristic length scale (L). Very often Reynolds numbers in microchannels are near one, indicating a lack of turbulence. This lends itself to a predictable and reproducible laminar flow, but also makes mixing at the microscale difficult. However, passive micromixers have been developed that mix fluidic streams using only a pressure gradient as a fluid driving force and no other external force fields.
| (1) |
Recently, microfluidics have been utilized for the study of sperm cells. Several studies have been performed on isolating competent sperm from immotile sperm for fertilization (Cho et al. 2003; Seo et al. 2007; Tasoglu et al. 2013).A micromixer was used to rapidly dilute the osmotic environment of zebrafish sperm, and analyze their motility using CASA (Park et al. 2012). This represents a significant step in experimental protocols for studies of sperm cell activation; analysis times are significantly reduced, sample volumes are small, and cells can be exposed to highly reproducible and controlled conditions.
Despite the supporting evidence it could provide, especially in the context of overlapping import of several different variables for sperm cell activation, modeling of the intracellular dynamics of spermcell activation has been previously nonexistent. Previous modeling efforts in related fields have yielded great insight: calcium dynamics during hyperactivation have been studied (Olson et al. 2010), along with chemotaxis (Bray 1993; Friedrich and Julicher 2007), and cryoprotective agent loading (Song et al. 2009; Scherr et al. 2013). Despite the potential applicability of these models to the onset of motility in aquatic sperm, they have yet to be adapted for such purpose.
In this work, we present an investigation of the activation of zebrafish sperm cells within a microchannel. Through the use of a microfluidic mixer, cells can be systematically diluted and rapidly delivered to an analysis chamber. This provides the ability to probe activation mechanisms in a more sophisticated manner; herein, we also show the utility of a model of passive water transport and that the resulting intracellular information would be a significant advancement in sperm cell activation research.
2 Materials and methods
2.1 Ethics statement
Guidelines from the Institutional Animal Care and Use Committees of Louisiana State University were followed for animal care in this study.
2.2 Microdevice fabrication and operation
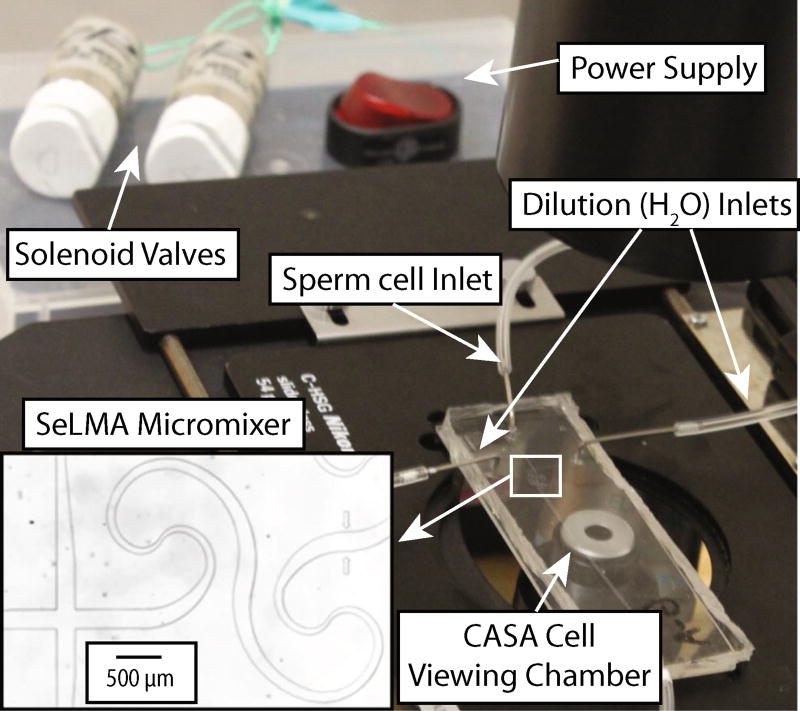
A sequential logarithmic mixing apparatus (SeLMA) was fabricated, with dimensions illustrated in Supplemental Material and detailed in (Scherr et al. 2012), by standard photolithographic methods; the 50 µm deep device was cast in polydimethylsiloxane (PDMS), Sylgard 184 (Dow Corning, Midland, MI), and plasma oxidized with a Harrick Plasma Cleaner (Harrick Plasma, Ithaca, NY) to a standard 1 in. by 3 in. glass microscope slide (VWR, Radnor, PA). The mixer occupied a 3 mm by 5 mm chip footprint, and had a center pathlength of 12 mm. There were three inlets to the device: a sample inlet that introduced cells and isosmotic Hanks’ balanced salt solution (HBSS), and two sheath inlets that introduced deionized water. Downstream of the mixer, there was a 600 µmwide by 2 cm viewing chamber where the microscope was positioned during CASA. SeLMA was chosen as a micromixer for this application because there are no obstacles, grooves, or obstructions that could potentially harm or trap the sperm cells. The fabricated device and experimental setup is shown in Fig. 1. A more detailed schematic of the micromixer and viewing chamber layout is provided as supplemental data. To achieve pressure-driven flow, 0.03-inch ID Tygon tubing (Cole-Parmer, Vernon Hills, IL) was connected to 3-mL syringes loaded into a syringe pump (KD Scientific, Holliston, MA). The outlet had 0.03-inch ID Tygon tubing leading to a collection dish.
Fig. 1.
The experimental setup consisting of a micromixer, solenoid valves, a power supply, and a viewing chamber for CASA. Experimental CASA measurements were made at the entrance to the viewing chamber, immediately following the micromixer
2.3 Solenoid valve characterization
To achieve stopped flow results for CASA, 15-psi solenoid pinch valves (Cole-Parmer, Vernon Hills, IL) were placed over the tubing at each inlet and outlet. The valves were connected in parallel and controlled by a single 24-V power supply and switch. Polystrene beads (Bangs Laboratories Inc., Fishers, IN), 10 µm in diameter, were used as tracer particles during valve characterization. After steady flow was achieved with a mixture of water and beads, sequential images were captured in the viewing chamber of the device at a frame rate of 20 frames per second. A custom MATLAB image processing script was used to track individual beads and calculate their velocity.
2.4 Zebrafish maintenance and sperm cell collection
Zebrafish obtained from Louisiana State University Aquaculture Research Station (Baton Rouge, LA) were maintained in 10-L tanks (2 fish/L) in an aquarium system (Aquatic Habitats, Apopka, FL) with water flow recirculated through an upwelling bead filter at 28 °C. Fish were fed twice daily with a scientifically formulated adult diet from the Zebrafish International Resource Center (University of Oregon, Eugene, OR, USA) and supplemented once daily with live Artemia larvae grown from cysts (Bio-Marine, Hawthorne, CA). The filter system was back flushed weekly. The photoperiod was set at 14 h light: 10 h dark.
Sperm samples were collected from male zebrafish after anesthetization in a 0.01 % (v/v) tricaine methanesulfonate (MS-222 Western Chemical Inc., Ferndale, WA) solution. The fish was placed ventral side up in a foam rubber holder and blotted dry. Gentle pressure was applied to the sides of the abdomen in an anterior to posterior direction under a dissecting microscope (10-x magnification). Sperm were collected using a micropipette and suspended in a microcentrifuge tube containing 20 µL of HBSS at an osmolality of 300 mOsm/kg (Yang et al. 2007). The fish was returned to aquarium water for recovery. Fish were allowed at least a two-week period between sperm collections to ensure sufficient sperm production. Sperm from several zebrafish were pooled into a single sample to yield an adequate volume for analysis. Sperm concentration was determined in a microspectrophotometer (NanoDrop 1000, Thermo Scientific, Wilmington, DE) by measuring the absorbance of a 1.5-µL sample at 400 nm (Tan et al. 2010). The sperm concentration was adjusted using HBSS to≈1.0×10⁸ cells/mL as it was reported being reliable for CASA measurements of zebrafish sperm (Verstegen et al. 2002).
2.5 Zebrafish sperm cell activation and analysis
Manual activation tests (n=6) were performed by a trained technician with ~25 h of cell activation experience, which in our laboratories has been sufficient to attain competency in the technique. Manual activation was achieved by pipetting 2 µL of sperm sample onto a glass slide, followed by addition of 4 µL of de-ionized (DI) water. The two solutions were gently stirred for approximately 5 s with a pipette tip. The mixture was pipetted underneath a coverslip on top of a 20-µm well slide (Hamilton Thorne, Beverly, MA) where motility was measured via CASA.
For on-chip activation (n=3), sperm cells in HBSS and DI water were loaded into separate syringes. Flow was driven by a syringe pump with a maintained flow rate at each inlet of 1 µL/min, corresponding to a Reynolds number of 1 at the 200 µm wide outlet of the mixer. With the two sheath inlets containing DI water and the sample inlet containing cells and 300 mOsm/kg HBSS. The same dilution ratio (2:1) was maintained for both manual activation and on-chip activation experiments, allowing a meaningful direct comparison. After a steady flow was achieved, the solenoid valves were actuated and the syringe pump was switched off simultaneously; CASA was started 5 s later. For CASA, the microscope was positioned at the entrance to the viewing chamber, immediately adjacent to the end of the micromixer.
Motility was analyzed with an open CASA system (CEROS model, Hamilton Thorne, Beverly, MA) under tungsten filament illumination using 10-x magnification. A CCD camera captured negative phase-contrast images from a light microscope (CX-41 Olympus American Corp, Center Valley, CA) that were saved in the CEROS motility program (Animal Motility, Version 12.3 K Build 003). The image acquisition rate was 60Hz. The minimum cell count was set at 50 and the minimum cell size was set at 2 pixels. The smoothed path velocity (VAP) cutoff for progressively motile sperm was set at 50 µm/sec, and for static cells was set at 20 µm/sec, based on reported parameters for similar species (Park et al. 2011; Yang and Tiersch 2011).
2.6 Numerical methods
The three-dimensional continuity equation, conservation of momentum, and species conservation equation (Eqs. (2–6)) were solved using the finite volume method in the commercial software ANSYS Fluent v. 13.0 (ANSYS Inc., Canonsburg, PA).
| (2) |
| (3) |
| (4) |
| (5) |
| (6) |
In Eqs. (2–6): ρ is the fluid density, u is the fluid velocity, p is the fluid pressure, g is the acceleration due to gravity, µ is the fluid viscosity, Ci is the concentration of species I, and Dab is the species diffusivity.
Lagrangian particle tracking (Eqs. (7–9)) was performed for a collection of passive spherical particles (representing idealized sperm cells) released from each finite volume face on the sample inlet. At each particle time step, the local osmolality (that of the finite volume element that the particle is inside) was saved. Inside a micromixer operating under steady-state conditions, the extracellular concentration of a salt is a function of spatial position throughout the mixer. However, by tracking sperm cells traveling through the channel in a Lagrangian framework, the extracellular salt concentration can be re-parameterized as a function of time. During the Lagrangian particle iterations, the particle time-step was maintained at 0.001 s for stability of the numerical method.
| (7) |
| (8) |
| (9) |
In Eqs. (7–9): FD is the drag force on the particle, uf is the fluid velocity, up is the particle velocity, g is the acceleration due to gravity, ρp is the particle density, ρf is the fluid density, CD is the drag coefficient for spherical particles, Rep is the Reynolds number of the particle, and dp is the particle diameter.
A mathematical description of solute and solvent transport across a cellular membrane exists in the widely used Kedem-Katchaslsky model (Kedem and Katchalsky 1961; Kleinhans 1998; Gilmore et al. 1995). The model describes passive, coupled solvent and solute flux through the membrane with three phenomological parameters: the hydraulic conductivity (Lp), the solute permeability (Ps), and the reflection coefficient (σ). The two ordinary differential equations are coupled and non-linear, but are solved readily with any number of computational mathematics packages. In the absence of a membrane penetrating solute, the model simplifies to Eq. (10).
| (10) |
In Eq. (10): Vw is intracellular water volume, Lp is hydraulic conductivity of the membrane, Ac is the cell’s surface area, R is the universal gas constant, T is absolute temperature, is the extracellular salt concentration, and is the intracellular salt concentration.
The transient extracellular osmolality from the Lagrangian particle trackingwas input into Eq. (10). This equation was solved for each simulated sperm cell traveling through the mixer, each with a different transient extracellular osmolality. The water flux equation was solved using a 4th order Runge–Kutta method in MATLAB (MathWorks, Natick, MA).
For model closure, several corollary equations (Eqs. (11–13)) were necessary to complete the model.
| (11) |
| (12) |
| (13) |
In Eqs. (11–13): Vb is the osmotically inactive cell volume, and Vcell is the total cell volume. A solution of these equations can provide insight into the intracellular dynamics during sperm cell activation. Assuming purely passive transport and given a set of known intracellular ion concentrations, each ion concentration can be monitored as a function of time and extracellular environment. With a set of known initial intracellular ion concentrations, passive dilution of the intracellular environment results in the following dynamics for any intracellular ion:
| (14) |
The primary assumptions of this model are: transport across the membrane is purely passive; the sperm cell volume fraction is sufficiently small to ignore hydrodynamic particle-particle interactions; and, once sperm cells are activated inside the micromixer, their swimming does not have any appreciable effect on the spatial HBSS field inside the mixer. While this model only accounts for passive osmotic water transport, active transport of ions through membrane pumps is possible; however, active transport is thought to have little effect on volume regulation of sperm cells (Takai and Morisawa 1995).
3 Results and discussion
3.1 Numerical model validation of passive cellular water transport
The simulations have previously been validated with respect to mixing in the micromixer, showing good agreement over a wide range of Reynolds numbers (Scherr et al. 2012). This gives confidence that the osmolality distribution inside the microdevice, which is used as an input to the membrane transport model, is accurately captured.
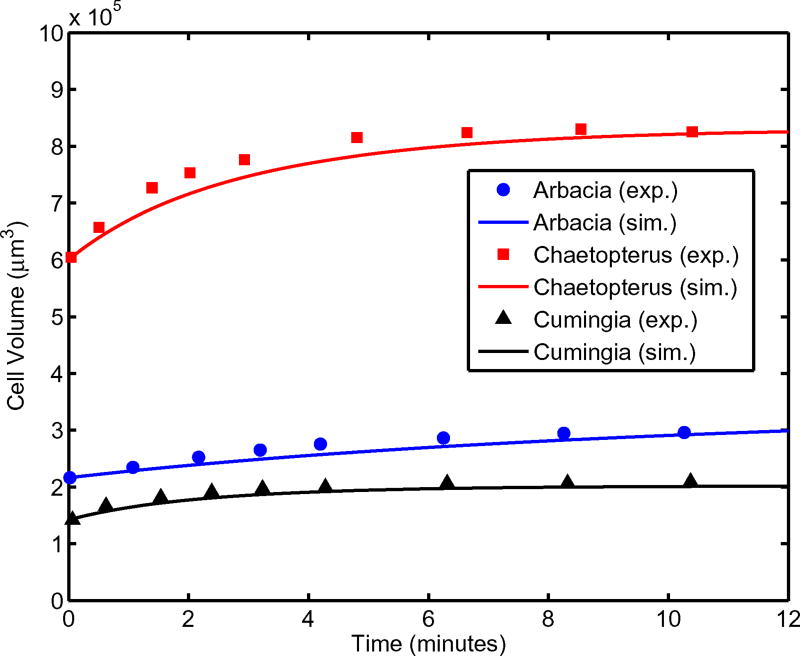
Here, we validate passive water transport across the cellular membrane for three different sets of parameters. It should be noted that the hydraulic conductivity of zebrafish spermatozoa is an order of magnitude lower than the egg cells used in this validation (shown in Table 1). Figure 2 shows the osmotic response of Arbacia, Chaetopterus, and Cumingia cells. The cells are moved from seawater to 60 % seawater at time t=0 s and as a result of the hypoosmotic environment, water enters the cell. Although the model consistently underestimates the experimental results, there is never greater than 6.71 % error for any of the three cell types. The maximum deviation for each dataset is: 4.60 % (Chaetopterus), 5.05 % (Cumingia), and 6.71 % (Arbacia). This validates the implementation and accuracy of the water flux equation.
Table 1.
Table of water transport model parameters
| Model Parameter | Cell | Value (units) |
|---|---|---|
| Hydraulic Conductivity | Arbacia egg (Luck et al. 1939) | 2×10⁻² (pm / Pa*s) |
| Chaetopterus egg (Luck et al. 1939) | 7.22×10⁻² | |
| Cumingia egg (Luck et al. 1939) | 6.33×10⁻² | |
| Zebrafish spermatazoa (Hagedorn et al. 2009) | 3.454×10⁻³ | |
| Isoosmotic Cell Volume | Arbacia egg | 2.1635×10⁵ (µm3) |
| Chaetopterus egg | 6.0439×10⁵ | |
| Cumingia egg | 1.4208×10⁵ | |
| Zebrafish spermatazoa | 12.1 | |
| Osmotically Inactive Volume | Arbacia egg | 2.72×10⁴ (µm3) |
| Chaetopterus egg | 2.53×10⁵ | |
| Cumingia egg | 5.2×10⁴ | |
| Zebrafish spermatazoa | 4.477 |
Fig. 2.
Water transport validation plots for Arbacia, Chaetopterus, and Cumingia cells. Experimental data taken from (Luck et al. 1939)
3.2 Solenoid valve characterization and particle residence time
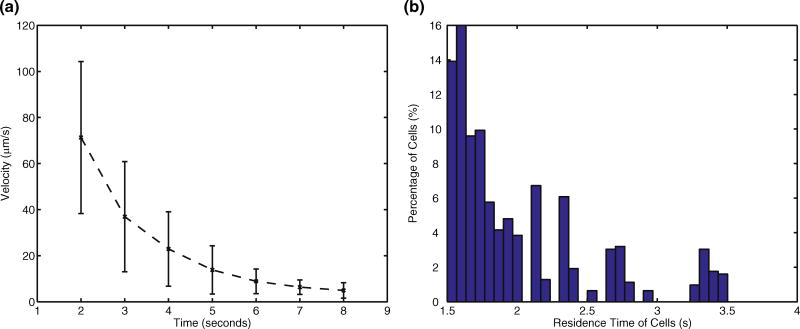
Experimental mixing within this device has previously been studied (Scherr et al. 2012); given the time-sensitive nature of our analysis of zebrafish sperm motility in the microdevice following cell activation, the solenoid valves added for flow cessation were characterized. Figure 3a shows the velocity of 10-µm polystyrene tracer beads in the viewing chamber following valve closure. As a result of the compliance in the PDMS and tubing, actuation of the valves causes an initial acceleration of the tracer beads. With the pressure inside the device equalized, the particle velocities decayed to near zero after approximately 8 s. Based on these results, and given the typical operating parameters of CASA for zebrafish sperm, we chose to initiate CASA after 5 s. At this time, the velocity of tracer beads was on average less than 20 µmper second which is below the cutoff velocity for static cells analyzed with CASA.
Fig. 3.
a Tracer bead velocity after actuation of the solenoid valves (mean +/− std. dev, n=10). b Simulated particle residence time distribution for a population of 625 discrete particles released from the center inlet
Along with the time for velocity to become small enough to start imaging, it was also necessary to analyze the residence time of the particles in the mixer portion of the device. Figure 3b shows the simulated residence time of discrete particles released from each finite volume face at the center inlet. As in our experiments, all inlet flow rates were specified as 1 µL/min. No particles traversed the mixer faster than 1.5 s. Nearly 70 % of the particles had reached the outlet by 2 s, while all particles reached the outlet by 3.5 s. Together with the results from the valve characterization, the cells could have initiated motility between 6.5 and 8.5 s prior to analysis with CASA (1.5–3.5 s residence time, 5 s for flow cessation due to the solenoid valves).
This is likely an over-estimation of the time for the cells to be activated and for analysis to begin. When the solenoid valves were actuated they accelerated particles; the time cells or particles spent in the channel (the residence time) and the time for flow cessation did not necessarily occur sequentially – these coincided with one another. It is possible that after actuation of the valves, particles near the inlets of the device were accelerated through the device and came to rest in the viewing chamber. Therefore the reported time period of motility that is initially missed, between 6.5 and 8.5 s, should be treated as a maximum. Even still, this is faster than hand activation via manual mixing, which is discussed below. This is also faster than previously reported microfluidic sperm cell activation without the use of valving (Park et al. 2012). In that study, a 10 s delay was required between turning off the syringe pump and initiating CASA so as to minimize bulk fluid drift.
3.3 Manual and microfluidic zebrafish sperm activation
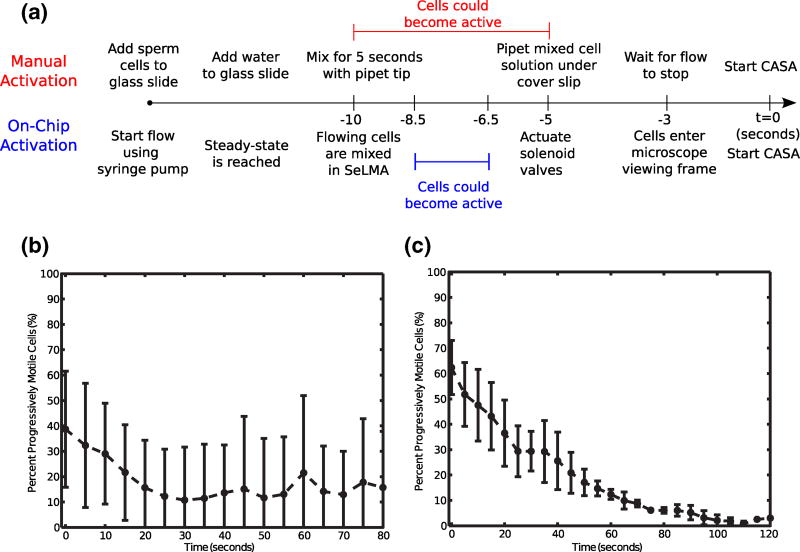
The traditional method of activating zebrafish sperm cells by manual dilution was compared to on-chip activation using the SeLMA micromixer. Care was taken to monitor the manual activation protocol from a trained technician to determine the sequence and timing of events such as manual addition of water to the sperm sample, pipet tip mixing, and sample insertion under the coverslip. As such on-chip experimental protocols in this study were designed to initiate CASA at the same time post-activation as manual mixing (timeline shown in Fig. 4a). However, there is still potential for a time discrepancy, which in our estimation is approximately 1–2 s, between when cells become active using manual mixing and microfluidic mixing. This small discrepancy is expected to have minimal effect on the comparison of the two activation methods.
Fig. 4.
a A timeline of cell activation events. b Manual zebrafish sperm cell activation (n=6). c On-chip zebrafish sperm cell activation (n=3)
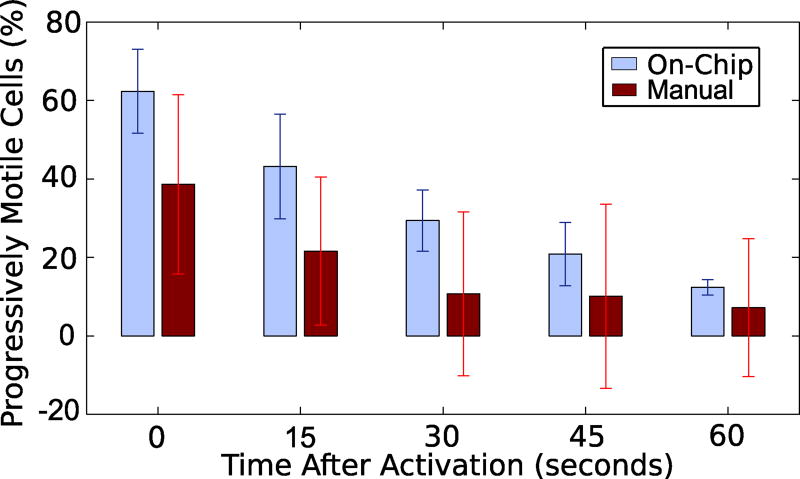
Manual (hand-mixing) activation, (Fig. 4b), shows an initial motility of ~40 % and there was only a slight decrease in motility over time. This initial motility was lower than in other studies of zebrafish sperm cell activation and the decay in motility over time is not as pronounced (Wilson-Leedy et al. 2009). The lower initial motility is likely due to the difference in dilution ratios and imperfect hand-mixing; the referenced study used a 20:1 dilution whereas we used a 2:1 dilution. This ratio for manual mixing was chosen to agree with conditions inside of the microfluidic channel, where equal flow rates from all inlets provide a 2:1 dilution. However, this level of activation is consistent with other work that tested a range of osmolalities of the activating solution, and found similar values at 150 mOsm/kg (Takai and Morisawa 1995). Figure 4b shows standard deviations over 50 % for much of the motility period. The less pronounced decrease in motility over time and the high variability among trials is likely a result of the poorly reproducible hand-mixing. In a poorly mixed solution, significant diffusion would still occur throughout the duration of the experiment. This would result in a delay in the onset of motility as cells encounter the necessary hypoosmotic environment at different times.
The on-chip activation (Fig. 4c) shows an initially higher percentage of progressively motile cells. While it is likely that hand-mixed samples also display higher percentages of cell motility initially (Fig. 4b), assessment of these initial periods are difficult without the microfluidic chip approach. Progressive motility of on-chip activated sperm also decreases, reaching near zero at 100 s. Deviations between trials were initially high (16 % variation initially), but it decreased to less than 2 % after 60 s. This indicates that the mixer was more effectively mixing the fluid and most cells that would ultimately activate more rapidly encountered conditions that would allow them to become motile.
The on-chip activation data was compared to the manual hand mixing data for statistical significance using the Student’s T-Test (α=0.05). There is no statistically significant difference between the on-chip and manual activation at any of the times shown in Fig. 5. This is reasonably expected, given the large deviations with the manual activation data. To this point, there was no statistically significant difference between the initial progressively motile cell count (manually activated, t=0) and the progressively motile cell count (manually activated) at any of the times tested in Fig. 5.
Fig. 5.
Statistical analysis of on-chip and manual activation
3.4 Simulations of zebrafish sperm cell activation in a constant hypoosmotic environment
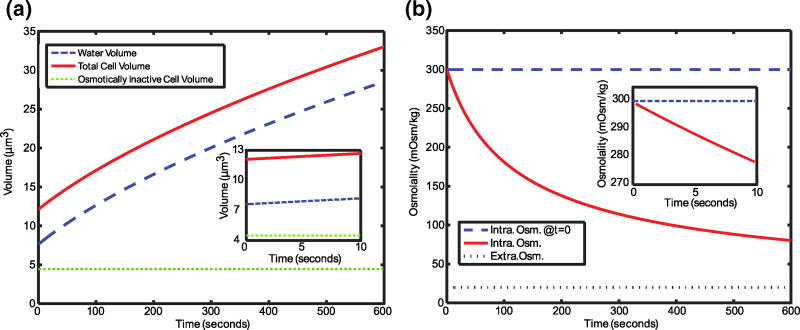
We simulated the water flux across a zebrafish sperm cell membrane during manual activation. The cells start at 300 mOsm/kg and were placed in a constant 20 mOsm/kg environment and consequently water enters the cell. Figure 6a shows an increase in cell volume that does not reach equilibrium after 600 s, a result of the low hydraulic conductivity of zebrafish sperm cells. The low hydraulic conductivity is necessary for a cell whose purpose it to fertilize an egg in a hypoosmotic environment. The time that it would take for critically damaging water intake must be greater than the duration of motility for external fertilization to be successful.
Fig. 6.
Simulations of a zebrafish sperm cell placed in 20 mOsm/kg water. a Passive water flux as a result of the hypoosmotic environment. b The intracellular osmolality as a result of the hypoosmotic environment. Insets show the dynamics during the first 10 s
Figure 6b shows the decrease in intracellular osmolality; after 10 s (Fig. 6b inset), the intracellular osmolality has decreased only to 278.6 mOsm/kg. This response is for cells placed in 20 mOsm/kg for 10 s – a reasonable time to complete hand mixing and begin inspection of cells using CASA.
3.5 Simulated zebrafish sperm cell activation in a micromixer
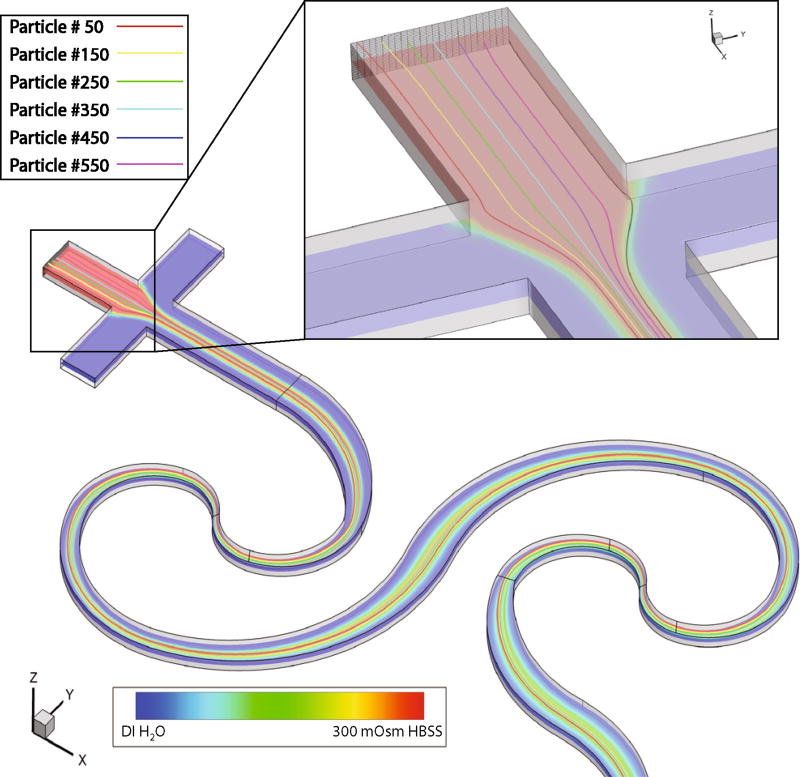
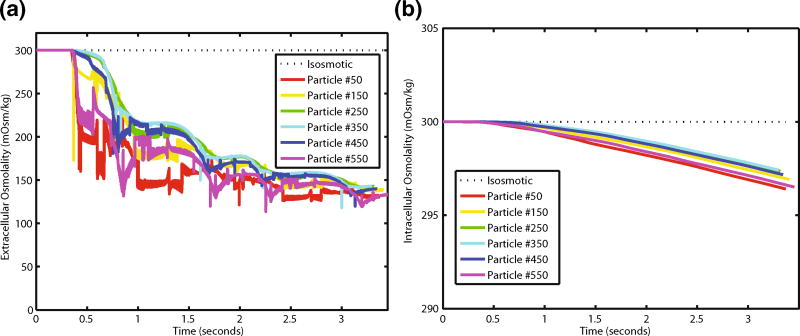
In batch investigations, it can be assumed that the extracellular environment is held at a constant osmolality. This does not hold true in a micromixer where spatial variations occur (Fig. 7). To account for this, in our simulations we release cells (inert spherical particles) from each finite volume face at the center inlet (Fig. 7 Inset). Each cell traveled through the device with its own spatial path, and encounters a unique extracellular osmotic environment along its way (particle numbers shown in Fig. 7 correspond to the same numbers shown in Fig. 8). The extracellular osmolality fluctuated as cells moved through the mixer, entering regions of high and low osmolality, and eventually reaching a constant extracellular environment at the outlet.
Fig. 7.
Simulated particle trajectories and mixing in the first half of the SeLMA geometry. Inset shows the introduction point for select particles
Fig. 8.
a Simulated extracellular osmolalities for select cells as a function of time spent in the mixer. b Simulated intracellular osmolalities as a function of time in the mixer
Despite these cells encountering zones of extracellular osmolality that are half of their initial intracellular osmolality (Fig. 8a), water flux across the membrane is slow and their residence time in these low osmolality zones is brief until they reach the completely mixed environment at the outlet. Intracellular osmolality begins at iso-osmotic conditions (300 mOsm/kg), and for the select cells shown in Fig. 8b, only reduced by 2–4 mOsm/kg. Particularly of note, the different extracellular osmotic histories (Fig. 8a) all lead to similar transient intracellular osmolality profiles (Fig. 8b).
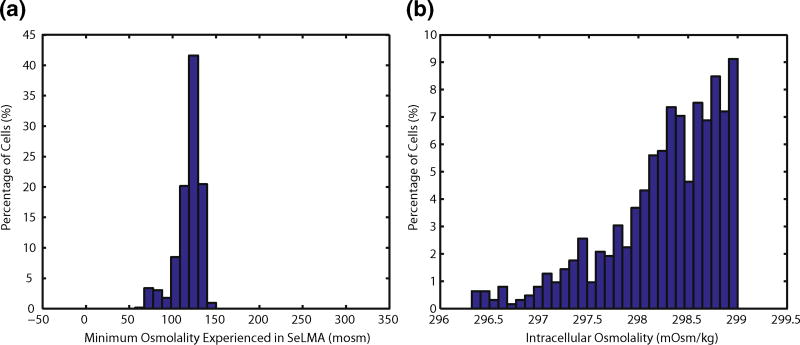
While individual cell trajectories and transient profiles were useful, it was helpful to visualize the results for the entire population of cells. The minimum osmolality that the cells come in contact with as theymove through the mixer is shown in Fig. 9a. All cells travel through a zone with osmolality less than 150 mOsm/kg, and nearly 10 % pass through a region of less than 100 mOsm/kg. Despite the extracellular osmolality being hypoosmotic for the duration of each cell’s residence time, simulated intracellular osmolalities at the outlet ranged from 299 to 296.5 mOsm/kg (down from 300 mOsm/kg at the inlet), as shown in Fig. 9b. This highlights the low hydraulic permeability and slow water transport across the membrane. Despite these small changes in intracellular osmolality, our experimental evidence shows that under these same conditions, greater than 60 % of the cells that passed through the mixer were activated. This challenges the belief that large changes in osmolality or ion concentration are necessary for activation (Takai and Morisawa 1995).
Fig. 9.
Histograms of simulated variables for the population of cells as they travel through the mixer: a minimum osmolality each cell experienced during transit, b the cells’ intracellular osmolality at the outlet
4 Conclusions
In this work, we have shown two methods for analysis of the activation process of zebrafish sperm cells. The microfluidic mixer allows for a highly reproducible mixing of the fluid streams, and hence a highly reproducible dilution of the cells’ intracellular osmolality. This is a significant advancement over the field-standard hand-mixing where variability was large and analysis suffered from a lack of reproducibility. This approach is also an improvement over the only other reported microfluidic device for aquatic sperm cell activation (Park et al. 2012): the off-chip valves enable a more rapid cessation of flow prior to initiation of CASA; the SeLMA micromixer geometry used herein has no protrusions or obstacles that could capture cells as in the previous micromixer utilized for this purpose; and the specialized glass slides that contained the cells in a confined area for visualization are no longer needed due to the on-chip viewing chamber in the integrated device presented in this study. Finally, the numerical analysis sheds insight on the intracellular environment, which is a function of the extracellular osmotic conditions and the path travelled through the microfluidic device. Experimental methods for assessing sperm cell volume would not be feasible in this case: microscopic observation of cell diameter is limited to a static field of view, and at the magnifications necessary for accurate sizing, cannot track individual cells throughout the entire microchannel; cell volume analysis via flow cytometry would be a post-hoc approximation of the conditions inside the micromixer. Through the use of validated simulations, we access instantaneous cell information during this dynamic process. While the numerical parameters and experimental conditions used in this study are specific to zebrafish sperm cells, they could easily be modified to study any similarly functioning cell.
Our experimental results show that over 60 % of cells were activated initially, and under those same conditions, the numerical model shows that only a small amount of water has entered the cell. As a result of this osmotic transport, intracellular osmolality, and hence any intracellular ion, only decreases slightly. While experimental protocols seek to immerse the cells in as dilute an environment as possible, our results are the first to demonstrate that even brief exposure to a hypoosmotic environment is sufficient for activation. Further work is necessary to identify an exact threshold of intracellular osmolality for zebrafish sperm activation, which will allow for a better understanding of the intracellular cascade that initiates and maintains motility.
We envision microfluidic devices for the activation of aquatic sperm cells overcoming several hurdles in sperm cell activation studies. These have the potential to improve cryopreservation protocols significantly by allowing high-throughput testing of different cryopreserved samples under highly controlled conditions, including activation with different extracellular osmolalities which can easily be manipulated by tuning the sample to sheath flow rate ratio. This work also serves as a potential for much-needed standardization; both the microfluidics and numerical methods used herein are robust and can be used to reduce the variability within and across aquatic sperm research laboratories.
Supplementary Material
Acknowledgments
The authors would like to acknowledge Dr. Huiping Yang at the LSU AgCenter Aquatic Germplasm and Genetic Resources Center for instruction on manual sperm cell activation. We acknowledge support from the National Science Foundation (NSF) ARIR2 programgrantCMMI-0963482 and National Institutes of Health grant 5R24OD010441. Thomas Scherr received support from the NSF Computational Fluid Dynamics IGERT at Louisiana State University, and a Coates Scholar Research Grant at Louisiana State University.
Footnotes
Electronic supplementary material The online version of this article (doi:10.1007/s10544-015-9957-6) contains supplementary material, which is available to authorized users.
References
- Bray D, Bourret RB, Simon MI. Computer simulation of the phosphorylation cascade controlling bacterial chemotaxis. Mol. Biol. Cell. 1993;4(5):469. doi: 10.1091/mbc.4.5.469. [DOI] [PMC free article] [PubMed] [Google Scholar]
- Cho BS, Schuster TG, Zhu X, Chang D, Smith GD, Takayama S. Passively driven integrated microfluidic system for separation of motile sperm. Anal. Chem. 2003;75(7):1671–1675. doi: 10.1021/ac020579e. [DOI] [PubMed] [Google Scholar]
- Cosson J. The ionic and osmotic factors controlling motility of fish spermatozoa. Aquac. Int. 2004;12(1):69–85. [Google Scholar]
- Dreanno C, Cosson J, Suquet M, Seguin F, Dorange G, Billard R. Nucleotide content, oxydative phosphorylation, morphology, and fertilizing capacity of turbot (Psetta maxima) spermatozoa during the motility period. Mol. Reprod. Dev. 1999;53(2):230–243. doi: 10.1002/(SICI)1098-2795(199906)53:2<230::AID-MRD12>3.0.CO;2-H. [DOI] [PubMed] [Google Scholar]
- Fleming KK, Longmire EK, Hubel A. Numerical Characterization of Diffusion-Based Extraction in Cell-Laden Flow Through a Microfluidic Channel. J. Biomech. Eng. 2007;129(5):703. doi: 10.1115/1.2768373. [DOI] [PubMed] [Google Scholar]
- Friedrich BM, Julicher F. Chemotaxis of sperm cells. Proc. Natl. Acad. Sci. 2007;104(33):13256–13261. doi: 10.1073/pnas.0703530104. [DOI] [PMC free article] [PubMed] [Google Scholar]
- Gilmore JA, McGann LE, Liu J, Gao DY, Peter AT, Kleinhans FW, Critser JK. Effect of cryoprotectant solutes on water permeability of human spermatozoa. Biol. Reprod. 1995;53(5):985–995. doi: 10.1095/biolreprod53.5.985. [DOI] [PubMed] [Google Scholar]
- Hagedorn M, Ricker J, McCarthy M, Meyers SA, Tiersch TR, Varga ZM, Kleinhans FW. Biophysics of zebrafish (Danio rerio) sperm. Cryobiology. 2009;58(1):12–19. doi: 10.1016/j.cryobiol.2008.09.013. [DOI] [PMC free article] [PubMed] [Google Scholar]
- Henslee EA, Sano MB, Rojas AD, Schmelz EM, Davalos RV. Selective concentration of human cancer cells using contactless dielectrophoresis. Electrophoresis. 2011;32(18):2523–2529. doi: 10.1002/elps.201100081. [DOI] [PubMed] [Google Scholar]
- Kedem O, Katchalsky A. A physical interpretation of the phenomenological coefficients of membrane permeability. J. Gen. Physiol. 1961;45:143–179. doi: 10.1085/jgp.45.1.143. [DOI] [PMC free article] [PubMed] [Google Scholar]
- Kleinhans FW. Membrane permeability modeling: Kedem–Katchalsky vs a two-parameter formalism. Cryobiology. 1998;37(4):271–289. doi: 10.1006/cryo.1998.2135. [DOI] [PubMed] [Google Scholar]
- Lieschke GJ, Currie PD. Animal models of human disease: zebrafish swim into view. Nat. Rev. Genet. 2007;8(5):353–367. doi: 10.1038/nrg2091. [DOI] [PubMed] [Google Scholar]
- Luck B, Hartline HK, Ricca RA. Comparative permeability to water and to certain solutes of the egg cells of three marine invertebrates, Arbacia, Cumingia and Chaetopterus. J. Cell. Comp. Physiol. 1939;14(2):237–252. [Google Scholar]
- Morisawa M, Suzuki K. Change in intracellular K+ concentration caused by external osmolality change regulates sperm motility of marine and freshwater teleosts. J. Cell Sci. 1980;210(4474):1145–1147. doi: 10.1242/jcs.108.3.1175. [DOI] [PubMed] [Google Scholar]
- Morisawa M, Suzuki K, Shimizu H, Morisawa S, Yasuda K. Effects of osmolality and potassium on motility of spermatozoa from freshwater cyprinid fishes. J. Exp. Biol. 1983;107(1):95–103. doi: 10.1242/jeb.107.1.95. [DOI] [PubMed] [Google Scholar]
- Oda S, Morisawa M. Rises of intracellular Ca2+ and pH mediate the initiation of sperm motility by hyperosmolality in marine teleosts. Cell Motil. Cytoskeleton. 1993;25(2):171–178. doi: 10.1002/cm.970250206. [DOI] [PubMed] [Google Scholar]
- Olson SD, Suarez SS, Fauci LJ. A Model of CatSper Channel Mediated Calcium Dynamics in Mammalian Spermatozoa. Bull. Math. Biol. 2010;72(8):1925–1946. doi: 10.1007/s11538-010-9516-5. [DOI] [PubMed] [Google Scholar]
- Park DS, Quitadamo C, Tiersch TR, Monroe WT. Microfluidic Mixers for Standardization of Computer-Assisted Sperm Analysis. In: Tiersch TR, Green CC, editors. Cryopreservation in Aquatic Species. 2. Vol. 19. World Aquaculture Society; Baton Rouge: 2011. pp. 261–272. [Google Scholar]
- Park DS, Egnatchik RA, Bordelon H, Tiersch TR, Monroe WT. Microfluidic mixing for sperm activation and motility analysis of pearl Danio zebrafish. Theriogenology. 2012;78(2):334–344. doi: 10.1016/j.theriogenology.2012.02.008. [DOI] [PMC free article] [PubMed] [Google Scholar]
- Ricart BG, Yang MT, Hunter CA, Chen CS, Hammer DA. Measuring Traction Forces of Motile Dendritic Cells on Micropost Arrays. Biophys. J. 2011;101(11):2620–2628. doi: 10.1016/j.bpj.2011.09.022. [DOI] [PMC free article] [PubMed] [Google Scholar]
- Scherr T, Quitadamo C, Tesvich P, Park DS-W, Tiersch T, Hayes D, Choi J-W, Nandakumar K, Monroe WT. A planar microfluidic mixer based on logarithmic spirals. J.Micromech. Microeng. 2012;22(5):055019. doi: 10.1088/0960-1317/22/5/055019. [DOI] [PMC free article] [PubMed] [Google Scholar]
- Scherr T, Pursley S, Monroe WT, Nandakumar K. A numerical study on distributions during cryoprotectant loading caused by laminar flow in a microchannel. Biomicrofluidics. 2013;7(2):024104. doi: 10.1063/1.4793714. [DOI] [PMC free article] [PubMed] [Google Scholar]
- Seo D-B, Agca Y, Feng ZC, Critser JK. Development of sorting, aligning, and orienting motile sperm using microfluidic device operated by hydrostatic pressure. Microfluid. Nanofluid. 2007;3(5):561–570. [Google Scholar]
- Song YS, Moon S, Hulli L, Hasan SK, Kayaalp E, Demirci U. Microfluidics for cryopreservation. Lab Chip. 2009;9(13):1874–1881. doi: 10.1039/b823062e. [DOI] [PMC free article] [PubMed] [Google Scholar]
- Squires TM, Quake SR. Microfluidics: Fluid physics at the nanoliter scale. Rev. Mod. Phys. 2005;77(3):977–1026. [Google Scholar]
- Stone HA, Stroock AD, Ajdari A. Engineering flows in small devices. Annu. Rev. Fluid Mech. 2004;36:381–411. [Google Scholar]
- Takai H, Morisawa M. Change in intracellular K+ concentration caused by external osmolality change regulates sperm motility of marine and freshwater teleosts. J. Cell Sci. 1995;108(3):1175–1181. doi: 10.1242/jcs.108.3.1175. [DOI] [PubMed] [Google Scholar]
- Tan E, Yang H, Tiersch TR. Determination of sperm concentration for small-bodied biomedical model fishes by use of microspectrophotometry. Zebrafish. 2010;7(2):233–240. doi: 10.1089/zeb.2010.0655. [DOI] [PMC free article] [PubMed] [Google Scholar]
- Tasoglu S, Safaee H, Zhang X, Kingsley JL, Catalano PN, Gurkan UA, Nureddin A, Kayaalp E, Anchan RM, Maas RL, Tüzel E, Demirci U. Exhaustion of Racing Sperm in Nature-Mimicking Microfluidic Channels During Sorting. Small. 2013 doi: 10.1002/smll.201300020. [DOI] [PMC free article] [PubMed] [Google Scholar]
- Verstegen J, Iguer-Ouada M, Onclin K. Computer assisted semen analyzers in andrology research and veterinary practice. Theriogenology. 2002;57(1):149–179. doi: 10.1016/s0093-691x(01)00664-1. [DOI] [PubMed] [Google Scholar]
- Wilson-Leedy JG, Ingermann RL. Development of a novel CASA system based on open source software for characterization of zebrafish sperm motility parameters. Theriogenology. 2007;67(3):661–672. doi: 10.1016/j.theriogenology.2006.10.003. [DOI] [PubMed] [Google Scholar]
- Wilson-Leedy JG, Kanuga MK, Ingermann RL. Influence of osmolality and ions on the activation and characteristics of zebrafish sperm motility. Theriogenology. 2009;71(7):1054–1062. doi: 10.1016/j.theriogenology.2008.11.006. [DOI] [PubMed] [Google Scholar]
- Yang H, Tiersch TR. Application of Computer-assisted Sperm Analysis (CASA) to Aquatic Species. In: Tiersch TR, Green CC, editors. Cryopreservation in Aquatic Species. 2. Vol. 17. World Aquaculture Society; Baton Rouge: 2011. pp. 240–254. [Google Scholar]
- Yang H, Carmichael C, Varga ZM, Tiersch TR. Development of a simplified and standardized protocol with potential for high-throughput for sperm cryopreservation in zebrafish Danio rerio. Theriogenology. 2007;68(2):128–136. doi: 10.1016/j.theriogenology.2007.02.015. [DOI] [PMC free article] [PubMed] [Google Scholar]
Associated Data
This section collects any data citations, data availability statements, or supplementary materials included in this article.


