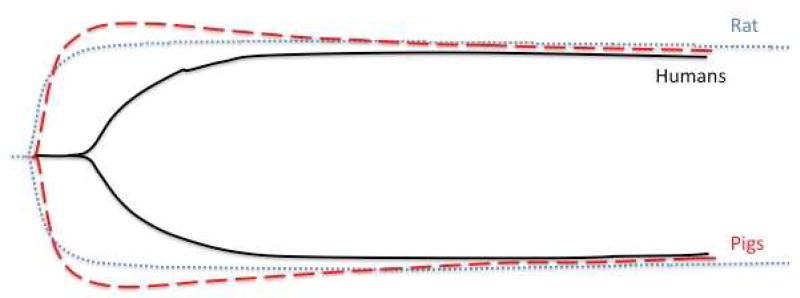
Abstract
Introduction
Thrombelastography (TEG) has been used to characterize the coagulation changes associated with injury and shock. Animal models developed to investigate trauma-induced coagulopathy (TIC) have failed to produce excessive bleeding. We hypothesize that a native TEG will demonstrate marked differences in humans compared to these experimental models, which explains the difficulties in reproducing a clinically relevant coagulopathy in animal models.
Methods
Whole blood was collected from 138 healthy human volunteers, 25 swine and 66 Sprague Dawley rats prior to experimentation. Citrated native TEGs were conducted on each whole blood sample within 2 hours of collection. The clot initiation (R-time, min), angle (degrees), MA (mm), and LY30 (%) were analyzed and contrasted between species with data represented as the median and 25th to 75th quartile range. Difference between species was conducted with a Kruskall Wallis test with alpha adjusted with a Bonferroni correction for multiple comparisons (alpha = 0.016).
Results
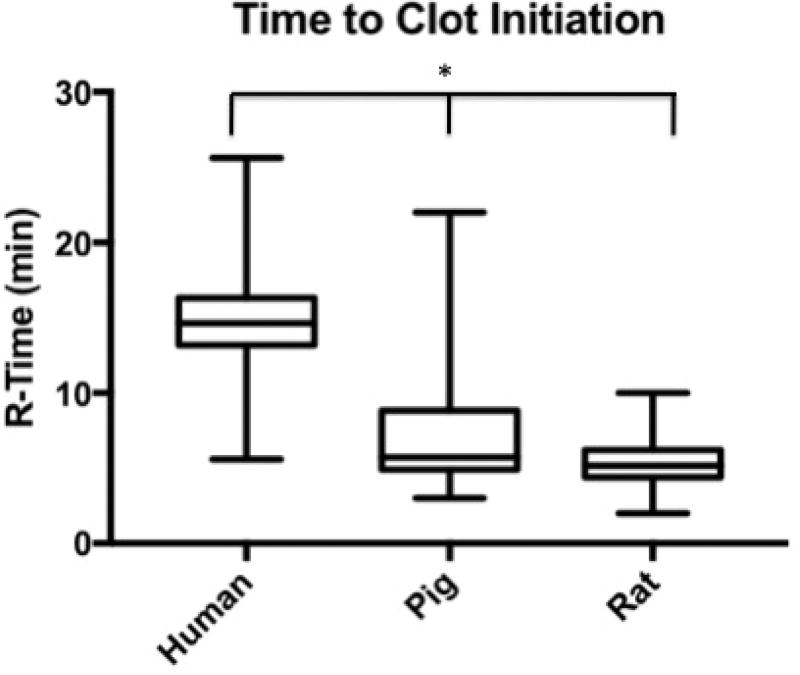
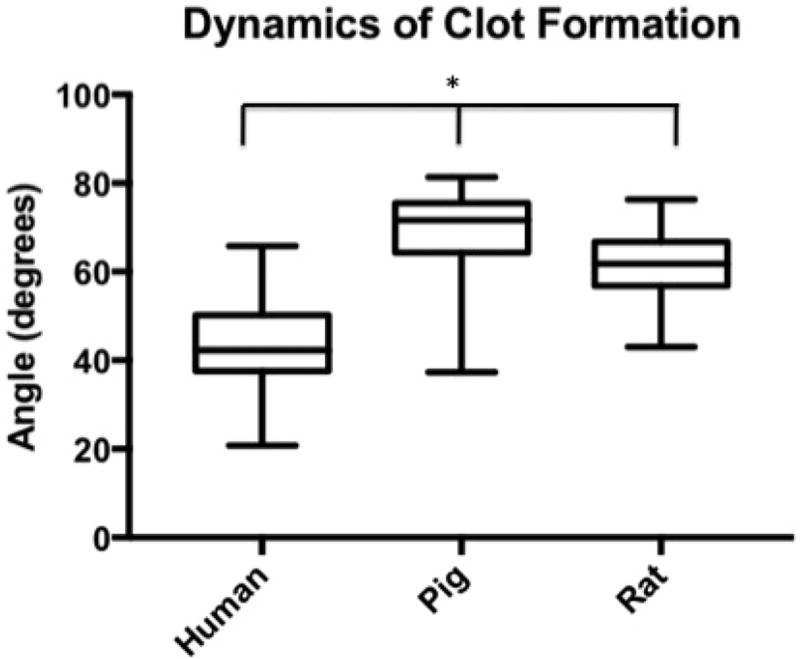
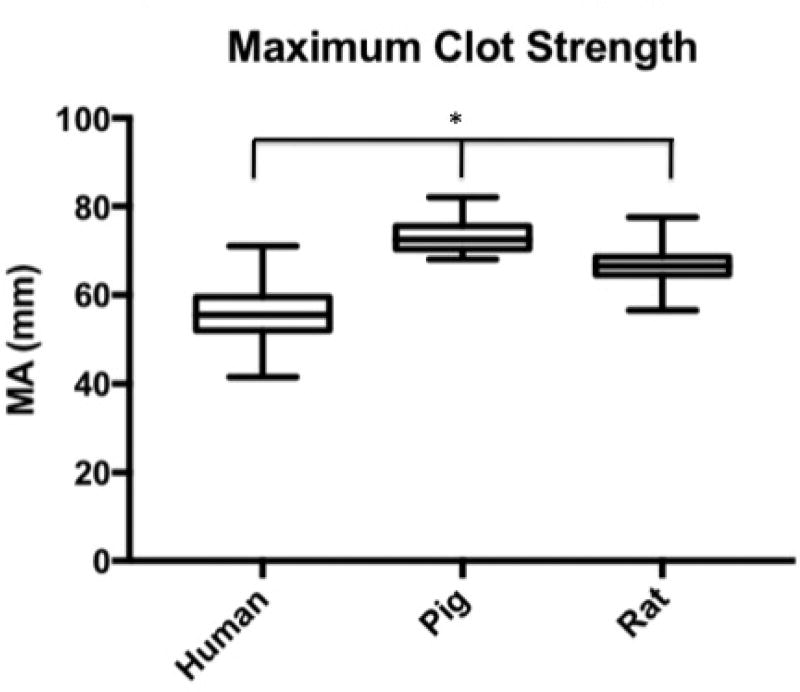
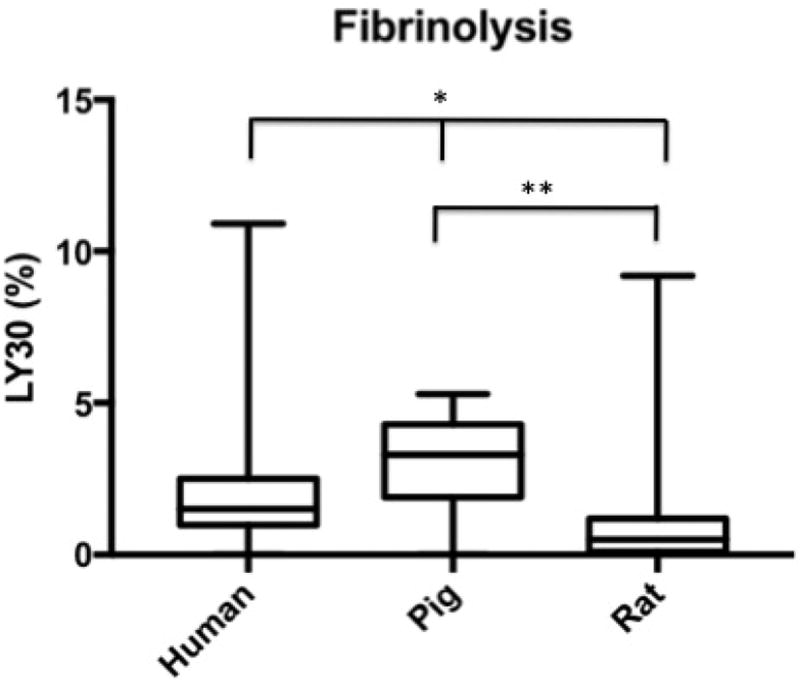
Median R-Time (clot initiation) 14.65 min (IQR: 13.2–16.3 min) for humans, 5.7 (4.9–8.8) for pigs, and 5.2 (4.4–6) for rodents. Humans had longer R-Times than both pigs (p<0.0001) and rats (p<0.0001); pigs were not different from rats (p= 0.4439). Angle (fibrin cross-linking) was 42.3 degrees (IQR: 37.5–50.2) for humans, 71.7 (64.3–75.6) for pigs, and 61.8 (56.8–66.7) for rats. Humans had reduced Angle compared to both pigs (p<0.0001) and rats (p<0.0001); pigs were not different from rats (p=0.6052). MA (clot strength) was 55.5 mm (IQR: 52.0–59.5 for humans, 72.5 (70.4–75.5) for pigs, and 66.5 (56.5–68.6) for rats. Humans had reduced MA compared to both pigs (p<0.0001) and rats (p<0.0001); pigs were not different from rats (p=0.0161). LY30 (fibrinolysis) was 1.5 % (IQR: 0.975–2.5) for humans, 3.3 (1.9–4.3) for pigs, and 0.5 (0.1–1.2) for rats. Humans had a lesser LY30 than pigs (p=0.0062) and a greater LY30 than rats (p<0.0001), and pigs had a greater LY30 than rats (p<0.0001).
Conclusion
Humans, swine, and rodents have distinctly different coagulation systems, when evaluated by citrated native TEG. Animals are hypercoagulable with rapid clotting times and clots strengths nearly 50% stronger than humans. These coagulation differences indicate the limitations of previous models of TIC in producing coagulation abnormalities associated with increased bleeding. The inherent hypercoagulable baseline tendencies of these animals may result in subclinical biochemical changes that are not detected by conventional TEG and should be taken into consideration when extrapolated to clinical medicine.
Keywords: trauma-induced-coagulopathy, thrombelastography, clot initiation, rate of clot formation, clot strength, fibrinolysis
Introduction
Thrombelastography (TEG) based resuscitation compared to conventional laboratory coagulation assays reduces mortality in trauma patients undergoing massive transfusion [1]. The implementation of TEG into clinical practice has been due to the ability to characterize the coagulation changes associated with injury and hemorrhagic shock [2, 3] However, it has been challenging to develop animals that replicate the excessive bleeding observed in seriously injured patients. [4]. This is likely due to inherent differences between human and animal coagulation systems. Previous work has emphasized differences in various coagulation components in animal models in an attempt to define the ideal model that mimics the coagulation profile of humans [5]. Furthermore, rodents are resistant to shock induced fibrinolysis, and the amount of exogenous t-PA to elicit fibrinolysis in whole blood in a rat is 10 fold higher than a human[6].
Viscoelastic assays provide a comprehensive assessment of clot formation and clot remodeling and degradation. There is a paucity of data that contrasts TEG measurements between animal models to human subjects. Therefore, the purpose of this study was to explain the difficulties in reproducing a clinically relevant coagulopathy in animal models through discrepancies between animal and human TEG indices. We hypothesize that a TEGs demonstrate substantial differences in humans compared to animals employed in these experimental models, which underscores the challenges in reproducing a clinically relevant coagulopathy.
Materials and Methods
Materials
Whole blood was collected from 138 healthy human volunteers under the Colorado Multiple Institutional Review Board (COMIRB) protocol number 14-0366. Whole blood was also collected from 25 outbred pigs (Colorado State University farm, Fort Collins, CO) and 66 Sprague Dawley rats (Envigo, Indianapolis, IN) prior to experimentation, through a protocol approved by the University of Colorado Institutional Animal Care and Use Committee (Protocol 90814(11)1D, 90814(12)1D, and 90811(11)1D). Human data were compiled from a database evaluating the normal baseline viscoelastic parameters of healthy volunteers. Pig and rat data were complied from a database of TEGs collected on previously conducted animal experiments. There were no additional animals used for these experiments. The primary outcome was differences in baseline viscoelastic parameters.
Blood Collection
Human blood samples were collected from healthy volunteers after informed consent was obtained. Blood was collected in citrate (3.2%) tubes (Vacutainer, Becton-Dickingson, Franklin Lakes, NJ) following venipuncture of the antecubital fossa. Rat blood was collected after femoral artery cannulation. The process of rat blood collection was done as previously described [7]. Pig blood was similarly collected after femoral artery cut down and cannulation. Rat and pig blood was collected in 3.2% citrate similar to that of human blood. For humans and pigs, blood was collected in a single 3.2% citrate tube. For rats, 900 uL of blood was collected from the femoral artery cannula in 100 uL of sodium citrate in a standardize method as previously reported [7]. All animal studies and procedures were carried out in accordance with University of Colorado University of Colorado Institutional Animal Care and Use Committee guidelines and in accordance with the National Institute of Health guide for care and use of laboratory animals.
Thrombelastography
Citrated whole blood samples were analyzed at 37° C using a Model 5000 Thrombelastograph Haemostasis Analyzer (Haemonetics, Boston, MA) per the manufacturer’s instructions. Native TEG was employed because standard activators, such as tissue factor or kaolin, can mask subtle changes in coagulation [7]. The following parameters were recorded from the temporal impedance tracings of the TEG: R time (min), angle (α, degrees), maximum amplitude (MA, mm), and lysis 30 min after MA (LY30, %). These values were contrasted between species with data represented as the median and 25th to 75th quartile range.
Statistics
Statistics were done using GraphPad Prism version 7.0a (GraphPad Software, Inc; La Jolla, CA) and Excel version 12.2.5 (Microsoft Corporation; Redmond, WA), Citrated native TEG properties (R-time, Angle, MA, LY30) demonstrate a non-normal, skewed distribution. TEG properties were analyzed for differences between species with a nonparametric non-related Kruskall Wallis test with alpha adjusted with a Bonferroni correction for multiple comparisons (alpha = 0.016). The primary outcome analyzed was the difference in the four viscoelastic parameters measured (R-Time, Angle, MA, and LY30)
Results
Citrated Native TEG Properties
Human time to clot initiation (R-Time) was 14.65 min (IQR: 13.2–16.3 min), while animals demonstrated a shorter time with a median R-time of 5.7 (IQR: 4.9–8.8) for pigs, and 5.2 (IQR: 4.4–6.2) for rodents. Humans had longer R-Times than both pigs (p<0.0001) and rats (p<0.0001), and pigs were not statistically different from rats (p= 0.4439) (Figure 1). The rate of clot formation (angle) was significantly more shallow in humans at 42.3 degrees (IQR: 37.5–50.2) as compared 71.7 (IQR: 64.3–75.6) for pigs, and 61.8 (IQR: 56.8–66.7) for rats. Humans demonstrated reduced angle compared to both pigs (p<0.0001) and rats (p<0.0001); while pigs were not statistically different from rats (p=0.6052) (Figure 2). Maximum clot strength (MA) was significantly less in humans at 55.5 mm (IQR: 52.0–59.5) as compared to 72.5 (IQR: 70.4–75.5) for pigs, and 66.5 (IQR: 56.5–68.6) for rats. Humans also had reduced MA compared to both pigs (p<0.0001) and rats (p<0.0001), and pigs were not different from rats (p=0.0161) (Figure 3). LY30 (fibrinolysis) was 1.5 % (IQR: 0.975–2.5) for humans, 3.3 (IQR: 1.9–4.3) for pigs, and 0.5 (IQR: 0.1–1.2) for rats. Humans had a lesser LY30 than pigs (p=0.0062) and a greater LY30 than rats (p<0.0001), and pigs had a greater LY30 than rats (p<0.0001)(Figure 4). The TEG tracings of human, pig, and rat whole blood and illustrates the differences in clot formation and breakdown dynamics of each species are shown in Figure 5. The clot initiation time is more rapid in both pigs and rats, with a greater rate of clot propagation and maximal clot strength. Finally, the TEG tracing reveals different lysis profiles for all three species evaluated
Figure 1.
Box plot of time to clot initiation (R-Time) by citrated native TEG for humans, pigs, and rats. Human time to clot initiation was 14.65 min (IQR: 13.2–16.3 min), while animals demonstrated a shorter time with a median R-time of 5.7 (IQR: 4.9–8.8) for pigs and 5.2 (IQR: 4.4–6.2) for rodents. *=P<0.0001 for humans compared to pigs and rats.
Figure 2.
Box plot of dynamics of clot formation (angle) by citrated native TEG for humans, pigs, and rats. Angle was significantly more shallow in humans at degrees (IQR: 37.5–50.2) as compared 71.7 (IQR: 64.3–75.6) for pigs, and 61.8 (IQR: 56.8–66.7) for rats (*=p<0.0001 for humans compared to both rats and pigs)
Figure 3.
Box plot of the maximum clot strength (MA) by citrated native TEG for humans, pigs, and rats. MA was significantly less in humans at 55.5 mm (IQR: 52.0–59.5) as compared to 72.5 (IQR: 70.4–75.5) for pigs, and 66.5 (IQR: 56.5–68.6) for rats. *=p<0.0001 for humans compared to pigs and rats
Figure 4.
Box plot of the fibrinolysis (LY30) by citrated native TEG for humans, pigs, and rats. LY30 (fibrinolysis) was 1.5 % (IQR: 0.975–2.5) for humans, 3.3 (IQR: 1.9–4.3) for pigs, and 0.5 (IQR: 0.1–1.2) for rats. *=p<0.0062 for humans compared to other species, **=p<0.0001 for pigs compared to rats.
Figure 5.
Representative thrombelastography tracings of the three species evaluated (Human, Pig, and Rat). Both pig and rat have a more rapid clot initiation time, steeper angle, and large maximum clot strength. The pig tracing also shows more fibrinolysis than the other species while the rat has the least amount of fibrinolysis (lowest LY30).
Discussion
The purpose of this study is to define the thrombelastographic differences in animals species commonly used for experimental models of TIC. Our findings demonstrate marked differences in human clotting properties compared to swine and rat citrated native TEG. These data explain the difficulties in reproducing a clinically relevant coagulopathy in animal models due to the significant differences in baseline clotting properties as measure by thrombelastography.
The results demonstrated that healthy humans have a significantly longer time to clot initiation compared to both swine and rats, with swine and rats with similar R-times. Interestingly, the R-time in swine and rats is similar to previously published values of native TEGs for cats [8]. Reported data for both pigs and rats have shown similar prothombin time (PT) and activated thromboplastin time (APTT) compared to humans [5, 9] (Table 1). Furthermore, endogenous thrombin generation in pig and rat models has been shown to be faster than humans, which could explain the difference in R-Time [5]. Humans had a reduced angle in comparison to pigs and rats, while these two animal species were not different from each other. Interestingly fibrinogen levels for pigs and rats are reported to be in the normal reference range of humans [5]. The similar fibrinogen levels do not indicate the cause of reduced angle in humans compared to rats and pigs. However, a possible explanation could be the faster thrombin generation time that could catalyze clot formation in rats and pigs at a much greater rate than humans. MA is most closely correlated to platelet function and fibrinogen level [10]. Both rats and swine had significantly higher MA than humans but were not different from one another (Figure 1). Siller-Matula et al. showed differences in platelet count that could indicate the reason for the difference between rat, swine and human. Rats had significantly higher (six-fold) levels of circulating platelets compared to humans. Similarly, the circulating levels of platelets in pigs were about two-fold higher than humans [5]. In both cases, there is likely a strong contribution of pig and rat relative thrombocytosis in comparison to humans as the explanation to the elevated MA.
Table 1.
Coagulation Parameters of Humans, Pigs, and Rats from Literature
| Species | |||
|---|---|---|---|
| Laboratory Test | Human | Pig | Rat |
| PT (sec) | 13.2 | 11.7 | 26.7 |
| APTT (sec) | 33.8 | 15.5 | 16.5 |
| Platelet Count (G/L) | 187 | 430 | 1,180 |
| Fibrinogen (mg/dL) | 278 | 301 | 209 |
Coagulation parameters of Humans, Pigs, and Rats adapted from review of the literature. Prothrombin time (PT), activated partial thromboplastin time (APTT), and fibrinogen were most commonly reported as mean while platelet count was reported as median. Therefore mean is reported for PT, APTT, and fibrinogen, while median value is used to report platelet count [5, 15–17]
LY30 reflects percent of clot lysis in 30 minutes after MA is attained. Recent data focused on the significance and pathophysiology of elevated LY30, or hyperfibrinolysis, and it’s association with increased mortality in traumatically injured patients [11]. There are three distinct fibrinolysis phenotypes, which included fibrinolysis shutdown, physiologic fibrinolysis, and hyperfibrinolysis, with the most prevalent in injured patients being the fibrinolysis shutdown phenotype [11]. However, while the shutdown phenotype was most prevalent, the mortality was greatest for the hyperfibrinolysis group at almost 44% [11]. Studies have been designed to evaluate the effect of medications such as tranexamic acid (TXA) on early prevention of hyperfibrinolysis and the effect that TXA has referred to as fibrinolysis shutdown [12–14]. Swine had more fibrinolysis at 3.3% and rats with the lowest lysis at 0.5% (Figure 5). This data, as well as previously published results, suggest that given the higher degree of baseline fibrinolysis, as well the similarities in the functional structure of coagulation proteins between humans and pigs, pigs may be a useful animal model to investigate the fibrinolytic pathway and hyperfibrinolysis [5]. However, our experience suggests caution in using pigs as an experimental model when studying fibrinolysis because pigs are highly resistant to tissue plasminogen activator (t-PA)-catalyzed lysis, and have required up to 1200 ng/ml ex vivo at baseline to produce TEG detectable fibrinolysis (data not published) compared to healthy subjects in which 75ng/ml significantly increases LY30 in a native TEG. Similarly, rats also exhibit an innate fibrinolytic shutdown phenotype requiring very high doses of tPA to elucidate lysis on TEG [4].
The ideal experimental model of TIC remains elusive. While swine models of hemorrhagic shock and TIC simulate human coagulation and hemodynamics better than rodents they are hypercoagulable and relatively expensive. Perhaps gene modification of the coagulation proteins may provide an opportunity in the future. Nonhuman primates represent the best approximation at this time , but are logistically prohibitive [18, 19]. Although rats are widely used in coagulation studies, they represent a limited animal model to study TIC [5]. However, rat thrombocytosis may provide an opportunity to modify the coagulation system; i.e. reducing platelets via chemotherapy or antiplatelet therapy. Furthermore, specific aspects of coagulation may be studied in animal models. For example, there are similarities between the functional structure of coagulation proteins in humans and pigs. Cross-species comparison of the proteolytic activity of plasmin activated by the staphylokinase has shown substantial similarities between humans and pigs [20].
Conclusion
There are substantial differences in the TEG-based coagulation profiles of healthy human volunteers, pigs, and rats. In all four TEG parameters studied (R- time, angle, MA, and LY30) humans showed statistically significant differences compared to both rats and pigs. While these data highlight the strengths and weaknesses in these animal models for the study of TIC, they also illustrate the limitations of direct translation of animal models to humans and, therefore, ultimately into the clinical setting.
Acknowledgments
Research reported in this publication was supported by the National Institute Of General Medical Sciences of the National Institutes of Health under Award Number T32 GM008315 and P50 GM049222. The content is solely the responsibility of the authors and does not necessarily represent the official views of the National Institutes of Health. Additional research support was provided by Haemonetics Corporation (Niles, IL). The content is solely the responsibility of the authors and does not necessarily represent the official views of the National Institutes of Health or Haemonetics.
Footnotes
Publisher's Disclaimer: This is a PDF file of an unedited manuscript that has been accepted for publication. As a service to our customers we are providing this early version of the manuscript. The manuscript will undergo copyediting, typesetting, and review of the resulting proof before it is published in its final citable form. Please note that during the production process errors may be discovered which could affect the content, and all legal disclaimers that apply to the journal pertain.
Presented at the Academic Surgical Congress; Las Vegas NV, February 2017
Author Contribution: G.R.S., E.E.M., H.B.M., P.J.L, M.F., G.R.N., C.C.S. and A.B. designed the experiment. G.R.S., H.B.M, P.J.L, and G.R.N performed the analysis of the data. G.R.S., H.B.M, P.J.L, M.F. and G.R.N. performed the acquisition of the data. G.R.S. wrote the manuscript, which all authors critically revised for important intellectual content. All authors approved the final version and agreed to be accountable for all aspects of the work.
Disclosure
The authors do not have any other disclosures.
References
- 1.Gonzalez E, Moore EE, Moore HB, et al. Goal-directed Hemostatic Resuscitation of Trauma-induced Coagulopathy. Annals of Surgery. 2016;263(6):1051–059. doi: 10.1097/SLA.0000000000001608. [DOI] [PMC free article] [PubMed] [Google Scholar]
- 2.Lancé MD. A general review of major global coagulation assays: Thrombelastography, thrombin generation test and clot waveform analysis. Thrombosis Journal. 2015;13:1. doi: 10.1186/1477-9560-13-1. [DOI] [PMC free article] [PubMed] [Google Scholar]
- 3.Brohi K, Singh J, Heron M, Coats T, et al. Acute Traumatic Coagulopathy. The Journal of Trauma: Injury, Infection, and Critical Care. 2003;54(6):1127–130. doi: 10.1097/01.TA.0000069184.82147.06. [DOI] [PubMed] [Google Scholar]
- 4.Parr MJ, Bouillon B, Brohi K, Dutton RP, Hauser CJ, et al. Traumatic coagulopathy: where are the good experimental models? The Journal of trauma. 2008;65:766–771. doi: 10.1097/TA.0b013e31818606d2. [DOI] [PubMed] [Google Scholar]
- 5.Siller-Matula JM, Plasenzotti R, Spiel A, et al. Interspecies differences in coagulation profile. Vol. 100. Thromb Haemost: 2008. pp. 397–404. [PubMed] [Google Scholar]
- 6.Moore HB, Moore EE, Lawson PJ, et al. Fibrinolysis shutdown phenotype masks changes in rodent coagulation in tissue injury versus hemorrhagic shock. Surgery. 2015;158:386–92. doi: 10.1016/j.surg.2015.04.008. [DOI] [PMC free article] [PubMed] [Google Scholar]
- 7.Wohlauer M, Moore EE, Harr JN, et al. A standardized technique for performing Thrombelastography in rodents. Shock. 2011;36:524–6. doi: 10.1097/SHK.0b013e31822dc518. [DOI] [PMC free article] [PubMed] [Google Scholar]
- 8.Banerjee A, Blois SL, Wood RD. Comparing citrated native, kaolin-activated, and tissue factor-activated samples and determining intraindividual variability for feline thrombelastography. J Vet Diagn Invest. 2011;23(6):1109–1113. doi: 10.1177/1040638711425595. [DOI] [PubMed] [Google Scholar]
- 9.Kostering H, Mast WP, Kaethner T, et al. Blood coagulation studies in domestic pigs (Hanover breed) and minipigs (Goettingen breed) Lab Anim. 1983;17:346–349. doi: 10.1258/002367783781062262. [DOI] [PubMed] [Google Scholar]
- 10.Harr JN, Moore EE, Ghasabyan A, et al. Functional fibrinogen assay indicates that fibrinogen is critical in correcting abnormal clot strength following trauma. Shock. 2013;39:45–49. doi: 10.1097/SHK.0b013e3182787122. [DOI] [PMC free article] [PubMed] [Google Scholar]
- 11.Moore HB, Moore EE, Gonzalez E, et al. Hyperfibrinolysis, Physiologic Fibrinolysis, and Fibrinolysis Shutdown. Journal of Trauma and Acute Care Surgery. 2014;77(6):811–17. doi: 10.1097/TA.0000000000000341. [DOI] [PMC free article] [PubMed] [Google Scholar]
- 12.Moore EE, Moore HB, Gonzalez E, et al. Rationale for the selective administration of tranexamic acid to inhibit fibrinolysis in the severely injured patient. Transfusion. 2016;56(suppl 2):S110–S114. doi: 10.1111/trf.13486. [DOI] [PMC free article] [PubMed] [Google Scholar]
- 13.Flint SK, Wood RD, Abrams-Ogg AC, et al. Comparison of Citrated Native and Kaolin-activated Samples for Thrombelastographic Analysis in Healthy Dogs. Veterinary Clinical Pathology. 2012;41(2):249–55. doi: 10.1111/j.1939-165X.2012.00431.x. [DOI] [PubMed] [Google Scholar]
- 14.Shakur H CRASH-2 trial collaborators. Effects of tranexamic acid on death, vascular occlusive events, and blood transfusion in trauma patients with significant haemorrhage. The Lancet. 2010;376(9734):23–32. doi: 10.1016/S0140-6736(10)60835-5. [DOI] [PubMed] [Google Scholar]
- 15.Garcia-Manzano A, Gonzalez-LLaven J, Lemini C, Rubio-Poo C. Standardization of Rat Blood Clotting Tests with Reagents Used for Humans. Proc. West. Pharmacol. Soc. 2001;44:153–155. [PubMed] [Google Scholar]
- 16.Grottke O, Braunschweig T, Henzler D, et al. Effects of different fibrinogen concentrations on blood losss and coagulation parameters in a pig model of coagulopathy with blunt liver injury. Critical Care. 2010;14:R62. doi: 10.1186/cc8960. [DOI] [PMC free article] [PubMed] [Google Scholar]
- 17.Ekser B, Bianchi J, Ball S, et al. Comparison of Hematologic, Biochemical, and Coagulation Parameters in alpha 1,3-galactosyltransferase Gene-knockout Pigs, Wild-type Pigs, and Four Primate Species. Xenotransplantation. 2012;19(6):342–54. doi: 10.1111/xen.12007. [DOI] [PMC free article] [PubMed] [Google Scholar]
- 18.Schaub LJ, Moore HB, Cap AP, Glaser JJ, Moore EE, Sheppard FR. Nonhuman primate model of polytraumatic hemorrhagic shock recapitulates early platelet dysfunction observed following severe injury in humans. Journal of Trauma and Acute Care Surgery. 2017;82(3):461–469. doi: 10.1097/TA.0000000000001343. [DOI] [PMC free article] [PubMed] [Google Scholar]
- 19.Macko AR, Moore HB, Cap AP, Meledeo MA, Moore EE, Sheppard FR. Tissue injury suppresses fibrinolysis after hemorrhagic shock in nonhuman primates (rhesus macaque) Journal of Trauma and Acute Care Surgery. 2017;82(4):750–757. doi: 10.1097/TA.0000000000001379. [DOI] [PMC free article] [PubMed] [Google Scholar]
- 20.Cliffton EE, Canamela DA. Proteolytic and fibrinolytic activity of serum; activation by streptokinase and staphylokinase indicating dissimilarity of enzymes. Blood. 1953;8:554–562. [PubMed] [Google Scholar]


