Abstract
Clinical applications of 3D printing are increasingly commonplace, likewise the frequency of inclusion of 3D printed objects on imaging studies. Although there is a general familiarity with the imaging appearance of traditional materials comprising common surgical hardware and medical devices, comparatively less is known regarding the appearance of available 3D printing materials in the consumer market. This work detailing the CT appearance of a selected number of common filament polymer classes is an initial effort to catalog these data, to provide for accurate interpretation of imaging studies incidentally or intentionally including fabricated objects. Furthermore, this information can inform the design of image-realistic tissue-mimicking phantoms for a variety of applications, with clear candidate material analogs for bone, soft tissue, water, and fat attenuation.
Keywords: Computed tomography, Education, Medical, Health technology, Human engineering, Image analysis, Image libraries, Imaging informatics, Medical devices, Medical informatics applications, Phantoms, Imaging, Quality assurance, Quality control
Introduction
While many clinically useful applications of 3D printing do not necessarily entail direct contact between a patient and a fabricated object, a number are meant specifically for this purpose [1, 2]. Clinical imaging services can thus anticipate a need for some familiarity with the appearance of an expanding catalog of materials that may be imaged alongside patient anatomy, as is currently the case for polyethylene joint liners, silicone implants, titanium and polyaryletherketone/polyetheretherketone (PAEK/PEEK) hardware, and other clinical and trauma-associated foreign bodies [3–6]. In addition to aiding interpretation, a catalog of imaging properties of 3D printed materials can also be used to design image-realistic tissue-mimicking patient phantoms for the purposes of quality assurance, education, and training [7].
Methods
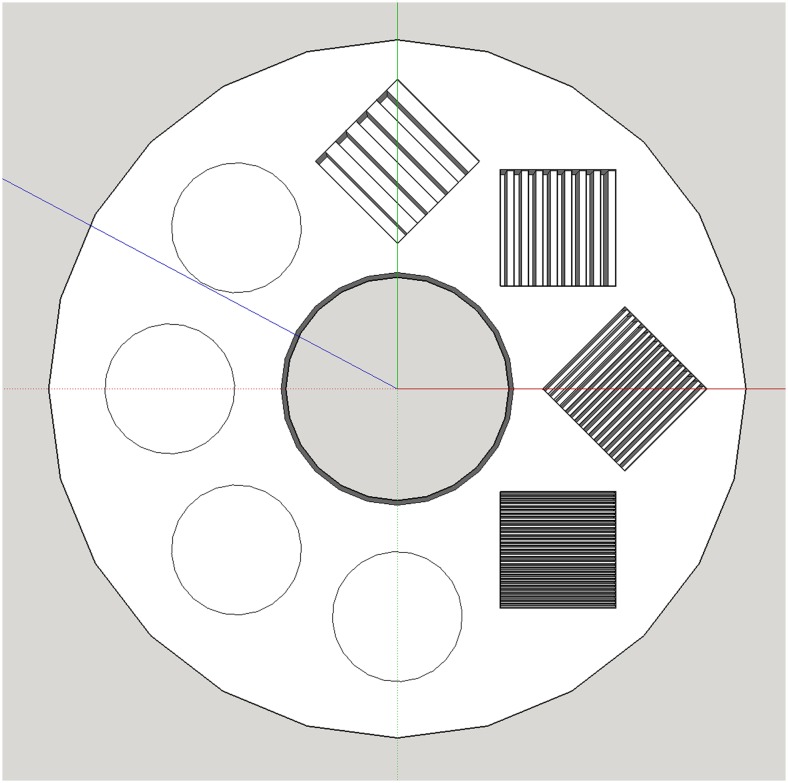
A 6-cm radius material characterization phantom (Fig. 1) was modeled iteratively in SketchUp v16.1 (Trimble Navigation; Sunnyvale, CA). Subsections within the final model reflecting line-pair (LP) resolutions of 0.2, 0.4, 0.8, and 1.6 LP/mm were included, the highest resolution (1.6 LP/mm) in excess of common desktop 3D printer resolution. This deliberate overfill is a design redundancy to ensure 100% infill in the designated subsection irrespective of eventual slice, toolpath, or printer settings. Model files were prepared for printing in Slic3r v1.2.9 (http://slic3r.org) at 100% infill, further customizing additional subsections to reflect infill percentages of 15, 30, 45, and 60%, using a rectilinear pattern.
Fig. 1.
Material phantom digital model, including circular subsections reflecting progressive infill percentages (15, 30, 45, 60%) and resolution subsections reflecting spatial resolutions of 0.2, 0.4, 0.8, and 1.6 LP/mm
A broad and nonexhaustive set (n = 14) of representative filament polymers evaluated included several common formulations and colors of polylactic acid (PLA), acrylonitrile butadiene styrene (ABS), polyethylene terephthalate (PET), thermoplastic polyurethane (TPU), high impact polystyrene (HIPS), polyvinyl alcohol (PVA), and nylon. Material phantoms were fabricated on a Lulzbot Taz 5 desktop 3D printer (Aleph Objects; Loveland, CO) at a layer height of 200 μm using filament-specific manufacturer recommended temperature settings. CT image data were acquired helically on a 64-slice GE Discovery CT750HD (automated exposure optimization, 1.0 pitch, 0.8 s rotation time) at beam energies of 80, 100, 120, and 140 kV. Images were processed in standard kernel at 0.625 mm slice collimation. A water-equivalent acrylic calibration phantom was included in the FOV. Attenuation measures were obtained using a 3-cm2 circular ROI drawn within the overfill subsection, to ensure homogeneity of material attenuation, and to avoid the influence of beam hardening artifact toward the edge of the phantom.
Results
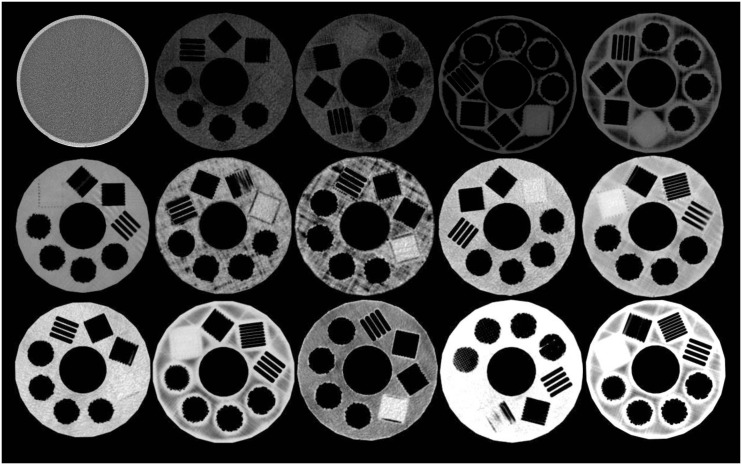
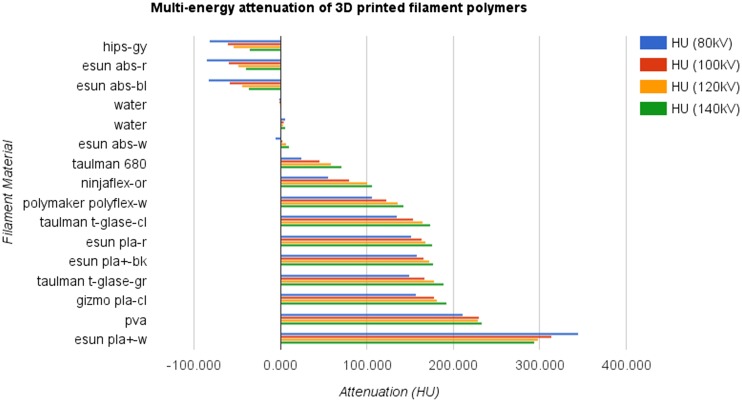
A thumbnail overview of the examined materials is provided in Fig. 2. Overall, material attenuation at 120 kV (Fig. 3) ranged from −54.747–298.726 HU. Attenuation at 120 kV for PLA formulations ranged from 168.536 to 298.726 HU, ABS from −49.583 to 7.312 HU, PET from 165.033 to 177.899 HU, and TPU from 100.398 to 135.730 HU. Attenuation for HIPS was −54.747 HU, PVA was 229.080 HU, and nylon 59.070 HU. Across materials, line-pair subsections were successfully fabricated to a resolution of 0.8 LP/mm, each well-visualized by CT. The 1.6-LP/mm resolution subsection resulted in a successful homogenous overfill in all cases. Complete multi-energy attenuation measures are provided in Table 1.
Fig. 2.
Cross-sectional CT appearance at 120 kVp of (top row) water, ABS red, ABS black, HIPS, ABS white; (middle row) nylon 680, TPU orange, TPU white, PET clear, PET green; (bottom row) PLA red, PLA clear, PLA+ black, PVA, PLA+ white
Fig. 3.
Multi-energy attenuation of 3D printed filament polymer materials
Table 1.
Multi-energy attenuation of 3D printed filament polymer material
| Material | HU (80 kV) | SD | HV (100 kV) | SD | HU (120 kV) | SD | HU (140kv) | SD |
|---|---|---|---|---|---|---|---|---|
| Lulzbot hips-gy | −82.338 | 13.506 | −61.443 | 13.830 | −54.747 | 13.701 | −36.606 | 11.959 |
| Esun abs-r | −85.634 | 11.965 | −60.433 | 12.661 | −49.583 | 12.708 | −41.139 | 10.014 |
| Esun abs-bl | −84.257 | 6.333 | −59.915 | 5.243 | −45.210 | 5.385 | −37.702 | 5.126 |
| Water | −2.094 | 27.170 | −1.658 | 16.644 | −0.946 | 12.922 | −0.525 | 12.524 |
| Water | 5.413 | 18.524 | 3.525 | 17.045 | 2.782 | 18.039 | 5.510 | 17.351 |
| Esun abs-w | −5.938 | 7.638 | 2.044 | 5.580 | 7.312 | 4.988 | 10.536 | 5.173 |
| Taulman nylon 680 | 24.554 | 8.405 | 45.212 | 6.660 | 59.070 | 5.510 | 70.746 | 5.562 |
| Ninjaflex-or | 55.215 | 26.530 | 79.483 | 24.519 | 100.398 | 19.361 | 106.526 | 18.452 |
| Polymer polyflex-w | 105.676 | 27.044 | 122.672 | 27.513 | 135.730 | 27.347 | 142.260 | 29.951 |
| Taulman t-glase-cl | 135.347 | 16.134 | 153.551 | 15.399 | 165.033 | 16.299 | 173.135 | 14.043 |
| Esun pla-r | 151.164 | 15.272 | 163.863 | 14.566 | 168.536 | 15.947 | 175.767 | 13.114 |
| Esun pla + −bk | 158.050 | 24.298 | 165.912 | 14.476 | 172.705 | 39.805 | 177.409 | 32.665 |
| Taulman t-glase-gr | 149.614 | 9.675 | 166.611 | 7.480 | 177.899 | 6.472 | 188.521 | 6.109 |
| Gizmodorks pla-cl | 157.375 | 9.398 | 178.042 | 7.207 | 181.147 | 6.179 | 192.370 | 6.264 |
| Esun pva | 211.000 | 12.895 | 230.054 | 15.020 | 229.080 | 14.730 | 232.891 | 12.912 |
| Esun pla + −w | 345.002 | 12.972 | 313.366 | 8.739 | 298.726 | 8.227 | 294.336 | 8.448 |
Discussion
The range of attenuation for the examined materials spans a sizeable and useful range of physiologic attenuation, suggesting for potential use in constructing image-realistic tissue-mimicking phantoms. The maximum obtained attenuation (345.002 HU at 80 kV), for example, is well within the expected range of osseous/calcified structures within the human body. Minimum attenuation (−85.634 HU at 80 kV) arguably reached a fat-attenuation range, however, this value pertains only to the measured overfill subsection. Adjacent areas of the material phantoms not predefined as infill or resolution subsections were fabricated at a default 100% infill, and in several instances, these areas were visibly less dense (and likely well within fat-attenuation range) compared to the measured overfill subsection, although not specifically characterized as part of this cataloging effort. This finding is felt to be in a part related to small differences in acquisition beam angles and inherent material sensitivity to beam hardening rather than fabrication-related factors such as z-axis density, as it is not evident consistently across materials of the same class fabricated with the same print settings. TPU filaments and the examined clear PLA formulation, to a lesser degree, also exhibited an apparent relative difference between the measured overfill subsection and adjacent 100% infill areas, however, in these instances, this apparent finding appears unrelated to beam hardening and is more likely attributable to slight under extrusion within the 100% infill areas—a typical challenge encountered when fabricating with TPU, and with the specific PLA formulation in the authors’ experience.
In addition to notable attenuation variability between material classes, attenuation varied inconsistently between colors and branded formulations of the same material type (Table 1). For most materials (n = 13), attenuation values increased with increasing beam energy. The single exception is eSUN PLA+ white, which showed an increasing attenuation at decreasing beam energies toward 80 kV, similar to the behavior of iodinated contrast media. Specific material formulations are typically not provided by manufacturers, as is the case for the examined materials, thus, attributing this observation to a specific material, process, or pigment is both challenging and outside the scope of this work. Although the focus here is not to examine the direct interaction between material science and imaging, these data suggest material decomposition of a suitably designed multimaterial 3D printed object may be possible using multi-energy spectral CT and known material imaging characteristics, such as those provided here.
Limitations
This work is limited primarily by the scope of materials examined, and the use of a single 3D printer for fabrication. As the intent of this work is to establish a reference to better inform device design and interpretation of imaging including 3D printed objects, we encourage researchers with access to a variety of 3D printers and materials to contribute analogous data, applying these methods to available print materials. Researchers with access to filament 3D printers are encouraged to contribute to this table of CT appearance of 3D printed filament polymers, and the material phantom model is available open-access to facilitate consistency of contributions (http://www.thingiverse.com/thing:1850036).
With sufficient contribution, we hope to confirm these imaging properties printed filament polymers are 3D printer agnostic within a narrow range of fabrication parameters, and examine more closely the potential impact of unique process-related differences between printing technologies—e.g., shark-skinning and under/over-extrusion of polymer filaments, curing time and post-fabrication curing of resins, print orientation, and speed. Subsequent work examining other filament and non filament-based 3D printing materials (e.g., stereolithography resin, selective laser sintering powder, PolyJet/MultiJet resin, mold casting resin) utilizing additional imaging modalities including MRI and ultrasound is ongoing concurrently.
Conclusion
Filament polymers suitable for 3D printing demonstrate a broad range of attenuation spanning a substantial and useful range of physiologic attenuation. Familiarity with material imaging characteristics provides for more accurate interpretation of imaging studies including increasingly commonplace 3D printed objects, as well as the potential for constructing multi-material tissue-mimicking phantoms. These data provide clear guidance in selecting filament polymer materials suitable as image-realistic analogs to fat, bone, water, and soft tissue attenuation. As the library of available printable filament polymers continues to grow and clinical use cases for 3D printing become increasingly a routine, this catalog of imaging properties of 3D printed materials can serve as an invaluable reference tool, and is the first portion of a broader cataloging effort of the multi-modal imaging properties of 3D printed materials.
References
- 1.Chae MP, Rozen WM, McMenamin PG, Findlay MW, Spychal RT, Hunter-Smith DJ. Emerging applications of bedside 3D printing in plastic surgery. Front Surg. 2, 2015. doi:10.3389/fsurg.2015.00025 [DOI] [PMC free article] [PubMed]
- 2.Rengier F, Mehndiratta A, von Tengg-Kobligk H, Zechmann CM, Unterhinninghofen R, Kauczor H-U, et al. 3D printing based on imaging data: review of medical applications. Int J Comput Assist Radiol Surg. 2010;5:335–41. doi: 10.1007/s11548-010-0476-x. [DOI] [PubMed] [Google Scholar]
- 3.Subhas N, Polster JM, Obuchowski NA, Primak AN, Dong FF, Herts BR, et al. Imaging of arthroplasties: improved image quality and lesion detection with iterative metal artifact reduction, a new CT metal artifact reduction technique. Am J Roentgenol. 2016;207:378–85. doi: 10.2214/AJR.15.15850. [DOI] [PubMed] [Google Scholar]
- 4.Ginat DT, Westesson P-LA. Atlas of postsurgical neuroradiology. Berlin, Heidelberg: Springer Berlin Heidelberg; 2012. [Google Scholar]
- 5.Lopez H, Harris KM. Ultrasound interactions with free silicone in a tissue-mimicking phantom. J Ultrasound Med. 1998;17:163–70. doi: 10.7863/jum.1998.17.3.163. [DOI] [PubMed] [Google Scholar]
- 6.Hunter TB, Taljanovic MS, Tsau PH, Berger WG, Standen JR. Medical devices of the chest. RadioGraphics. 2004;24:1725–46. doi: 10.1148/rg.246045031. [DOI] [PubMed] [Google Scholar]
- 7.Mitsouras D, Lee TC, Liacouras P, Ionita CN, Pietilla T, Maier SE, et al. Three-dimensional printing of MRI-visible phantoms and MR image-guided therapy simulation. Magn Reson Med. n/a-n/a, 2016. doi:10.1002/mrm.26136. [DOI] [PMC free article] [PubMed]


