Abstract.
This paper describes the Imperial College near infrared spectroscopy neuroimaging analysis (ICNNA) software tool for functional near infrared spectroscopy neuroimaging data. ICNNA is a MATLAB-based object-oriented framework encompassing an application programming interface and a graphical user interface. ICNNA incorporates reconstruction based on the modified Beer–Lambert law and basic processing and data validation capabilities. Emphasis is placed on the full experiment rather than individual neuroimages as the central element of analysis. The software offers three types of analyses including classical statistical methods based on comparison of changes in relative concentrations of hemoglobin between the task and baseline periods, graph theory-based metrics of connectivity and, distinctively, an analysis approach based on manifold embedding. This paper presents the different capabilities of ICNNA in its current version.
Keywords: functional near infrared spectroscopy, near infrared spectroscopy, neuroimaging, software
1. Introduction
Back in 2007, we started developing a software tool for the analysis of functional near infrared spectroscopy (fNIRS) neuroimages, then referred to as the Imperial College neuroimaging analysis (ICNA). The original tool provided as a distinctive feature an analysis method based on manifolds. This approach was at that time relatively unexplored in neuroimaging and in fNIRS in particular. As the analytical needs of our group grew, so did ICNA. Since then, ICNA has reached maturity becoming a tool for fNIRS neuroimaging analysis offering different analysis alternatives, both statistical and topological (manifold-based and graph theory), and being referred to as Imperial College near infrared spectroscopy neuroimaging analysis (ICNNA). A salient feature of ICNNA is its emphasis on the full experiment rather than individual neuroimages as the central element of analysis. This technical note briefly overviews the different capabilities of ICNNA in its current version.
In optical neuroimaging,1,2 light can be irradiated in several ways to yield continuous-wave, frequency domain, and time-domain images. Each of the different fNIRS images exploits a different optical parameter (e.g., absorption, scattering, Doppler effect, etc.) to monitor the alteration of a certain physiological parameter and infer brain activity from change in cortical hemodynamics.3 Perhaps the predominant submodality for optical functional neuroimaging currently is continuous-wave fNIRS,4 for which a variety of tools have been developed. Processing and analytical tools such as HomER (versions 1 and 2),5,6 NAVI,7 fOSA,8 NIRS-SPM,9 NAP,10 FC-NIRS,11 fNIRSr,12 NinPy,13 HITACHI’s POTAto, or NIRx’s nirsLAB,14 have permitted fNIRS practitioners to explore many aspects of brain development, behavior, and pathologies15 covering both integrational and segregational questions about brain function. More recently, analysis tools for hyperscanning scenarios, such as the +NIRS Toolbox, are becoming available.16 Thus far, classical statistical analysis has clearly dominated the data processing and analytics9,17 with alternatives exploring differential models,18 probabilistic graphical configurations,19,20 graph theory,21 and topology.22
ICNNA23 is a software framework encompassing an application programming interface (API) and a graphical user interface (GUI) implemented under the MATLAB® environment, which has grown to become a flexible analysis tool. ICNNA has some basic reconstruction, processing, and visualization capabilities. However, where ICNNA stands out is in its analytical capabilities. ICNNA is capable of conventional statistical analysis (e.g., task-minus-baseline),24 and graph theory-based analysis,21 and yet distinctively, ICNNA also offers topological analysis based on manifold modeling,22 within the same environment, and importantly from the same mathematical framework, where the neuroimage is considered to form a tensor, and the application document is a full experiment, consequently affording great analytical flexibility. From the computational perspective, ICNNA capitalizes on the object-oriented programming paradigm while still relying on MATLAB’s matrix manipulation for algebraic computation. The conceptual model is capable of accommodating a range of experimental designs from basic to complex, and provides a flexible and highly expressive framework for articulating different analysis affording support for interpretation. This paper aims to (i) present the conceptual model underlying ICNNA and (ii) provide an overview of ICNNA’s most recent version capabilities for fNIRS data analysis.
2. Conceptual Model for Functional Near Infrared Spectroscopy Experimentation
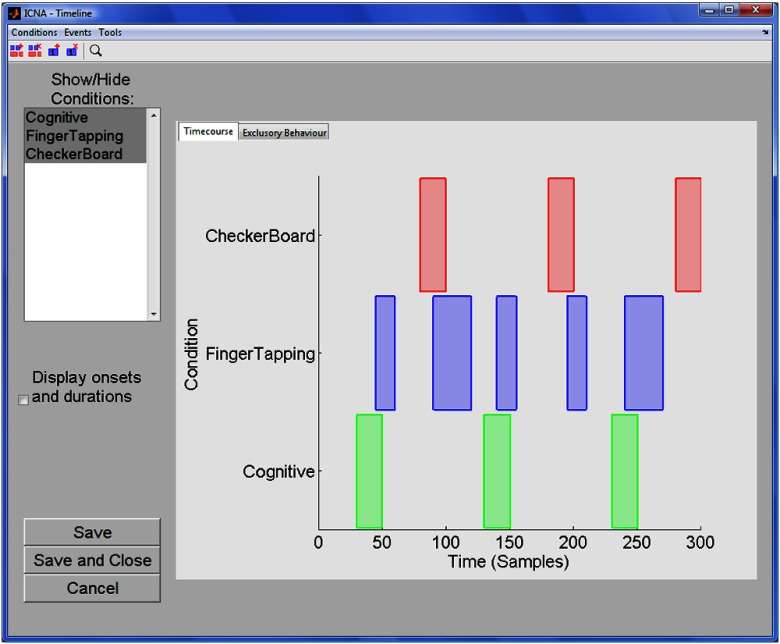
ICNNA puts the experiment, and not the individual neuroimages, in the center of the analysis. Experimentation with functional optical neuroimaging is not substantially different from experimentation in other neuroimaging modalities, or in fact many other fields of science.25 In an experiment, a cohort of subjects (experimental units) is recruited and distributed, possibly randomly, into a number of groups following a within- or between-subject policy. Each group undertakes one (between-) or more (within-) experimental treatments that can take the form of executing a certain task, undergoing a particular stimulation, or being observed at rest, and represent potential combinations of levels of experimental factors. The treatment is served under controlled conditions specifically manipulated to test a pre-stated hypothesis over a particular phenomenon regarding brain behavior. Experimental sessions correspond to data harvesting opportunities where the neuroimages (observations) are acquired either cross-sectionally at a single time point or longitudinally at more than one time point with repeated measurement data. During these experimental sessions, the brain is monitored with the neuroimaging modality of choice, and perhaps other biosignals are further sensed and task performance metrics are further collected. It may be the case that the task or stimulus is carried out off-line before and/or after the neuroimaging session, and the plastic changes in the brain are observed. Whatever the situation, neuroimages as well as the other data streams, are acquired with certain devices acting as data sources each with specific sensing specifications. In a typical stimulus train as the example shown in Fig. 1, often the task or the stimulation is repeated a number of times, referred to as blocks or trials, to increase the chances of discriminating brain activity from background noise.
Fig. 1.
A typical stimulus train of an fNIRS experiment. In this example, three experimental conditions are repeated a number of times (blocks) at self-paced (blocks have different duration).
Group level analysis benefits from software that it is centered around the experiment. When the individual neuroimage is the central element of the tool document or project, it is often accompanied by batch processing and cohort level analysis is either not available, cumbersome e.g., second-level statistics may require manipulation of intermediate representations, or require exporting to a third software. A software centered around the experiment can also facilitate different analysis to be carried out over the same dataset.
3. Scaffolding for Housing Functional Near Infrared Spectroscopy Experiments
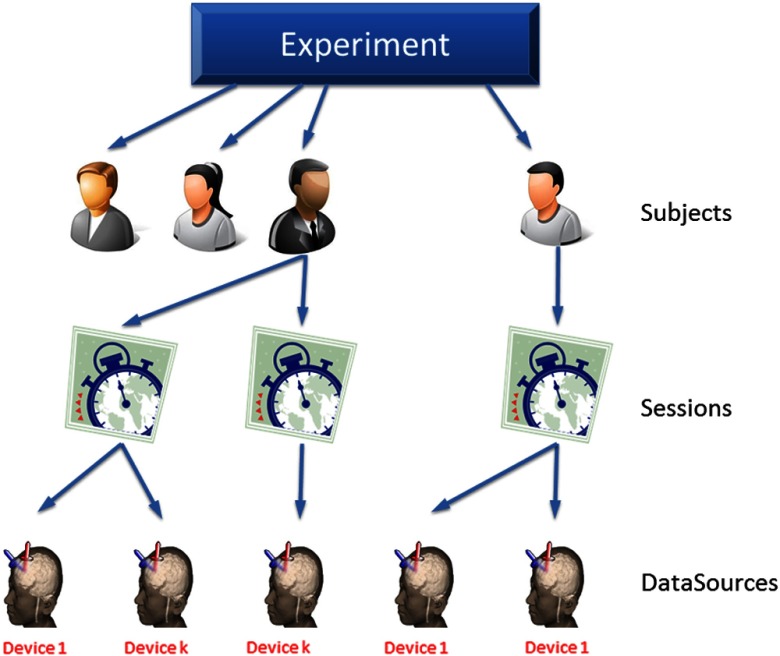
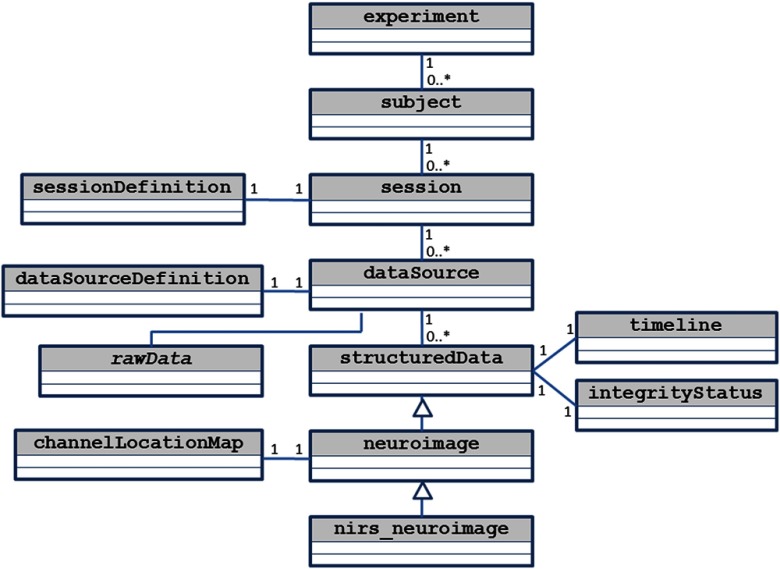
Upon analyzing a typical neuroimage experiment in ICNNA, one has three aspects to consider; (i) who is to be measured?—subjects, again experimental units-, (ii) what and where do we measure?—data source, that is sensing geometry-, and (iii) how are measurements to be acquired?—sessions or observation acquisition, encompassing the intertwined relations among other experimental elements. Given these three elements, the experiment can be thought of as a hierarchical tree (see Fig. 2). This hierarchical structure is replicated in the software architecture represented by its class diagram in Fig. 3.
Fig. 2.
Idealization of an fNIRS experiment as a tree where participants (subjects) are allocated to different treatments administered in different experimental sessions during which their brain function is monitored with some devices acting as sources of data.
Fig. 3.
Simplified class diagram supporting ICNNA’s data structure.
An experiment gathers data from a cohort of subjects (experimental units) over certain defined sessions from a range of data sources (dataSources). In the strictest sense, a session corresponds to a data collection exercise. But it is in the flexible definition of the experiment sessions that the conceptual model of ICNNA can accommodate many experimental designs. An example may be a longitudinal clinical trial in which there is a control group receiving treatment , and an intervention group receiving treatment being tested along time points. Definition of this experimental design in ICNNA requires declaration of sessions; two tasks at time points. Note that each subject in the cohort may perform either only one of the treatments (between subjects) or both (within subjects), but the subject is automatically “assigned” to the correct group simply by participating in the appropriate sessions where the corresponding treatment is administered. During a session, data are collected from one or more sensing devices by means of a collection of sensors. The concept of dataSource in this conceptual model is more generic than just a neuroimage, which is just a specific kind of data source. For instance, we have concrete classes to deal with several other sources such as eye-trackers, optical trackers, or magnetic trackers among others that are not included with ICNNA (unpublished). A data source makes no assumption about the state of the information gathered (raw or processed) nor about its nature; it is an encompassing concept that comprises data in raw state or already reconstructed in any processed state.
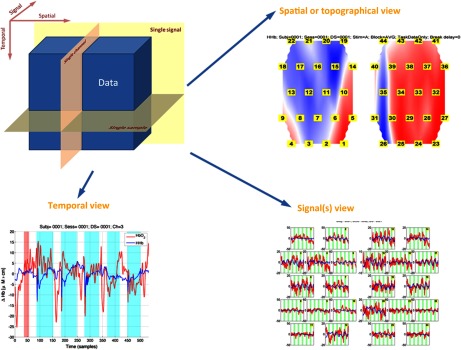
Harvested data, raw or reconstructed, are thought of as a three-dimensional data tensor: <temporal, spatial, and signal> as shown in Fig. 4. The first dimension stores data samples at different times in a sequential order. The second dimension collapses all spatial locations that ICNNA will refer to as channels and that can be accessed by simple indexation. When locations can be confined to a surface, this is the realm of optical topography,2,26 When a thick slab of tissue is probed this is the domain of optical tomography.27–29 Note that the specific spatial distribution of channels is encapsulated, not in this data tensor, but separately in a channelLocationMap object. Finally, the third dimension of the data tensor encapsulates the different acquired signals, whether corresponding to optical filters’ raw output or later reconstructions of hemoglobin species. In its raw state, an optical neuroimage can be recorded at different wavelengths, typically at two or three wavelengths, or perhaps multispectrally and hyperspectrally, each wavelength constituting a signal. Following reconstruction, an optical neuroimage records at each channel information of oxygenated and reduced hemoglobin, but also perhaps of the enzyme cytochrome-c-oxydase, or derived total hemoglobin or blood oxygenation. Of course, at least as many wavelengths have to be recorded to recover a given number of original signals. For instance, an fNIRS image from a continuous-wave device recording at two wavelengths at 10 Hz with a 24 channels configuration, e.g., typical configuration of the HITACHI ETG-4000 optical topography system, during 1 min, may produce a tensor of <600 samples, 24 channels, 2 hemoglobin species>, which is stored in a processed structuredData. A whole experiment, a document in ICNNA, is thus an indexed collection of structuredData tensors.
Fig. 4.
The fNIRS neuroimage as a tensor. The data tensor is encoded in the structuredData object. Even although the tensor itself is generic for other sources of data, but only one data type is stored at a time in a structuredData and hence it is illustrated here for the fNIRS neuroimage alone. The three cutting planes corresponding to specific submatrices are exemplified. In the particular case of the signal view, both signals (i.e., two parallel planes) are shown.
Each dataSource has embedded a timeline that encodes experimental conditions and events occurring during the session. The timeline is a collection of conditions that in turn are a collection of events. Each event is identified by an onset and a duration (maybe 0 for instantaneous events) and can have some associated information. For those raw formats that are supported and for which the temporal information is available ICNNA automatically imports that information. Supported formats can be found in the user manual. Otherwise, manipulation from the GUI (Fig. 1) or the command line is possible. For those processing and analysis operations incorporated to ICNNA that may affect the timeline, e.g., decimation, the timeline automatically updates accordingly.
4. Image Reconstruction, Processing, and Integrity Check
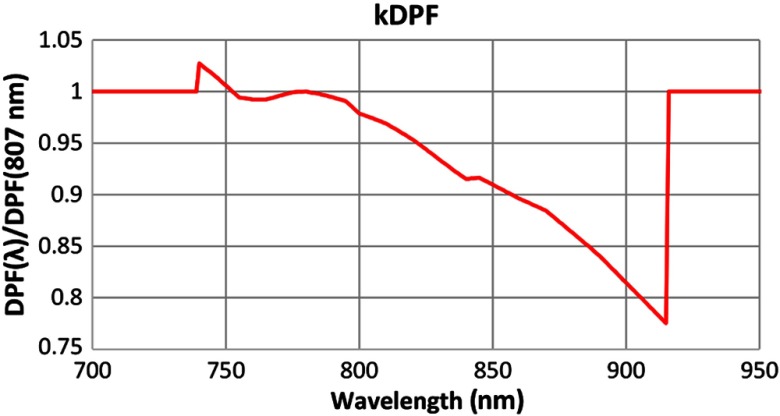
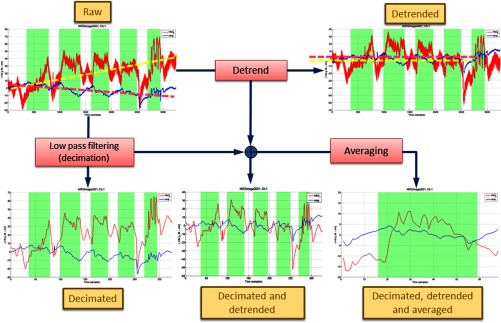
ICNNA’s main goal is not the processing of the NIRS signals. Instead, it was conceived to help mostly with analysis and understanding and thus its abilities on this processing facet are confined to very common procedures. In this sense, reconstruction in ICNNA is achieved using the modified Beer–Lambert law (MBLL)30 with or without differential pathlength correction. Differential pathlength factor (DPF) value is estimated as a product of an average value times a wavelength-dependent factor; . The is by default given a value 6.26 at 807 m,31 but the user can program a different one. Essenpreis et al.32 get an average at 800 nm for adults. Wavelength dependency, expressed by the , is calculated as the ratio of the wavelength-dependent DPF and the DPF at an arbitrary reference.32 But distinct from the 800 nm reference used by Essenpreis et al.,32 ICNNA uses the 807-nm reference (see Fig. 5). Standard processing in ICNNA is restricted to linear detrending for correcting system drift and low-pass filtering using decimation for basic physiological denoising as illustrated in Fig. 6. Default decimation factor is set to 10, but the user can choose it via the command line through the method nirs_neuroimage.decimate. Nevertheless, ICNNA alleviates this shortcoming by: (i) providing a direct link with UCL’s fOSA,8 with ICNNA being capable of reading fOSA files whether individually or as a batch, and (ii) giving the user direct access to data at any stage, raw or processed, so that processing can be made outside ICNNA and then easily return to ICNNA for continuing with the analysis. Through the API, direct manipulation of the data is available to the user who can perform additional processing. The range of processing and analysis techniques that have been applied to neuroimaging can be overwhelming. The description of all of these techniques is beyond the scope of this paper, and vast literature is available on any of these. For fNIRS, there are excellent reviews available.6,17
Fig. 5.
Wavelength dependency of the DPF used by ICNNA. The kDPF is only known between 740 and 915 nm (as far as the authors know). The values outside the range reported by Essenpreis et al.32 are available from the fOSA software and attributed to Mark Cope (source unknown according to fOSA). Beyond those values, an arbitrary is applied.
Fig. 6.
ICNNA data processing capabilities including detrending, decimation, and block averaging on a per channel basis.
It is common for fNIRS researchers to carry out a visual inspection of their data to eliminate data that have been affected by common artifacts. ICNNA provides automatic detection of common artifacts such as optode movement—sometimes referred to as body movement—and detector saturation whether at one wavelength producing the characteristic mirroring effect or at two wavelengths leading to apparent nonrecordings.33 In particular, for optode movement, ICNNA provides implementation for the approaches suggested in Peña et al.34 (threshold-based) and Sato et al.35 (wavelet-based) as well as an additional approach based on time series modeling where the optode movements are indicated by concurrent deviations of the time series predictions in both hemoglobin species. For saturation-related artifacts, prior to image reconstruction, ICNNA can scan the raw measurements for values on the extreme of the sensor output, or alternatively if data are available only following reconstruction, ICNNA detects saturation episodes using a multiscale windowed cross-correlation algorithm in which a high cross-correlation between the hemoglobin species at different scales is indicative of mirroring. Alternatively, the user can manually label each channel as “contaminated” or “clean.” Only those channels containing clean data are passed on to further analysis.
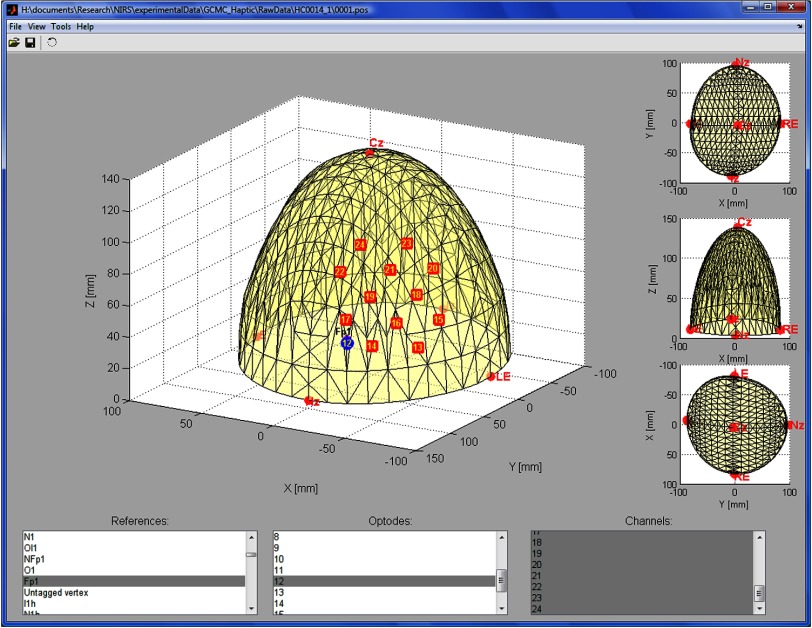
Finally, ICNNA incorporates a semivirtual registration tool.36 The tool employs a virtual hemispheric model of the standard 10/20, UI 10/10, and 10/5 models37 that is deformed to match five control points—inion, nasion, right and left preauricular points, and Cz—and permits estimation of the standard location closest to the channels and/or estimation to distances to targeted locations.36 The three-dimensional (3-D) coordinates for the control points and channel locations can be registered with a Polhemus patriot with at 8′′ stylus. The GUI of this add-on is illustrated in Fig. 7.
Fig. 7.
The GUI of the semivirtual registration tool integrated with ICNNA. It supports the international , as well as the UI and systems. Digitalized 3-D locations of optodes and channels are mapped to a hemispheric model, which is the distorted so that distances to target positions can be estimated.
5. Analysis
5.1. Analytical Experiment Space
The experiment space is an intermediate representation that permits ICNNA to seamlessly afford different types of analytical approaches. The experiment space (experimentSpace) parameterizes the repository, setting a suitable scheme ready for analysis. The way in which this scheme is built from the data determines whether a channel-based or a region of interest (ROI)-based analysis is to be carried out. The experiment Space is a seven-dimensional lattice where the dimensions arise from experimental concepts: subject, session, data source, stimulus or experimental condition, trial or block of the experimental condition, channel or spatial ROI, and signal, e.g., chromophore.
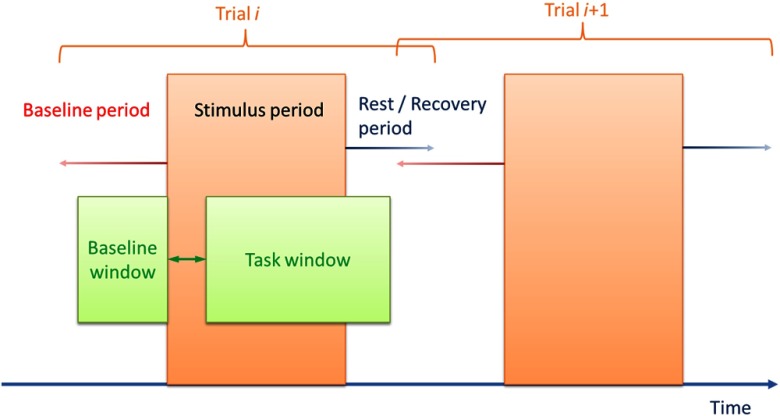
The coordinates of the points in this space are simply the categorical identifiers of the different elements. The points in this space akin to a vector space have associated a temporal chunk of the timecourses of the recorded neuroimages, which extract individual trial information composed of baseline, task, and rest or recovery periods. This is done in two steps. First, block splitting is performed, whereby the neuroimages are split in smaller subimages containing only one single event of each experimental condition. Second, a particular temporal window for analysis is selected. Parameterization of the window selection is illustrated in Fig. 8. There is to date, no gold standards regarding the optimal temporal length of data for comparison. Heterogeneity in data selection strategies include using the entire stimulus episode, excluding a few seconds at the beginning of stimulus data to account for transient inertia of hemodynamic change, and/or incorporating fixed-length temporal windows regardless of stimulus onset and offset. All of these are available within the ICNNA framework. We have investigated the influence of the temporal window selection on subsequent activation maps and demonstrated perhaps unsurprisingly that variation in temporal data selection significantly influences activation detection.38 Finally, to provide the flexibility of analysis ICNNA permits the points of the experiment space to express averaged behavior across stimulus blocks, resampled versions of the blocks, e.g., in case of self-paced tasks, normalized versions of the blocks, and any combination of these. In summary, in this representation, all the information of the experiment is present in the space, but the information has been split into its quantum division by trial and perhaps homogenized in its temporal variation, e.g., resampling.
Fig. 8.
Schematic depiction of the analysis window parameterization. time to peak or HHb time to nadir may not be confined to the experimental stimulus period, but may be captured with the flexible analytical window.
A convenient feature of ICNNA is the capability of outputting some of the descriptive stats over the experiment space, e.g., mean and standard deviation of baseline and task, time to peak, time to nadir, etc., to a comma separated values file so that further analysis can be carried out in external statistical packages, such asSPSS or R.
5.2. Statistical Analysis
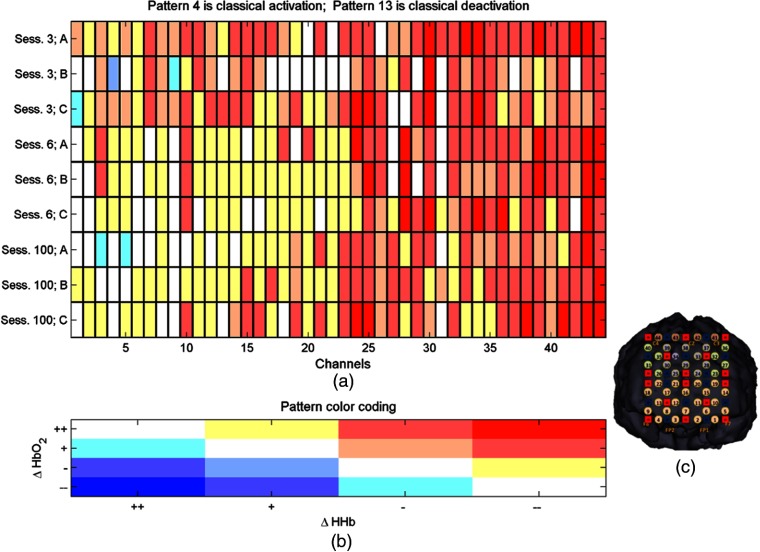
Stimulus evoked changes in cortical hemodynamics consistent with cortical activation comprise increases in oxyhemoglobin () coupled to decreases in deoxyhemoglobin (HHb).39 These are often expressed as statistical comparisons between the distributions of “rest” and “stimulus” data.17 The representation of this classical task-minus-baseline statistical analysis in ICNNA is the activity matrix; a matrix in which the rows represent the cases of interest, e.g., a particular stimulus, a particular session or a particular subject among others, and columns represent channels. For each case of interest and channel, two univariate tests of hypothesis, one for each Hb species—compare the distribution of values during the stimulation period with those of the baseline (see window selection parameterization above). The value encoded in each position of the matrix is the pattern of activity, ranging from 1 to 17 representing any of the possible combinations of statistically significant increment, nonsignificant increment, non-significant decrement, and significant decrement for both Hb species; plus an additional pattern when there are no data (e.g., when the available data have been nullified during the integrity checks). An exemplary activity matrix is shown in Fig. 9. The ICNNA framework presently does not extend to a representation of these statistical results onto a head or brain, which must be performed externally.
Fig. 9.
(a) Exemplary activity matrix corresponding to a longitudinal dataset with three different experimental conditions (A, B, and C). (b) Activity patterns are numbered according to the direction of change and its reaching of significance and then color coded for quick exploration. The example corresponds to an experiment where clear trends of higher activity concentration were located in the superior channels. (c) Channel locations. Although ICNNA records the channelLocationMap, the pictorial representation of the channel location map has been generated externally to ICNNA and is only shown here for reference purposes.
ICNNA provides two alternatives for the hypothesis testing: one parametric (-test) and one non-parametric (Wilcoxon). Although the approach of two univariate tests, one for and another for the HHb, is often accepted, statistically it introduces an error as it assumes the two hypotheses being tested as independent of each other, but this is certainly not the case considering the cross talk during the reconstruction.40 A more appropriate solution will be a multivariate hypothesis test, but this is not currently available in ICNNA.
5.3. Manifold Embedding-Based Analysis
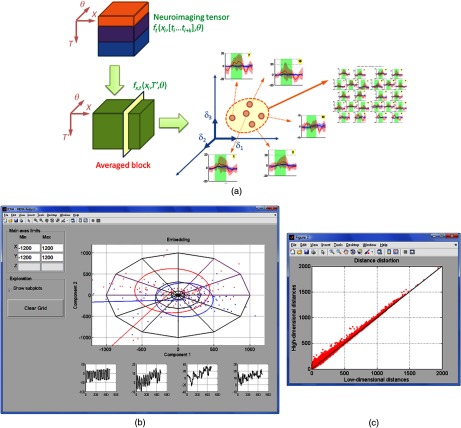
ICNNA facilitates manifold-based topological analysis of the brain function.22 In this analysis, the brain function is hypothesized to abide the topological construct of a manifold, and consequently many phenomena about brain function can be expressed under a topological framework.41 The basic analytical path of this type of analysis was referred to by Friston et al.42 for fMRI data as the “functional space.” In this approach, points in the experiment space, e.g., brain function at a channel, form a cloud of points in an ambient space referred to as the functional space. Upon definition of a distance function between points, either metric or pseudometric—normally expressing similarity of signal behavior the cloud of points is assumed to be confined to a manifold. Since the manifold is likely to be expressed in a high-dimensional ambient space, and also likely to have an intrinsic high dimensionality, a projection to a lower dimensional space is then sought for visualization purposes as exemplified in Fig. 10. Intuitively, a manifold is a surface that is locally flat. Formally, a -dimensional set is a manifold , with being the ambient space, if for every point it holds that there exists an open set that contains (i.e., a neighborhood of ), an open set (flat “equivalent” of the neighborhood ) and a diffeomorphism : such that . When a smooth manifold, embedded in a space of positive signature, e.g., the ambient space is Euclidean, is enriched with a distance function, it takes a particular geometry. The manifold then becomes a Riemannian, when the distance function is metric, or pseudo-Riemannian manifold otherwise respectively. The current version of ICNNA provides the following options for the distance function; Euclidean, one minus correlation, and the square root of the Jensen–Shannon divergence. For each of these, the manifold can be observed using the ambient distance or the geodesic (along the manifold). In earlier works, Friston et al.42 opted for the one-correlation whereas we opted for the geodesic.22
Fig. 10.
(a) Topological analysis of neuroimages. The brain function is hypothesis to be confined to a manifold surface. (b) ICNNA GUI for the exploration of the brain function manifold. (c) Distance distortion plot permitting estimation of the distortion suffered during the dimensionality reduction imposed for rendering.
The projection or embedding to a lower dimension permits also a number of mappings depending on the point of view of the observer. ICNNA provides two basic projections: classical multidimensional scaling and curvilinear component analysis. The combination of the distance function and the projection chosen determines the manifold embedding approach. The interested reader can find excellent reviews of data dimensionality reduction techniques somewhere else.43,44
Analysis is not confined to the basic analytical path and can be flexibly done by channels, blocks, full neuroimages, or even groups. Alas, interpretation of the functional space is challenging. To alleviate this effort, ICNNA provides some exploration capabilities as illustrated in Fig. 10.
5.4. Graph-Theoretical Analysis
Graph theory has become a highly popular analysis approach to explore connectivity.45 A graph , which is also a topological object like the manifold, is a set of edges defined as a rule of association among a set of entities referred to as nodes of the graph. A common formalization presents as the pair ; with edges in turn pairs . In neuroimaging analysis, nodes typically correspond to brain regions and the edges express aspects of the connectivity—the type of connectivity being encoded depending on the underlying type of graph and how this matches neurophysiological constructs. Then, summary metrics of the graph, e.g., diameter, degree of the nodes, permits expressing powerful concepts of brain behavior e.g., workload and/or cognitive burden21 and/or topological features of the brain function, e.g., its small-worldliness.46
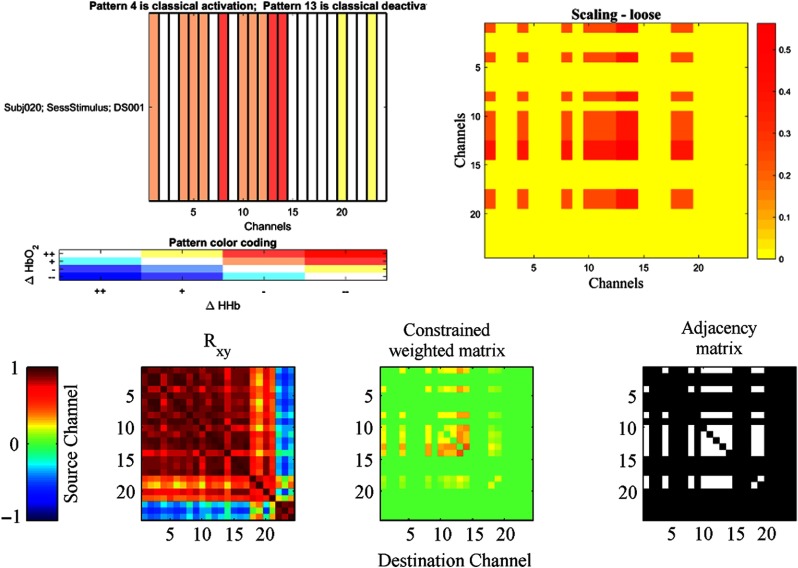
Its application to fNIRS has been less popular compared with fMRI because some of the metrics describing the graph properties work better (are less biased) with large graphs. Nevertheless, ICNNA—through the API only in the current version—also offers graph-theoretical analysis of neuroimages. Among the graph descriptors that ICNNA can produce are number of edges, node degrees (in and out), density, clustering coefficient, number of connected components, mean path length, node weights, efficiency whether global or maximal, cost, and economy. The calculation of the small world index is trivial from the former descriptors. An example of the adjacency matrix calculated in ICNNA is shown in Fig. 11. Graphical depiction of network data between brain regions is presently conducted outside the ICNNA environment; however, there are convenient export functions for alternative graphical packages (e.g., Pajek).
Fig. 11.
Graph theory-based analysis in ICNNA for the analysis of connectivity.21 Top row: the activity matrix (left) and the scaling matrix (right). Bottom row: the channel correlation matrix (left), the weighted matrix (center), and the final adjacency matrix (right). For the correlation matrix (bottom left), color is proportional to the correlation value. Then, the matrix of correlation is constrained using a scaling factor derived from the activity matrix (top left). In ICNNA, the survival of edges is dictated by activity of the channels linked by the edge, which may be treated as “strict” (both hemoglobin species are requested to show statistically significant trend—i.e., only red patterns of the activity matrix are considered), “half-strict” (at least on hemoglobin species is requested to show statistically significant trend—i.e., red or pinkish patterns of the activity matrix are considered), and “loose” (hemoglobins are requested to show a trend in the correct direction but statistical significance is not requested—i.e., red, pinkish or white patterns of the activity matrix are considered) according to the user preferences. For each potential edge between any two pair of nodes (channels), the two channels on each end brings a scaling factor proportional to its activity pattern, and the product of the two factors yield the final scaling factor (top right) modulating the cross-correlation values for the edge and dictates surviving edges. Color in the weighted matrix (bottom center) represents a scaled version of the correlations given the constraint. Finally, the weighted matrix is thresholded to obtain the adjacency matrix (bottom left); surviving edges are represented in white and pruned edges in black. Like with any other analysis approach, understanding the implications and assumptions of the approach is critical to decide on any preceding processing.47
6. Conclusions
ICNNA has in the last few years grown to become a versatile analytical tool. Structurally, we highlight what we consider are two key features of ICNNA; putting the experiment as the central element of the ICNNA document and the intermediate experiment space that facilitates different types of analysis. In terms of analytical capabilities, we highlight its flexibility incorporating the common statistical analysis as well as the graph-theoretical-based analysis, but uniquely (as far as we are aware) providing the mathematically sophisticated manifold-based analysis and interestingly capitalizing on the same data structures. The key to manifold-based modeling is to find a continuous association between the observations and the neuroscientific construct of interest; usually in two steps; projection to an ambient space and definition of a geometry by means of a distance function (although some manifolds do exist outside any ambient space). Manifolds are highly flexible—there is a wide family of manifolds each with different properties—and expressive—capable of encoding local and global properties of data—mathematical objects. This makes manifolds a convenient tool potentially capable of supporting modeling different functional phenomena and quickly allowing exploration and understanding of the full experiment dataset at different zoom levels. The latter is not often easy for more traditional approaches. Because of the interest in our group, we have prioritized the analysis of connectivity and longitudinal changes. But segregational analysis is also plausible (a synthetic point representing the convolution of the hemodynamic response to the stimulus train can be projected to the manifold to establish the region of the manifold where activity is encoded) though not included in ICNNA.
In its current version, ICNNA has some limitations that we look to attend in the future. The statistical analysis can be improved in several ways. The activity matrix is returned without correction for multiple comparisons. Although encoding timelines of event-related or mixed-event block designs is possible, the current activity matrix assumes block design. Contrasts (e.g., ) are not currently available. We are now expanding our manifold-based modeling in three major directions. First, substituting the current orthogonal projection for a projection based on Fourier decomposition mapping to a cylinder manifold encoding the familiar phase and frequency, which we hope shall facilitate interpretation. Second, optimizing the choice of the neighborhood size defining the solution using persistent homotopies.48 Third, by exploiting causal Lorentzian manifolds to express effective connectivity. Also, we are further exploring other computational approaches for modeling connectivity based on probabilistic graphical models20 that we hope to incorporate to ICNNA soon. Graph-theoretical analysis is available only by using the command line and it would be convenient to have a GUI, and integrating graph matching capabilities remains. Finally, we are improving the semivirtual registration tool, substituting the hemispheric model for a head model, and validating the approach.
For brevity, we have not included an additional section exemplifying some of the analysis and results that we have obtained with ICNNA in the past; however, all of the figures included in the paper correspond to unpublished material from our group. We have also kept mathematical formulation to a minimum to give priority to the software application itself, since the mathematical details have been already published in earlier works by our group. The ICNNA latest version is available from Ref. 49. The software is provided as is, and is given free for academic use.
Acknowledgments
We would like to thank Marco Caproni and Giulia Paggetti who, while using ICNNA for their research, have greatly contributed to test it and identify bugs. This work has been partially funded by Consejo Nacional de Ciencia y Tecnología (CONACYT), Award No. CB-2014-01-237251.
Biographies
Felipe Orihuela-Espina is a lecturer at the Instituto Nacional de Astrofísica, Óptica y Electrónica (Mexico), and previously worked as a research associate and held an honorary position at Imperial College London. He has authored over 30 JCR indexed journal papers and many peer-reviewed in-extenso conference papers. His current research interests are in fNIRS interpretation.
Daniel R. Leff is a clinical senior lecturer in the Departments of BioSurgery and Surgical Technology and Hamlyn Centre for Robotic Surgery at Imperial College London. He is an honorary consultant in oncoplastic breast surgery working within the Breast Unit at Imperial College Healthcare NHS Trust. In 2016, he won the Issac Gukas Medal for achievement in breast surgery. His primary research interest is in the field of surgical neuroergonomics.
David R. C. James is a colorectal surgeon. He obtained his PhD from Imperial College London. He has authored over 25 peer-reviewed papers in journals and international conferences. He has been fellow of the Royal College of Surgeons since 2016.
Ara W. Darzi holds the Paul Hamlyn Chair of Surgery at Imperial College London and the Royal Marsden Hospital. He is the director of the Institute of Global Health Innovation, Chair of Imperial College Health Partners, and Honorary Consultant Surgeon at Imperial College Hospital NHS Trust. He has authored over 800 peer-reviewed research papers. He also holds the honorary fellow of the Royal Academy of Engineering, fellow of the Academy of Medical Sciences, and fellow of the Royal Society.
Guang-Zhong Yang is the director of Hamlyn Centre for Robotic Surgery, director and founder of the Royal Society/Wolfson Medical Image Computing Laboratory, cofounder of the Wolfson Surgical Technology Laboratory, and chairman of the Centre for Pervasive Sensing. He received the ISMRM I.I Rabi Award. He is a distinguished lecturer for IEEE Engineering in Medicine and Biology Society, fellow of the Royal Academy of Engineering, and recipient of the Royal Society Research Merit Award.
Disclosures
None to declare.
References
- 1.Gibson A., Dehghani H., “Diffuse optical imaging,” Philos. Trans. R. Soc. London Ser. A 367, 3055–3072 (2009). 10.1098/rsta.2009.0080 [DOI] [PubMed] [Google Scholar]
- 2.Wolf M., Ferrari M., Quaresima V., “Progress of near-infrared spectroscopy and topography for brain and muscle clinical applications,” J. Biomed. Opt. 12(6), 062104 (2007). 10.1117/1.2804899 [DOI] [PubMed] [Google Scholar]
- 3.Villringer A., Chance B., “Non-invasive optical spectroscopy and imaging of human brain function,” Trends Neurosci. 20(10), 435–442 (1997). 10.1016/S0166-2236(97)01132-6 [DOI] [PubMed] [Google Scholar]
- 4.Scholkmann F., et al. , “A review on continuous wave functional near-infrared spectroscopy and imaging instrumentation and methodology,” NeuroImage 85, 6–27 (2014). 10.1016/j.neuroimage.2013.05.004 [DOI] [PubMed] [Google Scholar]
- 5.Huppert T., Boas D. A., “HomER: hemodynamic evoked response NIRS data analysis GUI program user’s guide stand-alone executable version (version 4.0.0),” Photon Migration Imaging Lab, Massachusetts General Hospital/CNY, Charlestown, Massachusetts: (2005). [Google Scholar]
- 6.Huppert T. J., et al. , “Homer: a review of time-series analysis methods for near-infrared spectroscopy of the brain,” Appl. Opt. 48(10), D280–D298 (2009). 10.1364/AO.48.00D280 [DOI] [PMC free article] [PubMed] [Google Scholar]
- 7.Pei Y., et al. , “NAVI: a problem solving environment (PSE) for NIRS data analysis,” in Fifth Inter-Institute Workshop on Optical Diagnostic Imaging from Bench to Bedside at the National Institutes of Health, Bethesda, Maryland, p. 155 (2006). [Google Scholar]
- 8.Koh P. H., et al. , “Functional optical signal analysis: a software tool for near-infrared spectroscopy data processing incorporating statistical parametric mapping,” J. Biomed. Opt. 12(6), 064010 (2007). 10.1117/1.2804092 [DOI] [PubMed] [Google Scholar]
- 9.Ye J. C., et al. , “NIRS-SPM: statistical parametric mapping for near-infrared spectroscopy,” NeuroImage 44, 428–447 (2009). 10.1016/j.neuroimage.2008.08.036 [DOI] [PubMed] [Google Scholar]
- 10.Fekete T., et al. , “The NIRS analysis package: noise reduction and statistical inference,” PLoS One 6, e24322 (2011). 10.1371/journal.pone.0024322 [DOI] [PMC free article] [PubMed] [Google Scholar]
- 11.Xu J., et al. , “FC-NIRS: a functional connectivity analysis tool for near-infrared spectroscopy data,” BioMed Res. Int. 2015, 248724 (2015). 10.1155/2015/248724 [DOI] [PMC free article] [PubMed] [Google Scholar]
- 12.Walczak E. “fnirsr package for analysing functional near-infrared spectroscopy (fNIRS) data,” 2017, https://github.com/erzk/fnirsr (4 September 2017).
- 13.Strangman G. E., Zhang Q., Zeffiro T., “Near-infrared neuroimaging with NinPy,” Front. Neuroinf. 3, 12 (2009). 10.3389/neuro.11.012.2009 [DOI] [PMC free article] [PubMed] [Google Scholar]
- 14.Optical Tomography Group, SUNY Downstate Medical Center, “fNIRS data analysis environment,” 2017, http://www.nitrc.org/projects/fnirs_downstate (4 September 2017).
- 15.Boas D. A., et al. , “Twenty years of functional near-infrared spectroscopy: introduction for the special issue,” NeuroImage 85, 1–5 (2014). 10.1016/j.neuroimage.2013.11.033 [DOI] [PubMed] [Google Scholar]
- 16.Huppert T., “Introduction to the NIRS-toolbox,” in 4th Biennial Meeting of the Society for Functional Near Infrared Spectroscopy (fNIRS), p. 215 (2016). [Google Scholar]
- 17.Tak S., Ye J. C., “Statistical analysis of fNIRS data: a comprehensive review,” NeuroImage 85(Part 1), 72–91 (2014). 10.1016/j.neuroimage.2013.06.016 [DOI] [PubMed] [Google Scholar]
- 18.Tak S., et al. , “Dynamic causal modelling for functional near-infrared spectroscopy,” NeuroImage 111, 338–349 (2015). 10.1016/j.neuroimage.2015.02.035 [DOI] [PMC free article] [PubMed] [Google Scholar]
- 19.Rajapakse J. C., Zhou J., “Learning effective brain connectivity with dynamic bayesian networks,” NeuroImage 37, 749–760, (2007). 10.1016/j.neuroimage.2007.06.003 [DOI] [PubMed] [Google Scholar]
- 20.Montero-Hernández S. A., et al. , “Causal probabilistic graphical models for decoding effective connectivity in functional near infrared spectroscopy,” in 29th Int. Florida Artificial Intelligence Research Society (FLAIRS) Conf., Miami, Florida, pp. 686–689 (2016). [Google Scholar]
- 21.James D. R. C., et al. , “Cognitive burden estimation for visuomotor learning with fNIRS,” in Int. Conf. on Medical Image Computing and Computer-Assisted Intervention, Vol. 6363, pp. 319–326 (2010). [DOI] [PubMed] [Google Scholar]
- 22.Leff D. R., et al. , “Functional near infrared spectroscopy in novice and expert surgeons: a manifold embedding approach,” in Int. Conf. On Medical Image Computing and Computer-Assisted Intervention (MICCAI), Vol. 4792, pp. 270–277 (2007). [DOI] [PubMed] [Google Scholar]
- 23.Orihuela-Espina F., et al. , “ICNA: a software tool for manifold embedded based analysis of functional near infrared spectroscopy data,” in 15th Annual Meeting of the Organization of Human Brain Mapping (OHBM), San Francisco, California: (2009). [Google Scholar]
- 24.Paggetti G., et al. , “The role of the posterior parietal cortex in stereopsis and hand-eye coordination during motor task behaviours,” Cognit. Process. 16(2), 177–190 (2015). 10.1007/s10339-014-0641-1 [DOI] [PubMed] [Google Scholar]
- 25.Dean A., Voss D., Design and Analysis of Experiments, Springer Texts in Statistics, Springer, New York: (2000). [Google Scholar]
- 26.Maki A., et al. , “Spatial and temporal analysis of human motor activity using non-invasive NIR topography,” Med. Phys. 22(12), 1997–2005 (1995). 10.1118/1.597496 [DOI] [PubMed] [Google Scholar]
- 27.Culver J. P., et al. , “Optimization of optode arrangements for diffuse optical tomography: a singular-value analysis,” Opt. Lett. 26(10), 701–703 (2001). 10.1364/OL.26.000701 [DOI] [PubMed] [Google Scholar]
- 28.Dehghani H., et al. , “Depth sensitivity and image reconstruction analysis of dense imaging arrays for mapping brain function with diffuse optical tomography,” Appl. Opt. 48(10), D137–D143 (2009). 10.1364/AO.48.00D137 [DOI] [PMC free article] [PubMed] [Google Scholar]
- 29.Eggebrecht A. T., et al. , “Mapping distributed brain function and networks with diffuse optical tomography,” Nat. Photonics 8, 448–454 (2014). 10.1038/nphoton.2014.107 [DOI] [PMC free article] [PubMed] [Google Scholar]
- 30.Cope M., Delpy D. T., “System for long term measurement of cerebral blood and tissue oxygenation on newborn infants by near infrared transillumination,” Med. Biol. Eng. Comput. 26, 289–294 (1988). 10.1007/BF02447083 [DOI] [PubMed] [Google Scholar]
- 31.Duncan A., et al. , “Optical pathlength measurements on adult head, calf and forearm and the head of the newborn infant using phase resolved optical spectroscopy,” Phys. Med. Biol. 40, 295–304 (1995). 10.1088/0031-9155/40/2/007 [DOI] [PubMed] [Google Scholar]
- 32.Essenpreis M., et al. , “Spectral dependence of temporal point spread functions in human tissues,” Appl. Opt. 32(4), 418–425 (1993). 10.1364/AO.32.000418 [DOI] [PubMed] [Google Scholar]
- 33.Orihuela-Espina F., et al. , “Quality control and assurance in functional near infrared spectroscopy (fNIRS) experimentation,” Phys. Med. Biol. 55, 3701–3724 (2010). 10.1088/0031-9155/55/13/009 [DOI] [PubMed] [Google Scholar]
- 34.Peña M., et al. , “Sounds and silence: an optical topography study of language recognition at birth,” Proc. Natl. Acad. Sci. U.S.A. 100(20), 11702–11705 (2003). 10.1073/pnas.1934290100 [DOI] [PMC free article] [PubMed] [Google Scholar]
- 35.Sato H., et al. , “Wavelet analysis for detecting body movement artifacts in optical topography signals,” NeuroImage 33, 580–587 (2006). 10.1016/j.neuroimage.2006.06.028 [DOI] [PubMed] [Google Scholar]
- 36.Orihuela-Espina F., et al. , “Semi-virtual registration and virtual channel synthetization in fNIRS imaging,” in 3rd Functional Infrared Spectroscopy (fNIRS), Montreal: (2014). [Google Scholar]
- 37.Jurcak V., Tsuzuki D., Dan I., “10/20, 10/10 and 10/5 system revisited: their validity as a relative head-surface-based positioning systems,” NeuroImage 34, 1600–1611 (2007). 10.1016/j.neuroimage.2006.09.024 [DOI] [PubMed] [Google Scholar]
- 38.Orihuela-Espina F., et al. , “Influence of temporal window selection on activation detection variation for fNIRS,” in 16th Annual Meeting of the Organization for Human Brain Mapping (OHBM) (2010). [Google Scholar]
- 39.Leff D. R., et al. , “Assessment of the cerebral cortex during motor task behaviours in adults: a systematic review of functional near infrared spectroscopy (fNIRS) studies,” NeuroImage 54, 2922–2936 (2011). 10.1016/j.neuroimage.2010.10.058 [DOI] [PubMed] [Google Scholar]
- 40.Uludag K., et al. , “Cross talk in the Lambert-Beer calculation for near-infrared wavelengths estimated by Monte Carlo simulations,” J. Biomed. Opt. 7(1), 51–59 (2002). 10.1117/1.1427048 [DOI] [PubMed] [Google Scholar]
- 41.Ávila-Sansores S. M., et al. , “The topological brain; a hypothesis about brain function,” in 2nd Int. Conf. on Mathematical NeuroScience (ICMNS), p. 1 (2016). [Google Scholar]
- 42.Friston K. J., et al. , “Functional topography: multidimensional scaling and functional connectivity in the brain,” Cereb. Cortex 6, 156–164 (1996). 10.1093/cercor/6.2.156 [DOI] [PubMed] [Google Scholar]
- 43.Carreira-Perpiñán M. A., “A review of dimension reduction techniques,” Technical Report CS-96-09, University of Sheffield; (1997). [Google Scholar]
- 44.Van Der Maaten L., Postma E., Van den Herik J., “Dimensionality reduction: a comparative review,” Technical Report, Tilburg Centre for Creative Computing, Tilburg University, TiCC TR 2009–005 (2009). [Google Scholar]
- 45.Bullmore E., Sporns O., “Complex brain networks: graph theoretical analysis of structural and functional systems,” Nat. Rev. Neurosci. 10, 186–198 (2009). 10.1038/nrn2575 [DOI] [PubMed] [Google Scholar]
- 46.Bassett D. S., Bullmore E., “Small-world brain networks,” The Neuroscientist 12, 512–523 (2006). 10.1177/1073858406293182 [DOI] [PubMed] [Google Scholar]
- 47.Herrera-Vega J., Palacios C. G. T., Orihuela-Espina F., “Neuroimaging with functional near infrared spectroscopy: from formation to interpretation,” Infrared Phys. Technol. 85, 225–237 (2017). 10.1016/j.infrared.2017.06.011 [DOI] [Google Scholar]
- 48.Carlsson G., “Topology and data,” Bull. Am. Math. Soc. 46(2), 255–308 (2009). 10.1090/S0273-0979-09-01249-X [DOI] [Google Scholar]
- 49.Orihuela-Espina F., et al. , “Imperial College Near Infrared Spectroscopy Neuroimaging Analysis (ICNNA),” 2017, http://hamlyn.doc.ic.ac.uk/icnna/ (4 September 2017). [DOI] [PMC free article] [PubMed]


