

Significance
The intricate structures of RNA molecules are crucial to their biological functions but have been difficult to accurately characterize. Multidimensional chemical-mapping methods improve accuracy but have so far involved painstaking experiments and reliance on secondary-structure prediction software. A methodology called M2-seq now lifts these limitations. Mechanistic studies clarify the origin of serendipitous M2-seq–like signals that were recently discovered but not correctly explained and also provide mutational strategies that enable robust M2-seq for new RNA transcripts. The method detects dozens of Watson–Crick helices across diverse RNA folds in vitro and within frog egg extract, with a low false-positive rate (<5%). M2-seq opens a route to unbiased discovery of RNA structures in vitro and beyond.
Keywords: RNA structure modeling, chemical mapping, neural network, mutational profiling, Xenopus egg extract
Abstract
Despite the critical roles RNA structures play in regulating gene expression, sequencing-based methods for experimentally determining RNA base pairs have remained inaccurate. Here, we describe a multidimensional chemical-mapping method called “mutate-and-map read out through next-generation sequencing” (M2-seq) that takes advantage of sparsely mutated nucleotides to induce structural perturbations at partner nucleotides and then detects these events through dimethyl sulfate (DMS) probing and mutational profiling. In special cases, fortuitous errors introduced during DNA template preparation and RNA transcription are sufficient to give M2-seq helix signatures; these signals were previously overlooked or mistaken for correlated double-DMS events. When mutations are enhanced through error-prone PCR, in vitro M2-seq experimentally resolves 33 of 68 helices in diverse structured RNAs including ribozyme domains, riboswitch aptamers, and viral RNA domains with a single false positive. These inferences do not require energy minimization algorithms and can be made by either direct visual inspection or by a neural-network–inspired algorithm called M2-net. Measurements on the P4–P6 domain of the Tetrahymena group I ribozyme embedded in Xenopus egg extract demonstrate the ability of M2-seq to detect RNA helices in a complex biological environment.
Inference of RNA structures using experimental data is a crucial step in understanding RNA’s biological functions throughout living organisms. Chemical-mapping methods have the potential to reveal RNA structural features in situ by probing which nucleotides are protected from attack by chemical modifiers. The resulting experimental data can be used to guide secondary-structure modeling by computational algorithms, raising the prospect of transcriptome-wide RNA structure determination (1, 2).
Despite these advances, the accuracy of RNA structure inference through chemical mapping and sequencing remains under question (3–8). For example, models of the 9-kb HIV-1 RNA genome have been repeatedly revised with updates to the selective 2′-OH acylation by primer extension (SHAPE) protocol, data processing, and computational assumptions (2, 9–11), and the majority of this RNA’s helices remain uncertain. Even for small RNA domains, SHAPE and dimethyl sulfate (DMS) (methylation of N1 and N3 atoms at A and C) have produced misleading secondary structures for ribosomal domains and blind modeling challenges that have been falsified through crystallography or mutagenesis (3, 7, 12, 13). In alternative approaches based on photoactivated cross-linkers, many helix detections appear to be false positives, based on ribosome data in vitro and in vivo (14, 15).
The confidence and structural accuracy of chemical-mapping methods can be improved by applying perturbations to the RNA sequence before chemical modification. In the mutate-and-map strategy, mapping not just the target RNA sequence but also a comprehensive library of point mutants reveals which nucleotides respond to perturbations at every other nucleotide, enabling direct inference of pairs of residues that interact to form structure (16, 17). The resulting models have been consistently accurate at nucleotide resolution in RNA puzzles and other blind tests for riboswitches and ribozymes solved by crystallography, with helix recovery rates of >90% and false-positive rates under 10%, with errors typically involving minor register shifts or edge base pairs (2, 18). However, the mutate-and-map approach has required synthesis and parallel mapping of many mutant RNAs and, so far, has only been applied to RNAs under 200 nt in length probed in vitro.
Here, we introduce mutate-and-map read-out by next-generation sequencing (M2-seq), which carries out RNA preparation, mutation, and mapping in a one-pot experiment. Tests on ribozyme domains, viral domains, and riboswitch aptamers that form diverse RNA structures evaluate the ability of M2-seq to detect Watson–Crick base pairs in vitro, with signals that can be confirmed through visual inspection. We introduce a simple algorithm, M2-net, that automatically recovers these helices with a low false-positive rate (<5%) and without register shifts that have been previously problematic for chemical-mapping approaches. As a proof-of-concept for more complex biological experiments, we demonstrate direct detection of the majority of helices in the P4–P6 domain of the group I Tetrahymena ribozyme embedded in biologically active eukaryotic cell extract, and describe prospects for further applications in RNA structural biology.
Results
Workflow of M2-Seq.
The M2-seq workflow tested herein is summarized in Fig. 1. First, DNA templates were prepared from PCR assembly (short constructs) or PCR from plasmids (long constructs). To ensure mutate-and-map signals, we prepared samples with a low frequency (∼10−3 per nucleotide) of additional mutations as described previously (16) or using error-prone PCR (19). We also prepared samples without additional mutations to probe unexplained data correlations observed in recent high-DMS experiments (2, 20). Then, we transcribed RNAs from these DNA pools, prepared them into the desired state (e.g., Mg2+-induced folding in vitro), and modified the RNA with DMS. Reverse transcription was performed under mutational profiling conditions (with SuperScript II and Mn2+) to install mutations into cDNAs across from DMS modifications (21). The full-length cDNAs were amplified by PCR, and the resulting libraries were sequenced by paired-end Illumina sequencing. An initial M2-seq map was generated by recording the positions of all of the correlated mutations. The data were displayed in a 2D heatmap visualization analogous to that used for prior mutate-and-map experiments: a 1D chemical-mapping profile was estimated for each single-nucleotide variant in the RNA, each profile was normalized by the total number of reads with a mutation at that position, and the profiles were stacked according to the mutation. As described below and in SI Results, a more sophisticated analysis is possible that attempts to separate mutations based on their expected source (e.g., those installed during library preparation vs. those introduced later by reverse transcription across from chemical modifications). However, we will mainly describe results with a simple mutation-counting approach, which provides an initial unbiased visualization.
Fig. 1.

Workflow for M2-seq, mutate-and-map read-out by next-generation sequencing. DNA template is generated by PCR assembly of oligonucleotides, PCR from a plasmid, or error-prone PCR, potentially introducing deletions (white) or mutations (gold). Then, RNA is transcribed (potentially introducing further mutations, cyan), folded, and DMS-modified. Reverse transcription is performed under conditions that favor mutational read-through of DMS-modified nucleotides, recording those positions as mutations (magenta), and cDNAs are PCR-amplified to generate double-stranded DNA library. Libraries are subjected to next-generation sequencing, and resulting reads are analyzed by demultiplexing, alignment to reference sequences, and correlated mutation counting to generate an M2-seq dataset (simulated here). Double-stranded RNA helices give rise to cross-diagonal features in these maps that can be automatically recognized by M2-net and confirmed visually.
Mutational Profiling Provides Precise M2-Seq Information in a Single-Pot Experiment.
We first confirmed that applying the mutational profiling readout to single-mutant libraries would give secondary-structure signals similar to capillary electrophoresis (CE)-based M2, which relies on reverse-transcription termination at modified residues rather than mutational read-through. For this comparison, we investigated the P4–P6 domain of the 158-nt Tetrahymena group I ribozyme (Fig. 2A), a widely used model system for tests of RNA chemical-mapping methods (2, 3, 22). In addition, we prepared DNA templates for the wild-type RNA and 158 point mutants of each nucleotide to its complement (16) and then pooled these molecules before the transcription step, so that all subsequent steps could be carried out in one tube. The M2-seq data for this initial pooled-mutation experiment are shown in Fig. 2B, after applying the pipeline described in Fig. 1 to generate 1D chemical mapping reactivity profiles for each mutation position.
Fig. 2.

M2-seq on the P4–P6 domain of Tetrahymena group I ribozyme. (A) Secondary-structure diagram of P4–P6. (B–D) Two-dimensional datasets from M2-seq on pooled mutate-and-map library (B), on RNA with mutations installed during error-prone PCR of DNA template (C), and with no intentionally installed mutations (D), all probed with DMS mapping. Each row gives frequencies of observing mutations at every position given a mutation at the row position, as indicated by the strong diagonal (Top Left to Bottom Right). In B–D, black-lined outsets highlight M2-seq signals in the P6a–P6b region; gray-lined outsets show average and maximum observed frequencies of each type of mutation in control RNA samples without DMS treatment. In A and B, colored lines and labels mark correspondence of structure and map signals for Watson–Crick helices, the tetraloop/tetraloop receptor contact (solid purple), and exposure of tetraloop from mutations outside its receptor (dashed purple).
Analysis of the mutational spectrum in the no-DMS samples confirmed that we had introduced the desired sequence changes at the level of ∼1/158 (gray-lined outset, Fig. 2A). Furthermore, as expected, the M2-seq data (Fig. 2B) exhibit strong signals for structural elements, consistent with prior mutate-and-map data based on CE (Fig. S1). For example, M2-seq signals marking the pair C229/G245 and other pairs in the P6b helix create a visible cross-diagonal, as in prior CE data (black-lined outset, Fig. 2B). Base pairs for P4 and P5 (orange in Fig. 2B), P5a (blue), P5b (red), and P6a-b (green) are clearly visible and agree with crystallographic analysis of the RNA (Fig. 2A). Similarly, punctate signals reflecting the tetraloop/tetraloop receptor (TL/TLR) tertiary contact, such as between A153 and C223, also appear in both datasets. Short helices that were not observed in CE-based mutate-and-map measurements, such as the P5c helix (Fig. S1), also did not give extended cross-diagonal stripes in the M2-seq data. As expected, the no-DMS control samples did not show M2-seq signal and consisted primarily of a uniform 1D background (Fig. S2A).
Fig. S1.

CE-based mutate-and-map data for P4–P6. Data correspond to RMDB ID TRP4P6_DMS_0004.
Fig. S2.

No-modification M2-seq datasets for P4–P6 from (A) pooled mutant library and (B) background mutations experiments. No 2D signal is detected without DMS treatment.
We further tested that separate preparation of mutants was not necessary to give clear M2-seq signals of base pairs. We used error-prone PCR to generate the DNA templates for RNA transcription, giving mutations at a mean frequency of ∼0.5% and mostly involving U-to-C, C-to-U, A-to-G, and G-to-A transitions (gray-lined outset, Fig. 2C), as expected (23). Despite having a different mutational spectrum and giving signals at different specific base pairs, we observed M2-seq signals for the same helical elements as in the pooled single mutant library experiment as well as for the TL/TLR tertiary contact (Fig. 2C; fine differences are better visible in black-lined magnification outsets of P6a–P6b region). The use of error-prone PCR simplified the protocol: every step of the M2-seq experiment, from DNA synthesis to final reverse transcription and sequencing, could be carried out in a single tube.
We also observed M2-seq signal in samples without mutations intentionally installed during error-prone PCR (Fig. 2D). We had previously noted this pattern in published sequencing data for high-DMS-modified P4–P6 RNA (2) (Fig. S3) and speculated that DMS methylation of the N1 and N3 atoms of G and U residues, respectively, could disrupt Watson–Crick base pairing, expose C and A partners, respectively, and produce a 2D signal (2, 20). Paradoxically, however, the modification reaction pH of 7.0 is too low to cause significant deprotonation at these atoms to allow DMS methylation to occur (∼10−4 modification rate expected under our conditions). Furthermore, when we applied the no-mutation method to another large, highly structured RNA, the Didymium iridis GIR1 lariat-capping ribozyme, we observed no clear cross-diagonal stripes corresponding to long-range RNA base pairs (Fig. 3A).
Fig. S3.

Mutate-and-map signal visible in independent work. Data are for the P4–P6 domain of Tetrahymena group I intron, as in main text Fig. 2, but are derived from applying the computational analysis procedure of this work to sequencing data deposited in high-DMS RING-MaP study (21).
Fig. 3.

M2-seq on the GIR1 lariat-capping ribozyme requires seeded mutations. M2-seq maps for DMS-treated GIR1 ribozyme prepared (A) without any intentionally installed mutations and (B) from templates seeded with mutations through error-prone PCR. Colored text labels indicate helices for which cross-diagonal helix signatures become visible and detectable by M2-net.
Mechanism of “Background” RNA Base Pair Signals.
To understand whether M2-seq signals could be enhanced for the GIR1 ribozyme and other RNAs, we carried out extensive experiments to understand the mechanism for the signal in the P4–P6 RNA, varying transcription templates, purification, and modification conditions. A complete description of this work is given in SI Results and Figs. S4–S7; a short summary follows. Briefly, we were able to discriminate between two models for how M2-seq signals might arise without intentionally preinstalled mutations. In the “double-DMS hit” model noted above, these Watson–Crick base pair signals are due to rare DMS modifications (∼10−3 per nucleotide) that occur at transiently deprotonated U/G nucleotides, resulting in—or caused by—DMS modification at partner A/C nucleotides (2, 20). In an alternative “accidental mutation” model, the signals are due to background mutations (also up to ∼10−3 per nucleotide) introduced as errors during DNA and RNA synthesis. In the folded RNA, these mutations would expose their structural partners to DMS, as with standard mutate-and-map methods.
Fig. S4.

Mutation and conversion spectra for DNA template and unmodified or DMS-modified RNA. (A) Mutation spectra for P4–P6 in each condition, showing frequency of each type of mutation at each sequence position. (B) Conversion spectra for P4–P6 at different stages of protocol, showing either average or maximum frequency of each type of mutation across the sequence. (Right) Source of DNA template and modification condition.
Fig. S7.

Titration of DMS dose to discriminate one-hit vs. two-hit mechanisms. Pairs of residues analyzed are annotated in purple on P4–P6 secondary structure and M2-seq dataset. For each pair of residues (1–8), the plot at the Left shows the following: (i) a scatter plot of the fraction of reads with a mutation at both positions at each DMS modification rate (red circles, with replicates of standard DMS modification condition shown as X and diamond), (ii) a fit to these points (red line), and (iii) the product of linear fits to the fraction of reads with a mutation at each member of the residue pair (blue line). The bar plots at Right show the fraction of reads with a mutation at both positions that display each type of mutation from the native residue, for the dataset shown in Fig. 2D.
Favoring the accidental mutation model, differences in the M2-seq signal with different DNA preparations (PCR assembly of oligonucleotides, PCR from a plasmid stock, and synthesis in other laboratories; Fig. 2 and Fig. S3) implicated background mutations introduced in the different DNA synthesis methods, and were then confirmed by sequencing the DNA templates used for those M2-seq experiments (Figs. S4 and S5). Additional M2-seq base pair signals were traced to transitions introduced during RNA synthesis by T7 RNA polymerase and confirmed by direct sequencing of the RNA before DMS modification (gray-framed outsets, Fig. 2 and Figs. S4 and S5). Disfavoring the double-DMS model, increasing the pH, which should enhance transient deprotonation of U/G and subsequent DMS modification, did not increase the M2-seq base pairing signal except at high pH. At pH 10.0, a different, less precise signal was observed (Fig. S6). Finally, DMS dose–response measurements revealed linear dependence of the Watson–Crick base pair signals with DMS dose, as predicted by the accidental mutation model but not the double-DMS hit model, which predicts a quadratic dependence on DMS dose (Fig. S7).
Fig. S5.

M2-seq signal and mutation spectra for additional experimental conditions. (A–D) M2-seq signal for DMS-modified RNA (A) transcribed from DNA template prepared from plasmid, (B) transcribed from DNA template prepared with error-prone PCR, (C and D) transcribed from PCR-assembled DNA template and PAGE-purified with UV-shadowing at ≥20 cm (C) and at ≤5 cm (D) (SI Methods). (E) Mutation spectra for RNA from indicated preparation with either no modification or DMS modification.
Fig. S6.

M2-seq data and mutation spectra for P4–P6 at varying reaction pH. (A, Left) M2-seq signal for DMS-modified RNA in standard buffer (300 mM Na-cacodylate, pH 7.0, and 10 mM MgCl2); data same as Fig. 2D. (Right) M2-seq signal for DMS-modified RNA in 300 mM Na-CHES, pH 10.0, and 10 mM MgCl2. (B) Mutation spectra for RNA in indicated buffer with either no modification or DMS modification.
Taken together, these studies traced the primary mechanism of direct base pair detection in DMS experiments to the occurrence of accidental mutations during DNA and RNA synthesis and not to double-DMS hits. Because these mutations occur in a heterogeneous and noncontrolled manner throughout the RNA molecule, they only allow detection of Watson–Crick pairs in special molecules with particular preparations. We therefore favored using error-prone PCR to seed in mutations more uniformly across transcripts. For example, in the case of the GIR1 lariat-capping ribozyme, M2-seq signals highlighting most of the RNA’s helices became visible when templates were prepared with error-prone PCR (Fig. 3B). Even for the P4–P6 RNA, use of error-prone PCR allowed M2-seq detection of the P4–P6 helices with nearly an order of magnitude fewer sequencing reads than a protocol relying only on accidental mutations (Fig. S8).
Fig. S8.

Estimating M2-seq sequencing requirements. M2-seq datasets for the P4–P6 RNA were resampled with replacement to simulate sequencing runs with lower statistics. Intentional installation of mutations through error-prone PCR (closed circles) or pooling of separately prepared mutant libraries (closed squares) reduces sequencing requirements compared with use of background mutations (open circles). Detections were carried out automatically with M2-net. Curves shown are for P5b (magenta; base pairs between 141–149 and 154–162); P5a (blue; base pairs between 136–138 and 180–182); and P6a (green; base pairs between 220–223 and 250–253).
Automated Detection of Helices Across Diverse RNA Structures.
After testing the mechanism of the M2-seq signal, we evaluated the general applicability of the method across diverse structured RNA molecules. We chose several RNAs that have challenged prior structure modeling efforts: the P4–P6 RNA, the catalytic domain of RNase P, and the thiamine pyrophosphate (TPP) riboswitch aptamer, which were the three test cases for an earlier RING-MaP study (20, 21); and the GIR1 ribozyme, riboswitch aptamers for adenosylcobalamin (AdoCbl) and cyclic–di-AMP, and an Xrn1-exonuclease-resistant domain from the Zika virus, four targets of the RNA-puzzle community-wide trials whose secondary structures were particularly challenging for most groups and algorithms to model (Tables S1 and S2) (12, 13, 24). M2-seq gave visually apparent signals for helices in all of these cases (Fig. 4 and Fig. S9). These helices included long-range interactions connecting the most sequence-distal ends of RNA (P1 in the GIR1 and RNase P molecules), pseudoknots (P7 in GIR1; P2 in RNase P), long helices involved in tertiary contacts (9-bp P5b in P4–P6; 10-bp P8 in the AdoCBL riboswitch), and short helices (P3 in the TPP riboswitch). These signals were particularly apparent when we displayed maps of Z-scores, which measure how much the DMS signal at each nucleotide is enhanced over the mean at that position across all mutant variants, normalized to the standard deviation at that position. The quality of these data led us to revisit automated Z-score–based helix detection methods developed in early work on the mutate-and-map method (25, 26). Indeed, we discovered that our visual analysis could be automatically reproduced by a simple pipeline of Z-score estimation, a convolutional filter highlighting “cross-diagonal” stripes, data symmetrization, and a filter for each nucleotide having at most one partner (SI Methods; colored annotations in Fig. 4). We call this analysis M2-net, due to its similarity to multilayer convolutional neural nets that are now in wide use for image classification (27).
Table S1.
Comparison of secondary structure modeling approaches
| RNA name | Length, nt | No. of helices* | Fold | Fold + DMS† | Fold + M2‡ | Fold + DMS† + M2‡ | ShapeKnots | ShapeKnots + DMS† | ShapeKnots + M2‡ | ShapeKnots + DMS† + M2‡ | M2-net | |||||||||
| TP | FP | TP | FP | TP | FP | TP | FP | TP | FP | TP | FP | TP | FP | TP | FP | TP | FP | |||
| P4–P6 domain | 160 | 8 | 8 | 1 | 8 | 1 | 7 | 1 | 8 | 1 | 8 | 1 | 8 | 1 | 7 | 1 | 8 | 1 | 7 | 0 |
| GIR1 ribozyme | 188 | 11 | 6 | 6 | 9 | 2 | 9 | 2 | 10 | 0 | 6 | 5 | 9 | 1 | 10 | 2 | 11 | 0 | 5 | 0 |
| RNase P C domain | 265 | 13 | 6 | 8 | 9 | 5 | 9 | 3 | 10 | 2 | 6 | 8 | 9 | 5 | 11 | 2 | 11 | 1 | 10 | 1 |
| AdoCbl riboswitch | 168 | 10 | 6 | 4 | 7 | 1 | 9 | 0 | 10 | 0 | 6 | 4 | 7 | 1 | 9 | 0 | 10 | 0 | 4 | 0 |
| ydaO riboswitch | 124 | 7 | 5 | 2 | 6 | 0 | 5 | 2 | 6 | 0 | 5 | 3 | 6 | 1 | 5 | 2 | 6 | 1 | 2 | 0 |
| Zika xrRNA | 71 | 5 | 4 | 1 | 4 | 1 | 3 | 2 | 3 | 2 | 4 | 1 | 5 | 0 | 3 | 2 | 4 | 1 | 2 | 0 |
| TPP riboswitch | 80 | 6 | 5 | 0 | 6 | 0 | 4 | 0 | 6 | 0 | 5 | 0 | 6 | 0 | 4 | 0 | 6 | 0 | 3 | 0 |
| Total | 1,056 | 60 | 40 | 22 | 49 | 10 | 46 | 10 | 53 | 5 | 40 | 22 | 50 | 9 | 49 | 9 | 56 | 4 | 33 | 1 |
| False negative rate, % | 33.3 | 18.3 | 23.3 | 11.7 | 33.3 | 16.7 | 18.3 | 6.7 | 45 | |||||||||||
| False positive rate, % | 35.5 | 16.9 | 17.9 | 8.6 | 35.5 | 15.3 | 15.5 | 6.7 | 2.9 | |||||||||||
| Sensitivity, % | 66.7 | 81.7 | 76.7 | 88.3 | 66.7 | 83.3 | 81.7 | 93.3 | 55 | |||||||||||
| PPV, % | 64.5 | 83.1 | 82.1 | 91.4 | 64.5 | 84.7 | 84.5 | 93.3 | 97.1 | |||||||||||
Table S2.
RNA sequences and DNA primers
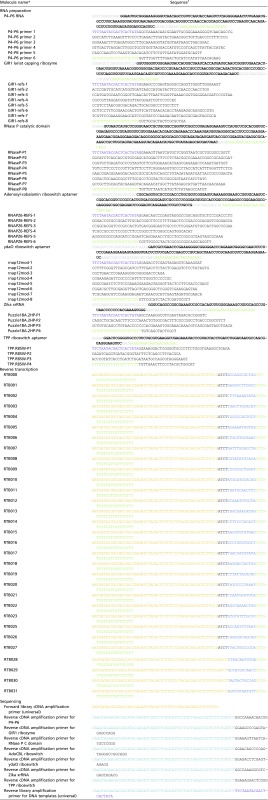 |
Fig. 4.

M2-seq recovers helices across diverse RNA folds. Each panel shows crystallographic secondary structures and Z-score–transformed maps (square graphs) with colored labels (on both display items) marking helices and multihelix domains automatically identified by M2-net analysis. Differences in edge base pairs are not shown. Data sets are as follows: (A) P4–P6 domain of Tetrahymena ribozyme (background mutations), (B) GIR1 lariat-capping ribozyme (RNA-puzzle 5; error-prone PCR), (C) ribonuclease P catalytic domain (background mutations), and (D) adenosylcobalamin riboswitch aptamer (RNA-puzzle 6; error-prone PCR). Data for three additional RNAs of smaller length are given in Fig. S9. Table S3 compiles modeled structures.
Fig. S9.

M2-seq recovers helices across diverse RNA folds—additional data. Each panel shows crystallographic secondary structures (Left) and Z-score-transformed maps (Right), with colored labels (both panels) marking helices and multihelix domains automatically identified by M2-net analysis. Data sets are as follows: (A) ydaO cyclic–di-AMP riboswitch aptamer (RNA-puzzle 12; background mutations), (B) Zika Xrn1-resistant RNA (RNA-puzzle 18; background mutations), and (C) TPP riboswitch aptamer (error-prone PCR). Fig. 4 in the main text gives data for four larger RNA molecules.
M2-net detected 34 of helices with length greater than 2 in these RNAs (Table 1). A total of 33 of these 34 helices matched the crystallographic or conventional structure available in the literature, and none of these cases involved register shifts that have been problems in prior methods (2, 7). Despite the observation of other weak signals in these data that do not correspond to helices (Fig. 4), M2-net detects only a single false positive, an altP19c helix predicted for the catalytic domain of RNase P that disagrees with the tip of the P19 domain presumed in the conventional secondary structure of this molecule (28). The region including these helices has not been directly visualized by crystallographic analysis (28). Compensatory mutagenesis experiments indicate that the region does form the predicted alt-P19 in solution (Fig. S10); we still count it as a false positive here to be conservative.
Table 1.
Recovery of helices across seven complex RNA folds from M2-seq data
| RNA | No. of helices* | ShapeKnots + DMS + M2† | M2-net | ||
| TP | FP | TP | FP | ||
| P4–P6 domain | 8 | 8 | 1 | 7 | 0 |
| GIR1 ribozyme | 11 | 11 | 0 | 5 | 0 |
| RNase P C domain | 13 | 11 | 1 | 10 | 1 |
| AdoCbl riboswitch | 10 | 10 | 0 | 4 | 0 |
| ydaO riboswitch | 7 | 6 | 1 | 2 | 0 |
| Zika xrRNA | 5 | 4 | 1 | 2 | 0 |
| TPP riboswitch | 6 | 6 | 0 | 3 | 0 |
| Total | 60 | 56 | 4 | 33 | 1 |
| False-negative rate, % | 6.7 | 45.0 | |||
| False-positive rate, % | 6.7 | 2.9 | |||
| Sensitivity, % | 93.3 | 55.0 | |||
| PPV, % | 93.3 | 97.1 | |||
FP, false positives; PPV, positive predictive value; TP, true positives.
Helices with length greater than two Watson–Crick (or G•U wobble) base pairs.
Fig. S10.

Compensatory mutagenesis supports alternative RNase P helix modeled by M2-seq. (A) Literature secondary structure and alternative secondary structure predicted by M2-seq analysis, in the P19 region of ribonuclease P catalytic domain. (B and C) Single mutations and compensatory double mutations, evaluated by DMS (B) and SHAPE (C) mapping on the RNase P C domain with capillary electrophoresis readout (48). As a control, disruptions throughout structure from single mutations are rescued by compensatory mutation for each of the four base pairs of P19b, shared in both secondary structure models. Analogous experiments show no rescue for the three base pairs of P19 but do show rescue for altP19c. Note in particular the mapping profiles in the P19 region itself (orange bar). Gray bar marks region with high uncertainty due to high background reverse transcription stops.
In prior work, we and others have used the RNAstructure free-energy minimization software, guided by mutate-and-map or conventional 1D chemical mapping data, to “fill in” helices not directly detected by experiments (12, 20, 26). In our M2-seq benchmark, the ShapeKnots algorithm of RNAstructure guided by the M2-seq and 1D DMS data indeed increases the number of recovered crystallographic helices from 34 to 56 (out of 60 helices; 93% sensitivity). However, the higher recovery is at the expense of more false positives: 4 out of a total of 60 predicted helices are incorrect (Table 1; Table S1 also includes modeling without pseudoknots and without DMS data). The resulting false-discovery rate (7%) is similar to the rate seen in prior mutate-and-map benchmarks (16). For new RNAs where false positives would require expensive subsequent experiments to falsify, M2-net (with a false-positive rate of <5%) may be preferred over RNAstructure analysis.
RNA Base Pair Detection in Xenopus Egg Extract.
The simplicity of the “one-pot” M2-seq protocol and the positive predictive value of the M2-net analysis motivated us to test the method in a more complex biological environment than the in vitro folding conditions typically used in benchmarking new chemical-mapping methods. We mixed the P4–P6 RNA into undiluted extract from metaphase-arrested Xenopus eggs, a widely used medium for reconstituting eukaryotic biological processes (29). The impact of this complex medium, compared with in vitro conditions, was apparent in a modification signature that arose in extracto but not in vitro, even in the absence of DMS treatment: A’s across the transcript were mutated to G (Fig. 5A). These modifications likely reflect the activity of the ADAR enzyme, which targets adenosines near double-stranded RNA helices for deamination to inosine, which is, in turn, read out as guanosine by reverse transcriptase (30, 31). Even with the complexities of the Xenopus egg extract environment, the 2D M2-seq data gave unambiguous signals for the P4–P6 RNA secondary structure. While these signals were less visually clear than in our in vitro experiments (Fig. 5B), they became more apparent when the data were viewed as Z-score maps (Fig. 5C). Despite an increase in background, partially due to A-to-I mutations, M2-net detected five of the eight helices of P4–P6 and no false positives (colored labels in Fig. 5C).
Fig. 5.

M2-seq detects P4–P6 RNA base pairs in Xenopus egg extract. (A) Mutations across the P4–P6 transcript consistent with adenosine-to-inosine edits after exposure to undiluted Xenopus egg extract for 30 min (no DMS treatment); difference data with RNA incubated in vitro are shown. M2-seq data for P4–P6 RNA from templates prepared by error-prone PCR shown as (B) M2-seq map and then (C) transformed into Z-scores. Helix signatures automatically detected by M2-net are marked with colored labels.
SI Results
We describe here further experiments to dissect the mechanism by which M2-seq signals were generated in high-DMS experiments even without intentionally installed mutations at G’s or U’s.
Testing Whether M2-Seq Signal Arises from Accidental Mutations During DNA or RNA Preparation.
Detailed comparison of the M2-seq signals in our data compared with the independently collected data in ref. 21 showed differences in the exact G’s and U’s that gave the strongest M2-seq signals. Since correlated mutations at G’s or U’s and their base pairing partners can occur if the G and U mutations are introduced prior to RNA-folding and chemical-modification steps, we first investigated the DNA and RNA preparation stages of the protocol. These preparation steps include the initial generation of the DNA template; transcription of the RNA from this template; and purification of the RNA. We sought explanations for mutational events that occur at a frequency at or above 10−3 per nucleotide, similar to the rate in our explicitly mutated library (Fig. 2B).
We first tested whether mutations were introduced in our DNA preparation procedure for the “unmutated” library (Fig. 2D). Our protocol used PCR assembly from small, chemically synthesized oligonucleotides to prepare the template for in vitro transcription (37), whereas other laboratories started with cloned plasmids. Chemically synthesized oligonucleotides can harbor errors, especially deletions, which can be propagated through PCR assembly (38). When we directly sequenced the DNA template used for transcription of the P4–P6 RNA, we found deletions at several positions throughout the sequence occurring with rates reaching up to 4 × 10⁻³. (For comparison, the error rate of Illumina sequencing in these experiments was expected to be less than 10−5, because each molecule was fully sequenced in both the forward and reverse directions via paired-end sequencing and only high-quality reads were kept for analysis.) These data are depicted as both the spectrum of mutations across the RNA sequence (Fig. S4A) and as conversion spectra showing the average and maximum conversion rates of each nucleotide type to all other nucleotide types or to deletions (Fig. S4B). To test whether the M2-seq signal would be affected by a lower level of preinstalled deletions, we amplified our P4–P6 DNA template from a plasmid containing the Tetrahymena ribozyme instead of performing PCR assembly from oligonucleotides. We found that the DNA template for this preparation method showed almost no deletions, as expected, but there was a higher level of other mutations, mostly G-to-U and C-to-A transversions at a rate of ∼1 × 10⁻³ each (Fig. S4). These mutations are consistent with the level of G-to-U and C-to-A transversions observed in targeted-capture and whole-genome sequencing experiments from DNA stored without deoxygenation and attributed to guanosine oxidation (39). The M2-seq signal for some secondary-structure elements, such as the P6 helix, disappeared in experiments based on this plasmid-prepared material compared with the PCR assembly-prepared material, confirming that deletions from oligonucleotide synthesis accounted for at least some of the serendipitous M2-seq signals (Fig. S4A). Further supporting this hypothesis, additional signals appeared at sites corresponding to transversions in experiments with plasmid-prepared material; similar signals associated with synthesis-associated mutations were observed in separate experiments with error-prone PCR (Fig. 2). However, other M2-seq signals, such as the P5b helix and TL/TLR interaction, occurred in experiments with all available DNA templates and could not be explained by mutations characterized by direct DNA sequencing (Fig. S4).
We next tested whether the remaining unexplained mutations contributing to M2-seq signal could have been installed at the RNA level. We reverse-transcribed and sequenced RNA prepared from PCR-assembled DNA template without any chemical modification steps. Comparison of the resulting mutation and conversion spectra to the results of sequencing the DNA template directly (Fig. S4) indicated that T7 RNA polymerase gives rise to U-to-C, C-to-U, and G-to-A transitions at mean rates of 2.1 × 10⁻³, 0.9 × 10⁻³, and 2.7 × 10⁻³, respectively, with occasional mutational “hot spots” with ∼1 × 10⁻² mutation rates; these rates are consistent with other recent studies characterizing T7 polymerase misincorporation rates across transcripts (40). These mutations, such as the G-to-A transition at position 180, are expected to disrupt base pairs and allow the partner nucleotide, for example, C138, to be modified by DMS, producing a 2D signal. Indeed, pairwise signal is observed for the C138–G180 base pair in the corresponding DMS-treated sample (Fig. 2D).
Other preparation methods, such as RNA from the pooled M2 library, PCR assembly, or error-prone–PCR DNA, also support additional mutations being introduced at the RNA level. To test whether commonly used RNA preparation steps might also introduce modifications, we assayed RNA that had undergone PAGE purification with UV shadowing, which can introduce modifications at U’s and G’s through pyrimidine photodimerization and in-gel ammonium persulfate oxidation, respectively (41). These protocols resulted in additional M2-seq signals, but with different patterns than seen in our or prior data (Fig. S5). Overall, mutations occurring at the DNA and RNA levels could be measured through sequencing of the DNA and RNA without chemical modification and appeared at positions that accounted for the detected M2-seq signal for Watson–Crick pairs.
To complete the analysis, we tested whether any further M2-seq signal could have resulted from DMS modifications acting as atomic mutations that influence the DMS modification rate at other nucleotides, as was previously demonstrated for A and C positions but not tested at G and U (21). Indeed, we observed DMS-dependent reactivity outside A’s and C’s (Fig. 2D and Fig. S4), which led us to further probe their mechanism. One explanation for these modifications is that DMS can form adducts to G’s or U’s at their N1 or N3 atoms, respectively, as long as they become deprotonated. The pH dependence of the mutation rates can thus be used to test for adduct formation. We observed that U residues are pH sensitive, with no detectable DMS-dependent modification at pH less than 8.0 (Fig. S6). We also carried out M2-seq at different pH values up to 10.0, to force a significant rate of U modifications (up to 1.5 × 10⁻² U-to-G transversions on average compared with 7.7 × 10⁻⁴ in our standard experiment at pH 7.0), but we observed a different M2-seq pattern (Fig. S6), supporting our initial expectation that direct DMS modifications of U’s at their N3 atoms are negligible at pH 7.0. DMS-dependent mutation rates at some of the G residues were not pH sensitive and occurred even at the standard pH of 7.0 and below (Fig. S6B). Because these mutations cannot be ascribed to N1 deprotonation and modification, we hypothesize that they are N7 guanosine modifications that induce some fraction of SuperScript II enzyme to introduce mutations during reverse transcription. However, given that N7 methylation is not expected to break Watson–Crick m7G-C pairs in the same way that mutation to A, U, or C would, these chemical modifications are unlikely to explain a significant fraction of the observed M2-seq signals marking Watson–Crick pairs. Instead, each of the M2 signals can be accounted for by accidental mutations introduced during preparation of the DNA or RNA, as described above.
Titration of DMS Dose Further Supports Non–Two-Hit Mechanisms for M2-Seq.
The experiments above gave evidence that structurally informative M2-seq signals in experiments on unmutated RNA could arise from serendipitous mutations installed during DNA or RNA preparation rather than from methylations introduced during DMS treatment (double-DMS hit) model. To further test this model, we carried out experiments that systematically varied the level of DMS modification. If an M2-seq signal arises from accidental mutations at one nucleotide that increase the rate of DMS modification at a partner nucleotide, then the signal should increase in frequency linearly with the overall DMS dose. If, on the other hand, a particular M2-seq signal requires two DMS modification events, one at each of the partner nucleotides, the frequency of the signal should depend quadratically on the dose of DMS used in the reaction. In Fig. S7, we show plots with the fraction of counts out of the total aligned reads that contained a mutation at the indicated pair of residues in the P4–P6 RNA, plotted against the overall modification rate (red points with error bars). As expected, the signal frequencies for seeing two mutational events were well above the products of frequencies of single mutational events (blue lines; see SI Methods). Importantly, a linear fit was sufficient to describe each of the 2D signals that involved a G or U as a partner nucleotide. We further predicted that, in individual reads that contained mutations at both residues in a base pair showing M2-seq signal, mutations at the G or U residue would be consistent with preinstalled mutations or deletions, exposing the pairing A or C residue to DMS modification. The results are shown as bar plots for each member of each base pair in Fig. S7. Indeed, mutations at G residues in G–C pairs are primarily G-to-A transitions or G deletions, consistent with the transitions introduced by T7 RNA polymerase and deletions observed from PCR assembly, respectively (panels 1, 2, 4, and 6–8 in Fig. S7). Similarly, in the U144–A159 pair, the high rate of deletions at U144 in reads with mutations at both residues (panel 3 in Fig. S7) is predicted by the high deletion rate from PCR assembly of the DNA template (Fig. S7). These deletion-associated M2-seq events were not detected in samples prepared from plasmid-derived DNA templates, which show no detectable deletions at the DNA level (Fig. S4).
Distinct from the linear dependence on DMS dose of signals at Watson–Crick base pairs, we found that the M2-seq signal for nucleotides 153 and 223 in the P4–P6 TL/TLR contact follows a quadratic dependence on DMS dose (panel 5 in Fig. S7). These nucleotides are A and C, respectively, which can both receive DMS modifications, suggesting that double-DMS modifications can contribute to M2-seq signal, as originally proposed in the RING-MaP study (21). Nevertheless, such double-DMS modifications appear at far fewer residue pairs than the M2-seq signals that mark Watson–Crick base-paired helices. Our results indicate that, in the absence of intentionally installed mutations, M2-seq signals are dominated by those produced by accidental mutations followed by single-DMS modifications at partner nucleotides.
Discussion
Rapid detection of base-pairing partners in new noncoding RNAs has been difficult, requiring structural and biochemical techniques with low throughput, limited applicability, and/or poor predictive value. To address this challenge, we have introduced and tested a method called M2-seq. Mutations introduced at a low level (≲10−3) during DNA or RNA synthesis disrupt local structure in the folded RNA and expose interacting nucleotides to reaction with DMS. This mutation and a partner that becomes exposed to DMS methylation leave correlated imprints on single molecules, enabling readout through reverse trancription and next-generation sequencing. M2-seq permits precise detection of the major structural elements of classic model systems such as the 158-nt P4–P6 domain of the Tetrahymena group I ribozyme and the 265-nt Bacillus stearothermophilus RNase P catalytic domain. M2-seq also reveals helices that have been difficult to detect or entirely missed in recent RNA-puzzles modeling for the GIR1 lariat-capping ribozyme, the adenosylcobalamin riboswitch, the ydaO cyclic–di-AMP riboswitch, and the Zika virus Xrn1-resistant genomic domain. Overall, the M2-seq data recover one-half of the helices in the tested RNAs with a low false-positive rate (<5%). Finally, the method enables pairwise structure inference for the majority of helices of the P4–P6 RNA in Xenopus egg extract. This study reports a biochemical technique enabling direct 2D visualization of RNA base pair partners—as opposed to 1D protections of uncertain origin—in a complex biological environment.
To supplement and automate simple visual inspection of M2-seq data, we have introduced the M2-net algorithm to infer helices from cross-diagonal signatures within the data, without bias from secondary-structure modeling methods that attempt to minimize a computed free energy. The M2-net algorithm is expected to be particularly important for scenarios that are not appropriately modeled with energy minimization methods, such as cases involving nontrivial tertiary structure or multiple secondary structures, molecules with long lengths, or systems reconstituted in complex environments where protein binding partners or molecular machines prevent the RNA from reaching equilibrium. Prior studies involving visual inspection of mutate-and-map data have correctly predicted tertiary contacts as well (12), and it will be important to test whether M2-net can be expanded to inferring such 3D information.
The presented M2-seq protocol is immediately applicable to 250-nt windows of lightly mutated RNAs introduced into complex biological environments. Synthetic long read sequencing or third-generation sequencing technologies may allow future studies to detect base pairings involving sequence separations longer than 250 nt (32–34). In terms of seeding mutations, applications to viruses and other systems that involve high-error rate RNA polymerases may obviate this step, but generally M2-seq in extracts, cells, and tissues will require transfecting DNA or RNA libraries that are prepared through error-prone PCR or other emerging techniques (33, 34). A faster and less biologically perturbing protocol would be enabled by a cell-permeable mutagen that could directly attack nucleotides initially sequestered inside RNA helices. While none of the routinely used chemical probes (e.g., DMS, SHAPE) appears appropriate, a large arsenal of mutagens remains to be tested for RNA structure mapping in vivo (35).
Methods
DMS mapping experiments on RNA were performed by modifying the RNA with DMS (170 mM final) in 10 mM MgCl2 and 300 mM Na-cacodylate (pH 7.0) for 6 min at 37 °C, followed by quenching with β-mercaptoethanol and purification with ethanol precipitation. Experiments with Xenopus egg extract replaced ethanol precipitation with purification by TRIzol extraction and RNA Clean-and-Concentrator-5 columns (Zymo Research). Reverse transcription was performed in conditions that led to mutational read-through at methylated nucleotides (SuperScript II and Mn2+), and sequencing libraries were prepared by PCR and sequenced on Illumina MiSeq instruments. ShapeMapper (36) was used to align sequencing reads to reference sequences and record mutations, and the results were converted to M2-seq data and mutation spectra using scripts available at https://github.com/ribokit/M2seq. Detailed descriptions of RNA preparation, modification experiments, map visualization, secondary-structure modeling by M2-net and RNAstructure executables, and DMS dose-dependent mutation rate analysis are provided in SI Methods.
SI Methods
RNA Preparation.
DNA templates for the P4–P6 RNA were prepared by PCR assembly of oligonucleotides (Table S2) purchased from Integrated DNA Technologies. PCRs included 1× HF buffer [New England Biolabs (NEB)], 0.2 mM dNTPs, 4 µM primers 1 and 6, 40 nM primers 2–5, and 40 U/mL Phusion Polymerase (NEB). PCR was performed as described previously (42) except with 35 cycles. Briefly, reactions were denatured for 30 s at 98 °C; and then, for each of 35 cycles, denatured for 10 s at 98 °C, annealed at 30 s for 64 °C, and incubated for 30 s at 72 °C for polymerase extension; and then subjected to a final extension step for 10 min at 72 °C. Templates were purified with AMPure XP beads (Beckman Coulter) following the manufacturer’s instructions. RNAs were transcribed in reactions containing 0.2 µM DNA template, 40 mM Tris⋅HCl, pH 8.1, 25 mM MgCl2, 3.5 mM spermidine, 0.01% Triton X-100, 40 mM DTT, 4% PEG 8000, 3 mM NTPs, and 5 U/µL T7 RNA polymerase (NEB) at 37 °C for 4 h. Transcribed RNAs were purified with AMPure XP beads that were mixed with 40% PEG 8000 in a 7:3 ratio, following the manufacturer’s instructions.
For the pooled mutate-and-map library, the individual point mutants in the P4–P6 library were PCR assembled and transcribed as previously described (16, 42), and then equal volumes of each point mutant were pooled together before folding and modification. For error-prone (EP) PCR with Taq DNA polymerase, the PCR-assembled DNA template was further amplified under EP-PCR conditions to introduce ∼2.6 mutations per ∼200-bp dsDNA template molecule (23). The reaction mix was composed of 10 mM Tris⋅HCl, pH 8.3; 50 mM KCl; 7 M MgCl2; 1 mM dCTP and dTTP; 0.2 mM dATP and dGTP; 2 mM each primer; 20 pg/μL plasmid template; 0.4 mM MnCl2; and 0.05 U/μL Taq polymerase (23), using primers 1 and 6 from the P4–P6 PCR assembly primer set for the forward and reverse primers. The PCR was performed for 24 cycles (∼20 doublings) with an initial 1-min denaturation step at 94 °C; then, for each cycle, a 1-min denaturation step at 94 °C, a 1-min annealing step at 64 °C, and a 3-min extension step at 72 °C; and finally, after cycling, a 10-min extension step at 72 °C. The RNA was then transcribed with T7 polymerase as above.
For RNA transcribed from a plasmid source, the DNA template was PCR amplified from the pT7L-21 plasmid (43) using primers 1 and 6 from the P4–P6 PCR assembly primer set (Table S2). Reactions included 1× HF buffer (NEB), 0.2 mM dNTPs, 20 pg/μL pT7L-21 plasmid (gift from the laboratory of D. Herschlag, Stanford University School of Medicine, Stanford, CA), and 4 µM primers 1 and 6, and 40 U/mL Phusion Polymerase (NEB). PCR and template purification were performed as described above.
Alternative RNA preparations for the conditions shown in Figs. S5 and S6 are described below. For low- and high-UV dose PAGE-purified samples, after transcription and purification as described above, the P4–P6 RNA was electrophoresed on a 6% 29:1 acrylamide:bis, 7 M urea polyacrylamide gel, and then exposed to a high-UV or low-UV dose by holding a 254-nm UV lamp (UVP UVG-54) close to (≤5 cm, high dose) or far away from (≥20 cm, low dose) the PAGE gel during UV shadowing over ≈15 s. RNA was eluted from gel slices overnight at 4 °C into RNase-free water, and then the RNA was purified from eluate by Zymo RNA Clean-and-Concentrator columns (Zymo Research).
DMS Mapping.
For in vitro samples, the mutational profiling reaction was performed as described previously for the P4–P6 RNA (21), in 300 mM Na-cacodylate, pH 7.0, and 10 mM MgCl2. First, 5 µL of RNA stock in H2O containing 12.5 pmol of RNA was mixed with 5 µL of 1× TE (Ambion) and denatured by incubating at 95 °C for 2 min, and then cooling on ice for 1 min. Then 12.5 µL of 2× buffer (600 mM Na-cacodylate, pH 7.0, and 20 mM MgCl2) was added, and the RNA was incubated at 37 °C for 30 min to fold. RNAs were modified by adding 2.5 µL of DMS (1.7 M in 100% ethanol); for no-modification controls, 2.5 µL of 100% ethanol was added instead. Reactions were incubated at 37 °C for 6 min, and then quenched with 25 µL of 2-mercaptoethanol. RNA was purified by ethanol precipitation as follows: 50 µL of RNase-free H2O was added to the 50-µL quenched reaction, followed by 10 µL (1/10× vol) of 3 M Na-acetate, pH 5.2. After mixing, 330 µL (3× vol) of 100% ethanol, cooled on dry ice, was added, and the sample was mixed and incubated on dry ice for 20 min. The sample was spun down in a tabletop microcentrifuge for 18–20 min at maximum speed and washed twice with 500 µL of ice-cold 70% ethanol. The supernatant was removed, and the pellet was allowed to dry and was then resolubilized in 7 µL of RNase-free H2O. For the alternative pH modification conditions, the 300 mM Na-cacodylate, pH 7, buffer was replaced with 300 mM Na-cacodylate, pH 7.4; 50 mM Tris⋅HCl, pH 8.0; 50 mM Na-Hepes, pH 8.0; 300 mM Na-CHES, pH 9.0; or 300 mM Na-CHES, pH 10. The capacity of these buffers and concentrations to keep the pH constant against acid released during DMS modification was checked through pH measurements before and after reactions.
For in extracto experiments, the extract was prepared as in refs. 44 and 45, through CSF/EGTA arrest of Xenopus laevis eggs at metaphase, centrifugation to pack eggs, needle extraction of cytoplasm, addition of storage mix (final concentrations of 50 mM sucrose; 10 µg/mL leupeptin/pepstatin A/chymostatin; 10 µg/mL cytochalasin D; and 7.5 mM creatine phosphate, 1 mM ATP, 1 mM MgCl2), rapid freezing of aliquots in liquid nitrogen, and storage at −80 °C. Aliquots of the egg extract were thawed immediately before use in our mapping experiments. The mapping protocol was similar to the in vitro protocol above with some adjustments to account for the macromolecule content of the extract. The P4–P6 RNA (5–7 pmol) was prepared in 1× TE (1 µL), diluted by addition of water (1 µL), and denatured by incubation at 95 °C for 3 min and snap-cooling on ice for 1 min. A stock of 200 mM MgCl2 was added (1 µL) and then 15 µL of egg extract. The RNA was incubated at 37 °C for 30 min to fold in the extract and then cooled down to room temperature for 10 min. RNAs were then modified by addition of 2.0 μL of DMS (1.7 M in neat ethanol) or 2.0 μL of 100% ethanol as a no-modification control. These reaction volumes of 20 µL were incubated at 18 °C for 6 min. After DMS treatment, 80 µL of 1.0 M Na-Hepes, pH 8.0, and then 20 µL of 2-mercaptoethanol were added to the reactions. The RNA was purified away from proteins by extraction with TRIzol (Thermo Fisher Scientific) and chloroform (in the ratio of TRIzol, 1.5 mL/300 µL chloroform). The RNA solution was mixed with TRIzol–chloroform for 10 min, and then centrifuged at 12,000 × g for 15 min. Approximately 300 µL of the aqueous phase (top partition) was pipetted for further purification with Zymo Research RNA Clean-and-Concentrator-5 columns. The RNA was eluted with 6 µL of H2O.
The reverse-transcription reaction was performed under mutational profiling conditions as described previously (21), with 0.5 mM dNTPs, 50 mM Tris⋅HCl, pH 8.0, 75 mM KCl, 6 mM MnCl2, 10 mM DTT, and SuperScript II reverse transcriptase (Invitrogen) in a 12-µL reaction incubated for 3 h at 42 °C. The reaction contained 22 nM reverse-transcription primer, consisting of (from 5′ to 3′) the read 1 amplification and primer binding sites for Illumina sequencing, a 12-nt barcode for multiplexing, and an RNA-binding sequence matching the 3′-end of the RNA, as described previously (46) and listed in Table S2. After reverse transcription, RNA templates were degraded by addition of 5 µL of 0.4 M NaOH and incubation at 90 °C for 3 min, followed by cooling on ice for 3 min. The reactions were then neutralized in a fume hood by adding 5 µL of an acid quench (stock prepared from 2 mL of 5 M NaCl, 2 mL of 2 M HCl, and 3 mL of 3 M Na-acetate), and then ethanol-precipitated. We found that some Mn2+ remained in the samples after ethanol precipitation and interfered with subsequent PCR amplification of the sequencing library, so we repurified the samples with AMPure XP magnetic beads (Beckman Coulter) with 40% PEG 8000 (7:3 ratio) to remove leftover salt. The final cDNA concentrations were ≈15–20 ng/µL as measured by Nanodrop (Thermo Fisher Scientific).
The cDNAs were PCR-amplified using a universal forward primer that bound to the common 5′-end of the reverse-transcription primer sequence and a reverse primer that included the read 2 amplification and primer binding sites for Illumina sequencing and the 5′-end of the RNA sequence (for RNA samples) or the T7 promoter (for sequencing the DNA template directly) (Table S2), to ensure amplification of near full-length cDNAs. Each PCR included 1× HF buffer, 0.2 mM dNTPs, 4 µM forward and reverse primers, Phusion DNA polymerase, and 60 ng of cDNA. PCR was performed for 20 cycles, and the resulting dsDNA libraries were purified by AMPure XP beads. The libraries were run on ethidium bromide-stained agarose gels to check that the PCR products were the expected size. For sequencing on Illumina MiSeq instruments (Illumina), we measured the concentrations of the libraries by Qubit (Thermo Fisher Scientific) and found that the final concentrations were ≈150–300 ng/µL.
Libraries were sequenced using MiSeq, version 3, 600-cycle kits (Illumina). For each sequencing run, we combined the libraries for the samples of interest up to a total of 32 fmol of ssDNA (16 fmol of dsDNA), and then mixed the samples with 4 fmol of double-stranded PhiX (Illumina). Then, we added an equal volume of 0.2 M NaOH and incubated the sample (no more than 20 µL total) at room temperature for 8 min to denature the DNA. After denaturation, HT1 buffer (Illumina) was added to a volume of 1 mL, and the sample was mixed. The sample was incubated at 96 °C for 2 min and then on ice for at least 5 min, before 600 µL was loaded into the MiSeq cartridge. MiSeq runs were performed following manufacturer instructions for paired-end sequencing, with 300 cycles each for read 1 and read 2.
M2-Seq Data Analysis.
The M2-seq analysis of sequencing data of mutational profiling experiments consists of the following pipeline: First, multiplexed FASTQ files are demultiplexed with NovoBarcode (NovoCraft). Then, paired FASTQ files for each experimental condition are analyzed using the ShapeMapper software (47). Generation of 2D datasets and visualization of mutations were performed by the M2seq software package, available at https://github.com/ribokit/M2seq. The 2D dataset was then used for RNA secondary-structure prediction through RNAstructure as described below. For ShapeMapper steps, the trimPhred setting was set to 0, the minPhred setting was set to 20, and the option to convert the mutation strings was set to give a simplified style (makeOldMutationStrings). After ShapeMapper analysis, we ran muts_to_simple.py, included in the M2seq software package, to generate binary files in .simple format, which are then used to generate 2D datasets.
The simple_to_rdat.py script in the M2seq package reads a given simple file and constructs a 1D chemical mapping profile for each single-nucleotide variant by adding together the number of reads with mutations correlated to that variant at each position and normalizing by the total number of reads with a mutation at that variant position. A “wild-type” (WT) profile is constructed by adding together all mutations and is given as the first “mutation position” on the 2D plots shown in this study. To remove noise due to incompletely reverse-transcribed or sequenced fragments, we restricted the reads used to construct the 2D data to those near full-length (with a 5′-most read position within 10 nt of the start of the RNA) and with 10 or fewer mutations.
The M2-seq datasets shown in this study have been deposited in the RNA Mapping Database (RMDB) at https://rmdb.stanford.edu/ with the following accession IDs:
| M2-seq datasets | Accession IDs |
| P4–P6, DNA template from PCR assembly | TRP4P6_DMS_0005 |
| P4–P6, DNA template from PCR assembly, no modification | TRP4P6_DMS_0006 |
| P4–P6, pooled M2 library | TRP4P6_DMS_0007 |
| P4–P6, pooled M2 library, no modification | TRP4P6_DMS_0008 |
| P4–P6, DNA template from plasmid | TRP4P6_DMS_0009 |
| P4–P6, DNA template from EP-PCR | TRP4P6_DMS_0010 |
| P4–P6, high dose of UV-shadowing | TRP4P6_DMS_0011 |
| P4–P6, low dose of UV-shadowing | TRP4P6_DMS_0012 |
| P4–P6, probed in Na-CHES pH 10 | TRP4P6_DMS_0013 |
| P4–P6 from prior sequencing data (21) | TRP4P6_DMS_0014 |
| P4–P6, DNA template from EP-PCR, repeated | TRP4P6_DMS_0015 |
| P4–P6, DNA template from EP-PCR, in extracto | TRP4P6_DMS_0016 |
| GIR1 ribozyme, DNA from PCR assembly | GIR1RZ_DMS_0000 |
| GIR1 ribozyme, DNA from EP-PCR | GIR1RZ_DMS_0000 |
| RNase P C-domain, DNA from PCR assembly | RNASEP_DMS_0001 |
| RNase P C-domain, DNA from EP-PCR | RNASEP_DMS_0002 |
| RNase P C-domain from prior sequencing data (21) | RNASEP_DMS_0000 |
| AdoCBL riboswitch, DNA from PCR assembly | ADOCBL_DMS_0000 |
| AdoCBL riboswitch, DNA from PCR assembly, +AdoCBL | ADOCBL_DMS_0001 |
| AdoCBL riboswitch, DNA from EP-PCR | ADOCBL_DMS_0002 |
| AdoCBL riboswitch, DNA from EP-PCR, +AdoCBL | ADOCBL_DMS_0003 |
| ydaO riboswitch, DNA from PCR assembly | YDAORS_DMS_0000 |
| ydaO riboswitch, DNA from PCR assem., +cyclic–di-AMP ligand | YDAORS_DMS_0001 |
| TPP riboswitch, DNA from PCR assembly | TPPRSW_DMS_0000 |
| TPP riboswitch, DNA from PCR assembly, +TPP ligand | TPPRSW_DMS_0001 |
| TPP riboswitch, DNA from EP-PCR | TPPRSW_DMS_0002 |
| TPP riboswitch, DNA from EP-PCR, +TPP ligand | TPPRSW_DMS_0003 |
| TPP riboswitch from prior sequencing data (21) | TPPRSW_DMS_0004 |
| TPP riboswitch from prior sequencing data (21), +TPP ligand | TPPRSW_DMS_0005 |
| Zika xrRNA, DNA from PCR assembly | ZIKAXR_DMS_0000 |
Compensatory mutagenesis measurements to test P19 base pairs in the RNase P C domain have been deposited as RNASEP_RSQ_0000.
The mutation spectrum heat maps (e.g., Figs. S4–S6) were derived from the counted-mutation tables output by ShapeMapper by dividing the number of reads with each type of mutation at each position by the sequencing depth at that position, providing a mutation frequency that can be compared across samples. The conversion spectra were generated by calculating either the average or the maximum rates of the given mutation/deletion across all nucleotides of each starting identity (A, U, G, C) in the region of interest.
Automated Helix Recognition with M2-Net.
The M2-net algorithm is available as a MATLAB command M2net.m available in the BIERS package, https://github.com/DasLab/Biers. It carries out the following steps, each encoded as a 2D operation or set of operations on the input M2-seq data matrix prepared as above.
-
i)
Z-scores are calculated at each 2D position. These values give the amount by which each nucleotide exceeds the mean reactivity at that position across all rows (mutants), divided by the SD of the reactivity of that position across all rows (mutants). Matrix positions within 5 nt of the diagonal (i.e., sequence separation between mutated position and mapped position less than or equal to 5) are excluded from these calculations. Values are then subtracted by 1.0, and only positive values are kept. This operation is equivalent to a column-wise batch-norm followed by a rectified linear unit (ReLU) in neural-net descriptions.
-
ii)
Values within 7 nt of the diagonal are removed from the analysis (changing this cutoff did not change the analysis after later steps that filter for helices with lengths greater than 2). Values corresponding to positions in flanking sequences outside the region of interest are zeroed.
-
iii)
A convolution is applied with the following 5 × 5 matrix and MATLAB operation filter2:
This step is equivalent to a convolution with size 5 in neural-network descriptions. It picks out “cross-diagonal” features in which high Z-scores for a pair (i, j) are integrated with any similar high values at (i − 1, j + 1), … (i − 4, j + 4).
-
iv)
Positions that are not possible ends of helices with length >2 bp (assessed purely based on whether the pair sequences are compatible with Watson–Crick pairing) are zeroed out.
-
v)
“Singlets,” high scoring positions (i, j) with zero values at both (i − 1, j + 1) and (i + 1, j − 1), are zeroed.
-
vi)
Any position that is zero but is a possible Watson–Crick pair and has high values at both (i − 1, j + 1) and (i + 1, j − 1) is given the minimum of those two neighboring values; this reconnects helix domains that are split in earlier steps.
-
vii)
The 2D matrix is filtered so that for each nucleotide there is at most one partner nucleotide with a nonzero value, with preference given to pairs with strongest values.
-
viii)
Singlets are again removed.
Any nonzero values in the final matrix are taken as positively identified base pairs by M2-net.
Secondary-Structure Prediction with RNAstructure.
We performed RNAstructure prediction for the RNase P catalytic domain as described previously (16, 42) using the ShapeKnots 5.8 program, incorporating either no data, 1D DMS data, or 2D DMS data as Z-score weights. The 2D Z-scores were applied as energy bonuses via the –x option, which was previously available in the Fold executable; updates to ShapeKnots to accept these energy bonuses and to fix bugs discovered in DMS-guided modeling by ShapeKnots and Fold executables are being incorporated into the next release of RNAstructure (version 6). For 1D data, the reactivities at A and C residues from the WT profile were background-subtracted using measurements made without DMS modification and normalized based on interquartile reactivities with DMS_normalize.m. 1D and 2D data were input as SHAPE reactivities to RNAstructure using a MATLAB-based wrapper rna_structure.m (https://ribokit.github.io/Biers/). All MATLAB scripts are available in the repository https://ribokit.github.io/Biers/.
Analysis of Dose-Dependent Mutation Rate.
To test the extent to which double-DMS hits contribute to M2-seq signal, we performed the mapping experiment on P4–P6 with a range of DMS treatment concentrations (0, 0.4, 0.85, 1.28, and 1.7 M; and 1.7 M with incubation time doubled from 6 to 12 min). For each pair of positions shown in Fig. S7, we calculated the fraction of aligned, full-length reads that contained a mutation at both positions and plotted them against the total modification rate (sum of reactivities) over the region of interest in the P4–P6 sequence, which increased with increasing DMS concentration. We performed fits to these data in MATLAB.
To compare these data to the expected signal from uncorrelated single modifications, we also plotted the mutation rate at each position per pair against the modification rate. These data were universally well-fit by linear functions, and the product of the linear fits to each position in a pair is shown as the blue line in each panel of Fig. S7. We additionally calculated the frequency of each type of mutation from the native nucleotide for each residue in each pair by dividing the number of reads with each type of mutation and a mutation at both residues by the total number of aligned, full-length reads, for the dataset shown in Fig. 2C. These data are shown as bar plots for each residue pair in Fig. S7.
Mutate-and-Map Analysis of P4–P6 by CE.
The CE-based M2 data for the P4–P6 domain of the Tetrahymena group I intron with DMS modification was previously collected in standard buffer conditions (16) of 50 mM Na-Hepes, pH 8.0, and 10 mM MgCl2 according to the standard M2 protocol (16, 42). The RMDB accession ID of this dataset is TRP4P6_DMS_0004.
Supplementary Material
Acknowledgments
We thank P. Cordero and S. Tian for initial RNAstructure analyses of previously collected MaP data; the Herschlag laboratory for the pT7L-21 plasmid; B. French and A. Straight for the generous gift of Xenopus egg extract; and D. Mathews and R. Watson for incorporating extensions into RNAstructure software. We acknowledge funding from the National Institutes of Health [Grant 5 T32 GM007276 (to C.Y.C.); Grant R01 GM102519 (to R.D.)] and the Burroughs Wellcome Fund [Grant CASI 1007326.01 (to R.D.)].
Footnotes
The authors declare no conflict of interest.
This article is a PNAS Direct Submission.
Data deposition: The M2-seq datasets reported in this study have been deposited in the RNA Mapping Database, https://rmdb.stanford.edu/ (accession nos. TRP4P6_DMS_0005–TRP4P6_DMS_0009, TRP4P6_DMS_0010–TRP4P6_DMS_0014, RNASEP_DMS_0000, and additional IDs given in Supporting Information).
This article contains supporting information online at www.pnas.org/lookup/suppl/doi:10.1073/pnas.1619897114/-/DCSupplemental.
References
- 1.Leamy KA, Assmann SM, Mathews DH, Bevilacqua PC. Bridging the gap between in vitro and in vivo RNA folding. Q Rev Biophys. 2016;49:e10. doi: 10.1017/S003358351600007X. [DOI] [PMC free article] [PubMed] [Google Scholar]
- 2.Tian S, Das R. RNA structure through multidimensional chemical mapping. Q Rev Biophys. 2016;49:e7. doi: 10.1017/S0033583516000020. [DOI] [PubMed] [Google Scholar]
- 3.Deigan KE, Li TW, Mathews DH, Weeks KM. Accurate SHAPE-directed RNA structure determination. Proc Natl Acad Sci USA. 2009;106:97–102. doi: 10.1073/pnas.0806929106. [DOI] [PMC free article] [PubMed] [Google Scholar]
- 4.Kladwang W, VanLang CC, Cordero P, Das R. Understanding the errors of SHAPE-directed RNA structure modeling. Biochemistry. 2011;50:8049–8056. doi: 10.1021/bi200524n. [DOI] [PMC free article] [PubMed] [Google Scholar]
- 5.Cordero P, Kladwang W, VanLang CC, Das R. Quantitative dimethyl sulfate mapping for automated RNA secondary structure inference. Biochemistry. 2012;51:7037–7039. doi: 10.1021/bi3008802. [DOI] [PMC free article] [PubMed] [Google Scholar]
- 6.Hajdin CE, et al. Accurate SHAPE-directed RNA secondary structure modeling, including pseudoknots. Proc Natl Acad Sci USA. 2013;110:5498–5503. doi: 10.1073/pnas.1219988110. [DOI] [PMC free article] [PubMed] [Google Scholar]
- 7.Tian S, Cordero P, Kladwang W, Das R. High-throughput mutate-map-rescue evaluates SHAPE-directed RNA structure and uncovers excited states. RNA. 2014;20:1815–1826. doi: 10.1261/rna.044321.114. [DOI] [PMC free article] [PubMed] [Google Scholar]
- 8.Eddy SR. Computational analysis of conserved RNA secondary structure in transcriptomes and genomes. Annu Rev Biophys. 2014;43:433–456. doi: 10.1146/annurev-biophys-051013-022950. [DOI] [PMC free article] [PubMed] [Google Scholar]
- 9.Watts JM, et al. Architecture and secondary structure of an entire HIV-1 RNA genome. Nature. 2009;460:711–716. doi: 10.1038/nature08237. [DOI] [PMC free article] [PubMed] [Google Scholar]
- 10.Pollom E, et al. Comparison of SIV and HIV-1 genomic RNA structures reveals impact of sequence evolution on conserved and non-conserved structural motifs. PLoS Pathog. 2013;9:e1003294. doi: 10.1371/journal.ppat.1003294. [DOI] [PMC free article] [PubMed] [Google Scholar]
- 11.Sükösd Z, et al. Full-length RNA structure prediction of the HIV-1 genome reveals a conserved core domain. Nucleic Acids Res. 2015;43:10168–10179. doi: 10.1093/nar/gkv1039. [DOI] [PMC free article] [PubMed] [Google Scholar]
- 12.Miao Z, et al. RNA-puzzles round II: Assessment of RNA structure prediction programs applied to three large RNA structures. RNA. 2015;21:1066–1084. doi: 10.1261/rna.049502.114. [DOI] [PMC free article] [PubMed] [Google Scholar]
- 13.Miao Z, et al. RNA-puzzles round III: 3D RNA structure prediction of five riboswitches and one ribozyme. RNA. 2017;23:655–672. doi: 10.1261/rna.060368.116. [DOI] [PMC free article] [PubMed] [Google Scholar]
- 14.Sergiev PV, Dontsova OA, Bogdanov AA. [Study of ribosome structure using the biochemical methods: Judgment day] Mol Biol (Mosk) 2001;35:559–583. [PubMed] [Google Scholar]
- 15.Lu Z, et al. RNA duplex map in living cells reveals higher-order transcriptome structure. Cell. 2016;165:1267–1279. doi: 10.1016/j.cell.2016.04.028. [DOI] [PMC free article] [PubMed] [Google Scholar]
- 16.Kladwang W, VanLang CC, Cordero P, Das R. A two-dimensional mutate-and-map strategy for non-coding RNA structure. Nat Chem. 2011;3:954–962. doi: 10.1038/nchem.1176. [DOI] [PMC free article] [PubMed] [Google Scholar]
- 17.Cordero P, Das R. Rich RNA structure landscapes revealed by mutate-and-map analysis. PLoS Comput Biol. 2015;11:e1004473. doi: 10.1371/journal.pcbi.1004473. [DOI] [PMC free article] [PubMed] [Google Scholar]
- 18.Miao Z, et al. RNA-puzzles round II: Assessment of RNA structure prediction programs applied to three large RNA structures. RNA. 2015;21:1066–1084. doi: 10.1261/rna.049502.114. [DOI] [PMC free article] [PubMed] [Google Scholar]
- 19.Furey WS, et al. Use of fluorescence resonance energy transfer to investigate the conformation of DNA substrates bound to the Klenow fragment. Biochemistry. 1998;37:2979–2990. doi: 10.1021/bi9719758. [DOI] [PubMed] [Google Scholar]
- 20.Krokhotin A, Mustoe AM, Weeks KM, Dokholyan NV. Direct identification of base-paired RNA nucleotides by correlated chemical probing. RNA. 2017;23:6–13. doi: 10.1261/rna.058586.116. [DOI] [PMC free article] [PubMed] [Google Scholar]
- 21.Homan PJ, et al. Single-molecule correlated chemical probing of RNA. Proc Natl Acad Sci USA. 2014;111:13858–13863. doi: 10.1073/pnas.1407306111. [DOI] [PMC free article] [PubMed] [Google Scholar]
- 22.Cate JH, et al. Crystal structure of a group I ribozyme domain: Principles of RNA packing. Science. 1996;273:1678–1685. doi: 10.1126/science.273.5282.1678. [DOI] [PubMed] [Google Scholar]
- 23.Wilson DS, Keefe AD. 2001. Random mutagenesis by PCR. Curr Protoc Mol Biol Chap 8:Unit 8.3.
- 24.Akiyama BM, et al. Zika virus produces noncoding RNAs using a multi-pseudoknot structure that confounds a cellular exonuclease. Science. 2016;354:1148–1152. doi: 10.1126/science.aah3963. [DOI] [PMC free article] [PubMed] [Google Scholar]
- 25.Kladwang W, Das R. A mutate-and-map strategy for inferring base pairs in structured nucleic acids: Proof of concept on a DNA/RNA helix. Biochemistry. 2010;49:7414–7416. doi: 10.1021/bi101123g. [DOI] [PubMed] [Google Scholar]
- 26.Kladwang W, Cordero P, Das R. A mutate-and-map strategy accurately infers the base pairs of a 35-nucleotide model RNA. RNA. 2011;17:522–534. doi: 10.1261/rna.2516311. [DOI] [PMC free article] [PubMed] [Google Scholar]
- 27.LeCun Y, Bengio Y, Hinton G. Deep learning. Nature. 2015;521:436–444. doi: 10.1038/nature14539. [DOI] [PubMed] [Google Scholar]
- 28.Kazantsev AV, et al. Solution structure of RNase P RNA. RNA. 2011;17:1159–1171. doi: 10.1261/rna.2563511. [DOI] [PMC free article] [PubMed] [Google Scholar]
- 29.Desai A, Murray A, Mitchison TJ, Walczak CE. The use of Xenopus egg extracts to study mitotic spindle assembly and function in vitro. Methods Cell Biol. 1999;61:385–412. doi: 10.1016/s0091-679x(08)61991-3. [DOI] [PubMed] [Google Scholar]
- 30.Bass BL, Weintraub H. An unwinding activity that covalently modifies its double-stranded RNA substrate. Cell. 1988;55:1089–1098. doi: 10.1016/0092-8674(88)90253-x. [DOI] [PubMed] [Google Scholar]
- 31.Wagner RW, Smith JE, Cooperman BS, Nishikura K. A double-stranded RNA unwinding activity introduces structural alterations by means of adenosine to inosine conversions in mammalian cells and Xenopus eggs. Proc Natl Acad Sci USA. 1989;86:2647–2651. doi: 10.1073/pnas.86.8.2647. [DOI] [PMC free article] [PubMed] [Google Scholar]
- 32.Stapleton JA, et al. Haplotype-phased synthetic long reads from short-read sequencing. PLoS One. 2016;11:e0147229. doi: 10.1371/journal.pone.0147229. [DOI] [PMC free article] [PubMed] [Google Scholar]
- 33.Mostovoy Y, et al. A hybrid approach for de novo human genome sequence assembly and phasing. Nat Methods. 2016;13:587–590. doi: 10.1038/nmeth.3865. [DOI] [PMC free article] [PubMed] [Google Scholar]
- 34.Jain M, Olsen HE, Paten B, Akeson M. The Oxford Nanopore MinION: Delivery of nanopore sequencing to the genomics community. Genome Biol. 2016;17:239. doi: 10.1186/s13059-016-1103-0. [DOI] [PMC free article] [PubMed] [Google Scholar]
- 35.Singer B, Kuśmierek JT. Chemical mutagenesis. Annu Rev Biochem. 1982;51:655–693. doi: 10.1146/annurev.bi.51.070182.003255. [DOI] [PubMed] [Google Scholar]
- 36.Siegfried NA, Busan S, Rice GM, Nelson JA, Weeks KM. RNA motif discovery by SHAPE and mutational profiling (SHAPE-MaP) Nat Methods. 2014;11:959–965. doi: 10.1038/nmeth.3029. [DOI] [PMC free article] [PubMed] [Google Scholar]
- 37.Tian S, Yesselman JD, Cordero P, Das R. Primerize: Automated primer assembly for transcribing non-coding RNA domains. Nucleic Acids Res. 2015;43:W522–W526. doi: 10.1093/nar/gkv538. [DOI] [PMC free article] [PubMed] [Google Scholar]
- 38.Kosuri S, Church GM. Large-scale de novo DNA synthesis: Technologies and applications. Nat Methods. 2014;11:499–507. doi: 10.1038/nmeth.2918. [DOI] [PMC free article] [PubMed] [Google Scholar]
- 39.Costello M, et al. Discovery and characterization of artifactual mutations in deep coverage targeted capture sequencing data due to oxidative DNA damage during sample preparation. Nucleic Acids Res. 2013;41:e67. doi: 10.1093/nar/gks1443. [DOI] [PMC free article] [PubMed] [Google Scholar]
- 40.Wons E, Furmanek-Blaszk B, Sektas M. RNA editing by T7 RNA polymerase bypasses InDel mutations causing unexpected phenotypic changes. Nucleic Acids Res. 2015;43:3950–3963. doi: 10.1093/nar/gkv269. [DOI] [PMC free article] [PubMed] [Google Scholar]
- 41.Kladwang W, Hum J, Das R. Ultraviolet shadowing of RNA can cause significant chemical damage in seconds. Sci Rep. 2012;2:517. doi: 10.1038/srep00517. [DOI] [PMC free article] [PubMed] [Google Scholar]
- 42.Cordero P, Kladwang W, VanLang CC, Das R. The mutate-and-map protocol for inferring base pairs in structured RNA. Methods Mol Biol. 2014;1086:53–77. doi: 10.1007/978-1-62703-667-2_4. [DOI] [PMC free article] [PubMed] [Google Scholar]
- 43.Zaug AJ, Grosshans CA, Cech TR. Sequence-specific endoribonuclease activity of the Tetrahymena ribozyme: Enhanced cleavage of certain oligonucleotide substrates that form mismatched ribozyme-substrate complexes. Biochemistry. 1988;27:8924–8931. doi: 10.1021/bi00425a008. [DOI] [PubMed] [Google Scholar]
- 44.Guse A, Fuller CJ, Straight AF. A cell-free system for functional centromere and kinetochore assembly. Nat Protoc. 2012;7:1847–1869. doi: 10.1038/nprot.2012.112. [DOI] [PMC free article] [PubMed] [Google Scholar]
- 45.Moree B, Meyer CB, Fuller CJ, Straight AF. CENP-C recruits M18BP1 to centromeres to promote CENP-A chromatin assembly. J Cell Biol. 2011;194:855–871. doi: 10.1083/jcb.201106079. [DOI] [PMC free article] [PubMed] [Google Scholar]
- 46.Seetin MG, Kladwang W, Bida JP, Das R. Massively parallel RNA chemical mapping with a reduced bias MAP-seq protocol. Methods Mol Biol. 2014;1086:95–117. doi: 10.1007/978-1-62703-667-2_6. [DOI] [PubMed] [Google Scholar]
- 47.Smola MJ, Rice GM, Busan S, Siegfried NA, Weeks KM. Selective 2′-hydroxyl acylation analyzed by primer extension and mutational profiling (SHAPE-MaP) for direct, versatile and accurate RNA structure analysis. Nat Protoc. 2015;10:1643–1669. doi: 10.1038/nprot.2015.103. [DOI] [PMC free article] [PubMed] [Google Scholar]
- 48.Tian S, Cordero P, Kladwang W, Das R. High-throughput mutate-map-rescue evaluates SHAPE-directed RNA structure and uncovers excited states. RNA. 2014;20:1815–1826. doi: 10.1261/rna.044321.114. [DOI] [PMC free article] [PubMed] [Google Scholar]
Associated Data
This section collects any data citations, data availability statements, or supplementary materials included in this article.