Significance
Inositol requiring enzyme 1α (IRE1α) is a mediator of the unfolded protein response that determines adaptation or cell death in response to endoplasmic reticulum (ER) stress through its distinct endoribonuclease (RNase) activities of Xbp1 splicing and mRNA decay, but its role in cancer is poorly understood. In normal epithelial cells, we find that Ras oncogene-induced proliferation and senescence are directly linked to IRE1α activation. Proliferation requires Xbp1 splicing and ER stress, while IRE1α-catalyzed degradation of Id1 mRNA drives senescence in conjunction with reduced ER stress. Thus, we propose that oncogene and ER stress regulation of the IRE1α RNase dictates tumor promotion or suppression in Ras-driven cancers.
Keywords: oncogene-induced senescence, ER stress, IRE1α, Ras, ID1
Abstract
Oncogenic Ras causes proliferation followed by premature senescence in primary cells, an initial barrier to tumor development. The role of endoplasmic reticulum (ER) stress and the unfolded protein response (UPR) in regulating these two cellular outcomes is poorly understood. During ER stress, the inositol requiring enzyme 1α (IRE1α) endoribonuclease (RNase), a key mediator of the UPR, cleaves Xbp1 mRNA to generate a potent transcription factor adaptive toward ER stress. However, IRE1α also promotes cleavage and degradation of ER-localized mRNAs essential for cell death. Here, we show that oncogenic HRas induces ER stress and activation of IRE1α. Reduction of ER stress or Xbp1 splicing using pharmacological, genetic, and RNAi approaches demonstrates that this adaptive response is critical for HRas-induced proliferation. Paradoxically, reduced ER stress or Xbp1 splicing promotes growth arrest and premature senescence through hyperactivation of the IRE1α RNase. Microarray analysis of IRE1α- and XBP1-depleted cells, validation using RNA cleavage assays, and 5′ RACE identified the prooncogenic basic helix–loop–helix transcription factor ID1 as an IRE1α RNase target. Further, we demonstrate that Id1 degradation by IRE1α is essential for HRas-induced premature senescence. Together, our studies point to IRE1α as an important node for posttranscriptional regulation of the early Ras phenotype that is dependent on both oncogenic signaling as well as stress signals imparted by the tumor microenvironment and could be an important mechanism driving escape from Ras-induced senescence.
Inositol requiring enzyme 1α (IRE1α) is an endoplasmic reticulum (ER) transmembrane kinase/endoribonuclease (RNase) that functions as a major driver of the unfolded protein response (UPR). Accumulation of unfolded proteins causes IRE1α to undergo dimerization and autophosphorylation, which activates its RNase domain (1). A major target of the RNase is X-box binding protein 1 (Xbp1) mRNA, which is critical for induction of genes important in resolution of ER stress (2, 3). IRE1α-induced cleavage at specific sites removes an internal 26-nt intron followed by splicing of the Xbp1 mRNA to generate a new reading frame encoding the active transcription factor, XBP1s (2). IRE1α can target other mRNAs for degradation in a process called regulated IRE1α-dependent decay (RIDD), which functions to reduce levels of mRNAs encoding proteins processed through the ER (4, 5), although transcripts encoding cytosolic or nuclear proteins are also RIDD targets (6, 7). More recent studies implicate RIDD activation in apoptosis following unremitting ER stress (5, 8, 9).
Activation of the UPR occurs frequently in human solid cancers and is an adaptive response to environmental and metabolic stress or aberrant protein expression (10). XBP1 is overexpressed in human cancers and is associated with aggressive disease and the malignant phenotype (11–14). Functions of RIDD are poorly understood, but in a glioblastoma model, RIDD targeting of PER1 mRNA enhances tumorigenesis, while targeting of SPARC reduces tumor migration and invasiveness (6, 15). How these two IRE1α RNase outputs function in early stages of cancer is not known. Expression of a Ras oncogene in primary human or mouse cells causes premature senescence, a well-characterized mechanism of tumor suppression (16–18). While a previous study showed that HRasG12V-driven ER stress was linked to senescence of melanocytes (19), we found that ER stress opposes senescence in epidermal keratinocytes (20). Here, we show that the IRE1α pathway is a critical target of HRas signaling in keratinocytes but that the two outputs of the IRE1α RNase have opposing effects on cell proliferation and premature senescence. While ER stress and IRE1α-mediated Xbp1 splicing enhance HRas-induced proliferation, IRE1α-mediated RIDD promotes premature senescence through degradation of prooncogenic factor Id1 mRNA. Both ER stress and HRas-driven IRE1α overexpression influence Xbp1 splicing and RIDD, revealing a complex role of IRE1α signaling in cancer.
Results
ER Stress and IRE1α-Mediated Xbp1 Splicing Are Required for Maximum HRas-Induced Proliferation.
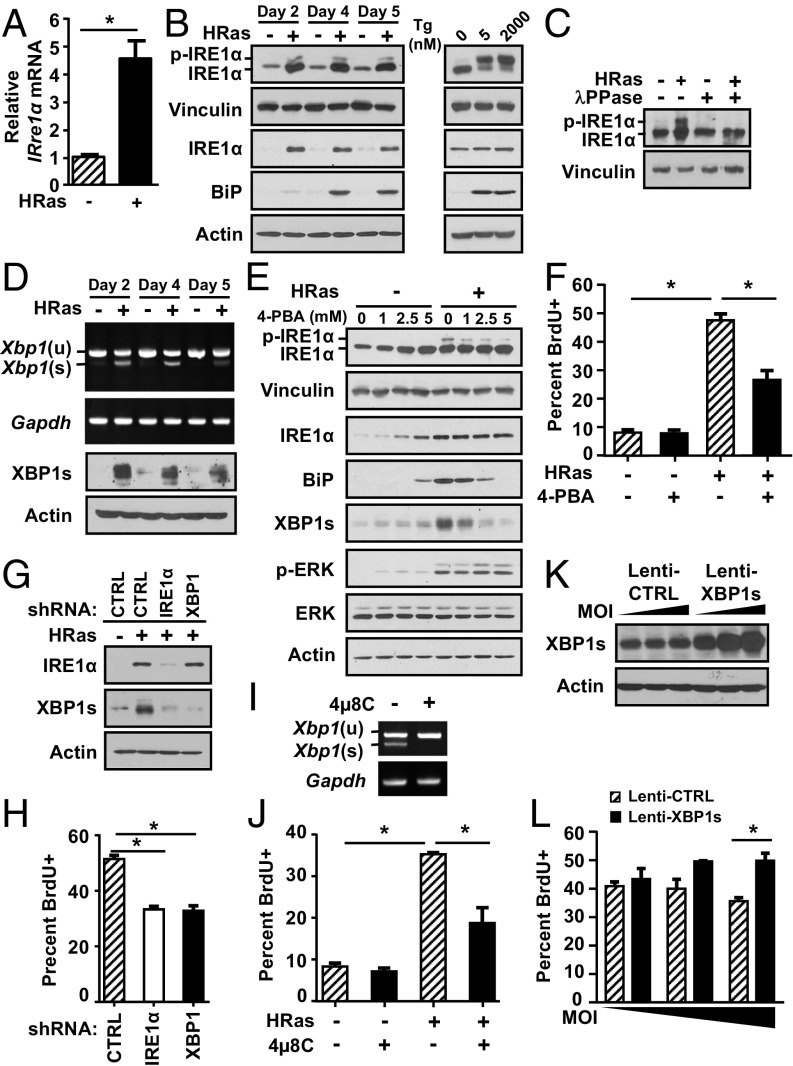
We introduced oncogenic v-Ha-Ras (HRas) into primary mouse keratinocytes using a high-titer retrovirus (17) that causes an initial hyperproliferative phenotype in vitro and benign squamous lesions in vivo (21). HRas induced Ire1α mRNA (Fig. 1A), total IRE1α protein levels (Fig. 1B, Left), and phosphorylated IRE1α which was detected using Phos-Tag SDS/PAGE (22) and validated with λ-phosphatase treatment (Fig. 1C). However, the level of phosphorylated IRE1α was much lower than the level of primary keratinocytes treated with the ER stress inducer thapsigargin at nanomolar concentrations (Fig. 1B, Right). IRE1α-mediated Xbp1 splicing increased in HRas keratinocytes (Fig. 1D), indicating activation of the IRE1α RNase, and this was not solely an in vitro response, as we detected increased Ire1α mRNA and Xbp1 splicing in 7,12-dimethylbenz[a]anthracene/12-O-tetradecanoylphorbol-13-acetate (DMBA/TPA)–generated benign and malignant mouse cutaneous squamous tumors (Fig. S1A) and in tumors from a skin-targeted inducible human RasG12V model (Fig. S1B).
Fig. 1.
ER stress and IRE1α-mediated Xbp1 splicing are required for HRas-induced proliferation. (A) Ire1α mRNA expression in primary and HRas keratinocytes 5 d after transduction. (B, Left) Immunoblots of phosphorylated IRE1α and total IRE1α in primary and HRas keratinocytes at indicated time points. (B, Right) For comparison, primary keratinocytes were treated with the ER stress inducer thapsigargin for 6 h at 5 nM and 2,000 nM. (C) Immunoblot of phosphorylated IRE1α in primary and HRas keratinocytes after treatment of cell lysates with λ-phosphatase. (D) Xbp1(s) and Xbp1(u) mRNA expression (Top) and immunoblot of XBP1s (Bottom) of primary and HRas keratinocytes at indicated time points. (E) Immunoblots of primary and HRas keratinocytes treated with increasing doses of 4-PBA for 24 h. (F) Percent proliferation of HRas keratinocytes after treatment with 2.5 mM 4-PBA for 24 h. Immunoblot analysis (G) and percent proliferation of HRas keratinocytes cotransduced with lentiviral shRNA specific for IRE1α or XBP1 or control (CTRL) shRNA 5 d after transduction (H) are shown. Xbp1(s) and Xbp1(u) mRNA expression (I) and percent proliferation of HRas keratinocytes treated with 4μ8C (20 μM) for 24 h and examined 4 d after transduction (J) are shown. XBP1(s) immunoblot (K) and percent proliferation of HRas keratinocytes cotransduced with 2.5, 5, and 10 multiplicity of infection (MOI) of CTRL or pWPI-Xbp1s lentivirus (L) are shown. In A, F, H, J, and L, data represent mean ± SEM (n = 3). *P < 0.05 as determined by a Student’s t test.
Fig. S1.
Increased IRE1α expression and activation in carcinogen-induced epidermal tumors and transgenic human HRas-generated epidermal tumors. (A) Relative levels of Ire1α and spliced Xbp1 mRNA in normal mouse skin and in benign and malignant epidermal tumors generated by a DMBA/TPA chemical carcinogenesis protocol. (B) Immunoblots of IRE1α, XBP1s, BiP, and p21 Ras in epidermal tumors generated in K14rTA × tetORasG12V double-transgenic mice expressing human tetORasG12V for 28 d. NS, normal skin; Pap, papilloma.
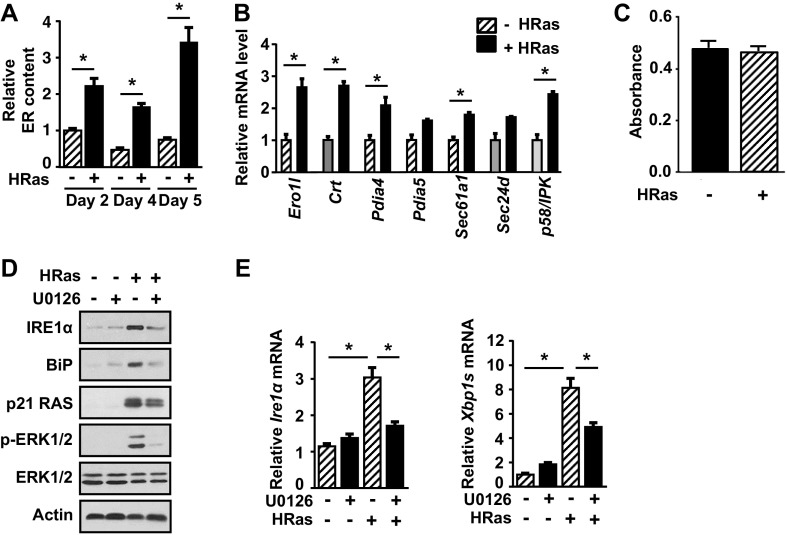
We next examined if ER stress was responsible for IRE1α activation in HRas keratinocytes. HRas caused a marked increase in ER size (Fig. S2A) and an increase in the UPR target genes BiP, Ero1l, Crt, Pdia4, and Pdia5 (Fig. 1B and Fig. S2B), indicating active ER stress. HRas keratinocytes exhibited no difference in viability compared with primary keratinocytes, suggesting active ER stress was adaptive and not apoptotic (Fig. S2C). Treatment with 4-phenyl butyric acid (4-PBA), a molecular chaperone that dampens ER stress by decreasing unfolded proteins in the ER lumen (23), caused a dose-dependent decrease in IRE1α phosphorylation but had no effect on HRas induction of total IRE1α or HRas-activated mitogen-activated protein kinase kinase 1 (MEK)–extracellular signal-regulated kinase (ERK) signaling (Fig. 1E). However, 4-PBA treatment reduced Xbp1 splicing and BiP protein levels, indicating that Xbp1 splicing through IRE1α is dependent on ER stress. In contrast, inhibition of MEK-ERK signaling with UO126 blocked induction of Ire1α mRNA and total IRE1α protein levels and reduced Xbp1 splicing (Fig. S2 D and E). Thus, IRE1α expression is regulated by this Ras effector pathway independent of ER stress. Treatment with 4-PBA reduced proliferation of HRas keratinocytes, suggesting that the increased burden of unfolded proteins and subsequent IRE1α activation is linked to elevated proliferation (Fig. 1F). To directly test if activation of the IRE1α pathway was critical for HRas-induced proliferation, we used lentiviral shRNA to knock down either IRE1α or XBP1 in HRas keratinocytes. Both shRNAs caused a significant and similar decrease in Xbp1 splicing (Fig. 1G) and in proliferation compared with nontarget control shRNA (Fig. 1H). Similarly, a 24-h treatment with a noncytotoxic dose of the IRE1α RNase inhibitor 4μ8C (24) completely blocked Xbp1 splicing and reduced proliferation (Fig. 1 I and J), while cotransduction of HRas keratinocytes with a lentivirus expressing XBP1s (Fig. 1K) caused an increase in proliferation (Fig. 1L).
Fig. S2.
HRas causes ER stress in keratinocytes dependent on the MEK-ERK pathway. (A) Measurement of HRas-induced changes in ER content per cell with ER-Tracker Green at different time points. (B) Relative levels of indicated UPR target genes in primary and HRas keratinocytes 5 d after transduction. (C) Thiazolyl Blue tetrazolium bromide assay measuring viability of primary and HRas keratinocytes 5 d after transduction. (D) Immunoblots of primary and HRas keratinocytes after treatment with DMSO or 5 μM U0126 for 48 h. (E) Relative levels of Ire1α and Xbp1s mRNA in primary or HRas keratinocytes treated as in C. In A, B, and D, data represent mean ± SEM (n = 3). *P < 0.05 as determined by a Student’s t test.
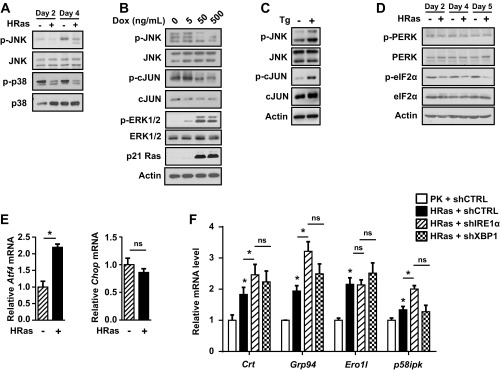
While Xbp1 splicing increased in response to HRas, there was a decrease in phosphorylation of JNK and p38 kinases at 2 d and 4 d after transduction (Fig. S3A), and expression of HRas using primary K14rTA × tetOH-RasG12V keratinocytes with increasing doses of doxycycline showed reduced phosphorylation of JNK and downstream target c-JUN within 24 h (Fig. S3B). In contrast, ER stress induction with thapsigargin caused phosphorylation of JNK, previously shown to be IRE1α-dependent (25), and phosphorylation of c-JUN (Fig. S3C). Together, these results indicate that JNK pathway activation is not a significant response to HRas in keratinocytes. We also examined other UPR pathways that are activated under ER stress conditions. HRas did not cause increased phosphorylation of protein kinase R-like endoplasmic reticulum kinase (PERK) and total PERK protein levels or its downstream target eIF2α (Fig. S3D), and while Atf4 mRNA increased, there was no increase in Chop mRNA, indicating lack of activation of the PERK arm of the UPR (Fig. S3E). Although we were unable to adequately detect activating transcription factor 6 (ATF6), knockdown of IRE1α or XBP1 did not block induction of UPR target genes (Fig. S3F), suggesting a potential relevance of ATF6 in the response to HRas. Nevertheless, our results show that oncogenic HRas promotes IRE1α activation and Xbp1 splicing through the coordinate action of ER stress and MEK-ERK signaling and that this arm of the UPR pathway is required for maximal HRas-driven proliferation.
Fig. S3.
Effect of HRas on UPR pathways. (A) Immunoblots of JNK and p38 activation in primary and HRas keratinocytes at indicated time points. (B) Immunoblots of JNK, c-JUN, and ERK1/2 phosphorylation in keratinocytes expressing a doxycycline (Dox)-inducible HRasG12V 24 h after HRas induction. (C) Immunoblots showing activation of JNK pathway in primary keratinocytes by treatment with thapsigargin (Tg) for 90 min. (D) Immunoblots of p-PERK, PERK, p-eIF2a, and eIF2a in primary or HRas-transduced keratinocytes at indicated time points. (E) Relative levels of Atf4 and Chop mRNA in primary and HRas keratinocytes 5 d after transduction. (F) Relative level of ER stress target genes in primary keratinocytes (PK) transduced with shCTRL, and HRas keratinocytes cotransduced with shCTRL, shIRE1α, or shXBP1 lentivirus. Values are normalized to PK + shCTRL. In E and F, data represent mean ± SEM (n = 3). *P < 0.05 as determined by a Student’s t test. ns, nonsignificant; shCTRL, shcontrol.
IRE1α Promotes HRas-Induced Senescence Under Reduced ER Stress.
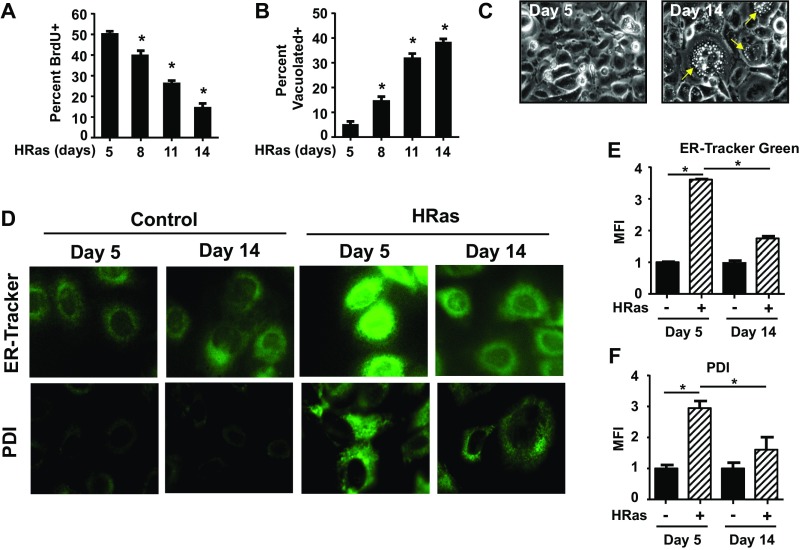
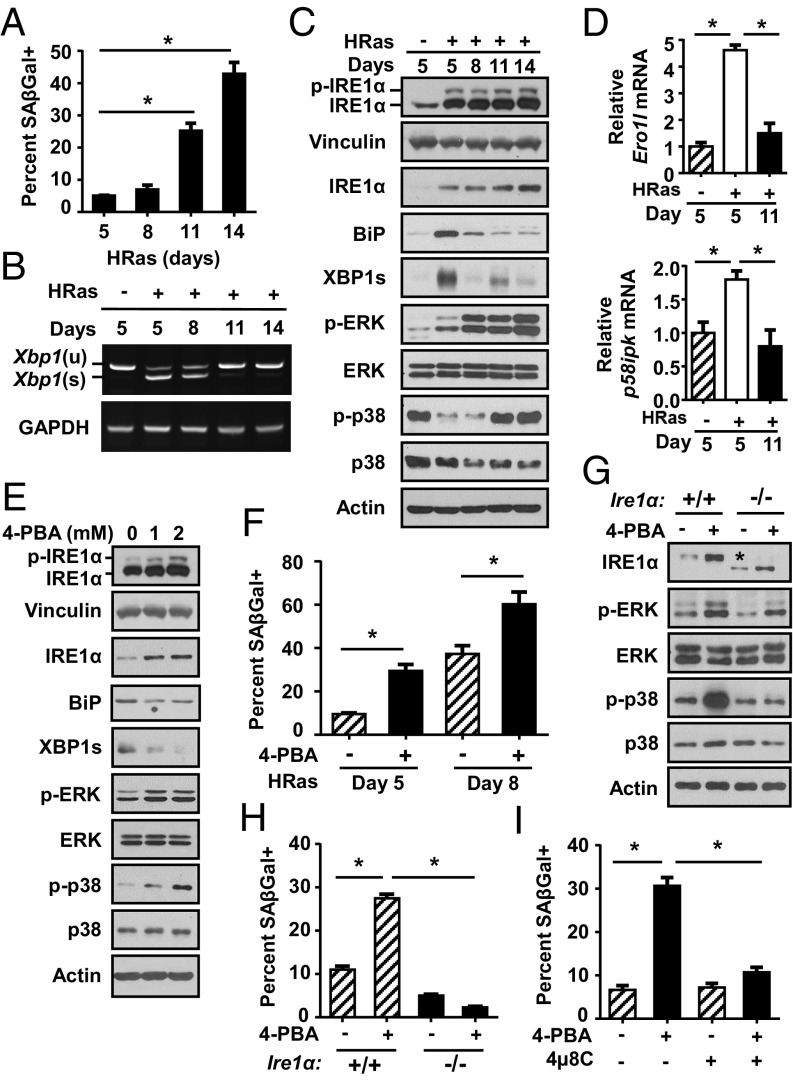
We next sought to understand the role of ER stress and IRE1α during premature senescence. Following the initial proliferative response, keratinocytes expressing oncogenic HRas undergo premature senescence after 7–10 d, characterized by growth arrest (Fig. S4A) and increased senescence-associated β-galactosidase (SA–β-gal) activity (17, 26) (Fig. 2A). These cells were heavily vacuolated (Fig. S4 B and C) and had high levels of MAPK pathway proteins, such as phosphorylated p38 and ERK1/2 kinases, which paradoxically promote senescence (27–29) (Fig. 2C). Senescence occurred in parallel with reduced expression of several markers of ER stress, including UPR target genes Ero1l and p58ipk (Fig. 2D), Xbp1 splicing, and BiP (Fig. 2 B and C). In addition, ER-Tracker Green and protein disulfide isomerase staining (Fig. S4D) showed reduced ER content in HRas keratinocytes undergoing senescence compared with earlier time points (Fig. S4 E and F), further suggesting dampening of the ER stress response. In contrast, total IRE1α protein levels and, to a lesser extent, phosphorylated IRE1α increased in cells undergoing senescence, paralleling increased MAPK signaling (Fig. 2C). Reduction of ER stress with prolonged 4-PBA treatment led to decreased Xbp1 splicing and BiP protein levels as expected, but also increased total and phosphorylated IRE1α (Fig. 2E) and increased senescence (Fig. 2F). Given that IRE1α can function with no overt signs of an ER stress response (1), we hypothesized that despite reduced Xbp1 splicing and other markers of ER stress, increased IRE1α may promote senescence. To test this, we introduced HRas into primary Ire1αfl/fl keratinocytes, deleted IRE1α with a Cre adenovirus, and measured accelerated senescence induced by 4-PBA (Fig. 2G). Ire1α deletion completely blocked the increase in SA–β-gal–positive cells (Fig. 2H) and significantly decreased p38 and ERK1/2 kinase activation caused by 4-PBA (Fig. 2G). Similar results were observed with the IRE1α RNase inhibitor 4µ8C (Fig. 2I), although some cytotoxicity was observed after prolonged treatment. These results indicate that in keratinocytes expressing oncogenic HRas, reduced ER stress accelerates premature senescence dependent on an intact IRE1α RNase pathway.
Fig. S4.
Increased vacuolization and reduced ER content during HRas-induced senescence. (A) Percent proliferating keratinocytes at indicated times after transduction with HRas. (B) Percent vacuolized HRas keratinocytes at indicated times after transduction. (C) Representative photomicrographs of vacuolization in HRas keratinocytes at day 5 and day 14 after transduction. Yellow arrows indicate vacuoles present in cytoplasm of cells. (Original magnification: 20×.) (D) Representative photomicrographs of ER-Tracker Green staining (Top) and PDI immunofluorescence (Bottom) in primary and HRas keratinocytes at indicated time points after transduction. (Original magnification: 40×.) (E) Quantitation of ER content in HRas keratinocytes during proliferation and senescence from ER-Tracker Green–stained cells grown on μ-slides. Mean fluorescence intensity (MFI) of each individual cell was normalized to cell size and expressed as fold-change compared with primary keratinocytes at the same time point. (F) Quantitation of PDI immunofluorescence in groups similar to E. In A and B, data represent mean ± SEM (n = 3). In E and F, data represent mean ± SEM (n = 2) *P ≤ 0.05 as determined by a Student’s t test.
Fig. 2.
Reduced ER stress accelerates HRas-induced senescence dependent on IRE1α. (A) Percent senescence at indicated time points after HRas transduction. Xbp1(s) and Xbp1(u) mRNA expression (B) and immunoblots of IRE1α and Ras pathway proteins at indicated time points after HRas transduction (C) are shown. (D) qPCR analysis of Ero1l and p58ipk at indicated time points after HRas transduction. (E) Immunoblots of HRas keratinocytes on day 5 posttransduction after treatment with 4-PBA for 3 d. (F) Percent senescence of HRas keratinocytes at indicated time points after treatment with 4-PBA (2 mM) for 3 and 6 d. Immunoblot analysis (G) and percent senescent cells after treatment of Ire1α+/+ and Ire1α −/− HRas keratinocytes with 4-PBA (2 mM) for 3 d and examined 5 d after transduction (H) are shown. The asterisk in G represents truncated inactive IRE1α generated by Cre deletion. (I) Percent senescence of HRas keratinocytes after treatment with 4-PBA (2 mM), 4μ8C (20 μM), or in combination for 3 d and examined 5 d after transduction. In A, D, F, H, and I, data represent mean ± SEM (n = 3). *P < 0.05 as determined by a Student’s t test.
Opposing Roles of IRE1α and XBP1 During HRas-Induced Senescence.
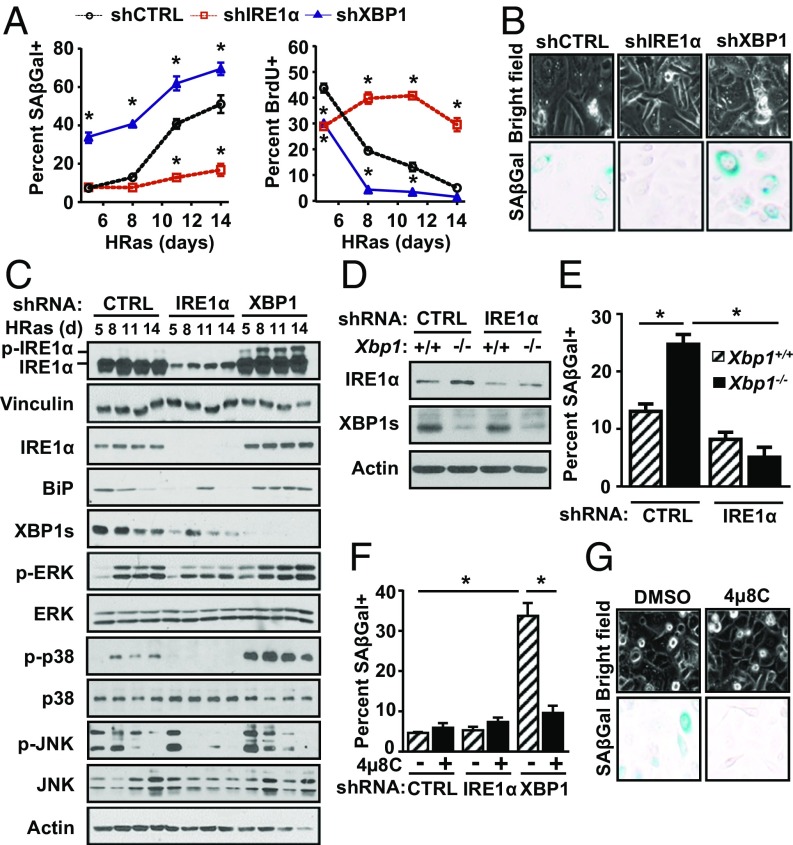
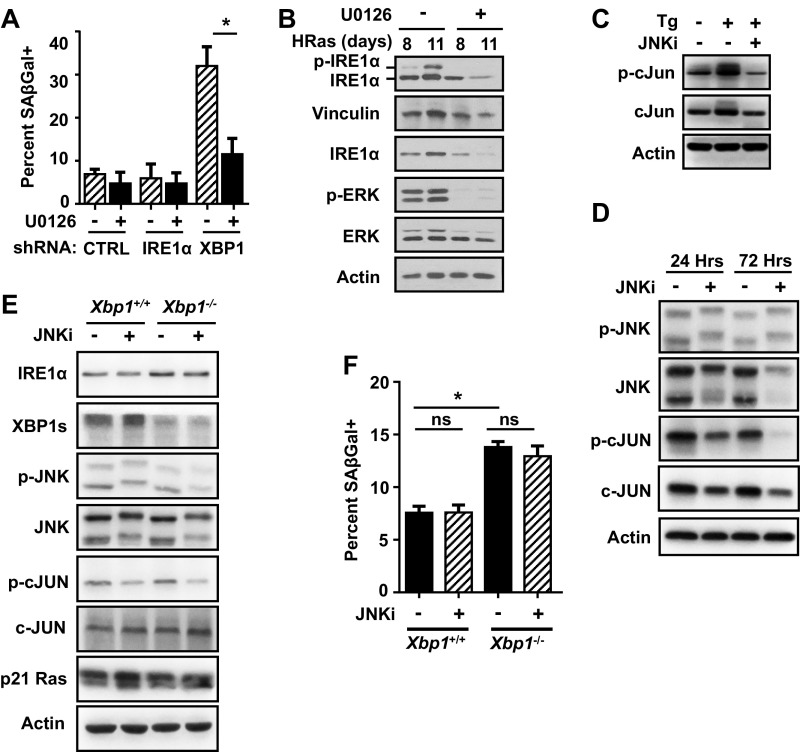
To further examine the role of IRE1α in the senescence response, we compared effects of prolonged IRE1α or XBP1 knockdown in HRas keratinocytes. While short-term IRE1α knockdown reduced proliferation during the initial proliferative phase as expected, long-term IRE1α knockdown blocked induction of senescence instead, causing sustained hyperproliferation (Fig. 3 A and B). In contrast, XBP1 knockdown accelerated growth arrest and senescence (Fig. 3 A and B). Consistent with accelerated senescence, XBP1 knockdown caused an early and sustained increase in phosphorylated p38 and ERK1/2 kinases, while in cells with IRE1α knockdown and sustained proliferation, these were reduced (Fig. 3C). This increase was specific for p38 and ERK 1/2 kinases as phosphorylated JNK levels decreased independent of specific knockdown (Fig. 3C). XBP1 knockdown also increased phosphorylated and total IRE1α protein levels (Fig. 3C), as previously shown in other physiological models of XBP1 deletion (9, 30, 31). Blockade of MEK-ERK signaling in these cells significantly suppressed the accelerated senescence response (Fig. S5A), as well as phosphorylated IRE1α and total IRE1α protein levels (Fig. S5B).
Fig. 3.
IRE1α RNase promotes senescence in the absence of mRNA cleavage target Xbp1. (A) Percent senescence (Left) and percent proliferation (Right) of HRas keratinocytes cotransduced with lentiviral shRNA specific for IRE1α, XBP1, or control (CTRL) shRNA at indicated time points after transduction. (B) Representative images of cellular vacuolization (Top) and SA–β-gal staining (Bottom) of groups in A. (Original magnification: 20×.) (C) Immunoblot analysis of groups in A. Immunoblots (D) and percent senescence of Xbp1+/+ and Xbp1−/− HRas keratinocytes cotransduced with lentiviral shRNA specific for IRE1α or CTRL shRNA and examined 5 d after transduction (E) are shown. (F) Percent senescence on day 5 posttransduction of HRas keratinocytes cotransduced with lentiviral shRNA specific for IRE1α, XBP1, or CTRL shRNA and treated with 4μ8C (20 μM) for 3 d. (G) Representative images of cellular vacuolization (Top) and SA–β-gal staining (Bottom) of groups in F. (Original magnification: 20×.) In A, E, and F, data represent mean ± SEM (n = 3). *P < 0.05 as determined by a Student’s t test.
Fig. S5.
MEK but not JNK inhibition blocks accelerated senescence due to XBP1 knockdown. (A) Percent senescence in day 5 HRas keratinocytes cotransduced with shCTRL (shcontrol), shIRE1α, or shXBP1 lentivirus and treated with 5 μM U0126 for 3 d. (B) Immunoblots of day 8 and day 11 HRas keratinocytes cotransduced with shXBP1 and treated with 5 μM U0126 for 6 and 9 d, respectively. (C) Immunoblots of primary keratinocytes treated with thapsigargin (Tg) in the presence or absence of 5 μM cell-permeable JNK inhibitor XVI (JNKi) for 90 min. (D) Immunoblots of HRas keratinocytes treated with 5 μM JNKi for indicated times. (E) Immunoblots of Xbp1+/+ and Xbp1−/− HRas keratinocytes treated with 5 μM JNKi and harvested 5 d after transduction. (F) Percent senescence of cells treated as in E. In A and F, data represent mean ± SEM (n = 3). *P < 0.05 as determined by a Student’s t test. ns, nonsignificant.
To test if accelerated senescence caused by XBP1 knockdown was driven by IRE1α hyperactivation similar to 4-PBA, we deleted Xbp1 with Cre adenovirus in primary Xbp1fl/fl keratinocytes, followed by shRNA knockdown of IRE1α. Xbp1 deletion accelerated senescence of HRas keratinocytes as expected but was blocked by IRE1α knockdown (Fig. 3 D and E). Similarly, 4µ8C treatment also blocked the accelerated senescence response (Fig. 3 F and G). In contrast, treatment of primary keratinocytes with a cell-permeable JNK inhibitor that blocked thapsigargin-induced c-JUN phosphorylation (Fig. S5C) and reduced basal levels of phosphorylated c-JUN in both control and Xbp1-deleted HRas keratinocytes (Fig. S5 D and E) had no impact on basal and accelerated senescence in either genotype (Fig. S5F). Taken together, these results implicate IRE1α RNase activity independent of XBP1 and JNK signaling in HRas-induced senescence.
Cleavage of Id1 mRNA by IRE1α Mediates HRas-Induced Senescence.
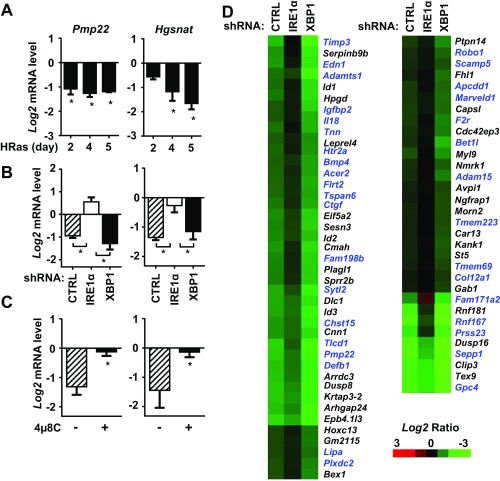
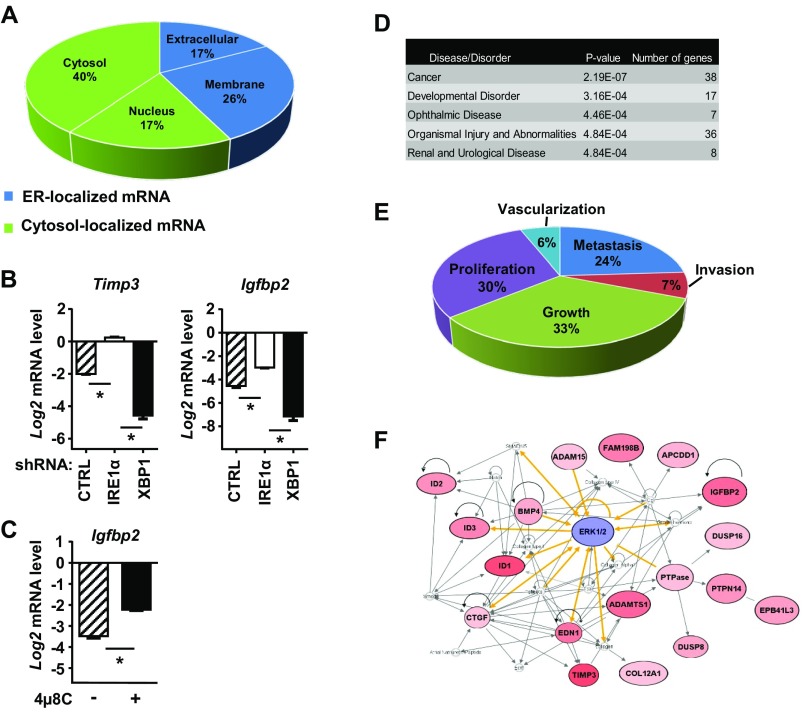
Degradation of cellular mRNAs through RIDD is a second activity of the IRE1α RNase that is essential for physiological processes, such as lipid metabolism, pancreatic β-cell homeostasis, and innate and adaptive immunity (9, 30, 32, 33). We determined that two previously characterized RIDD mRNA targets, peripheral myelin protein 22 (Pmp22) and heparan–α-glucosaminide N-acetyltransferase (Hgsnat) (4, 24), were down-regulated by HRas in an IRE1α-dependent manner (Fig. S6 A–C), showing that both Xbp1 splicing and RIDD functions of IRE1α are coordinately activated by oncogenic HRas. Using a microarray screen of HRas keratinocytes with IRE1α or XBP1 knockdown to identify specific RIDD targets that may be critical for induction of the senescence response (RIDD target criteria are discussed in Materials and Methods), we found 73 mRNAs whose down-regulation by oncogenic HRas was IRE1α-dependent, including RIDD target Pmp22 (Fig. S6D and Table S1). Many of these targets exhibited enhanced down-regulation in XBP1 knockdown cells, paralleling increased IRE1α activation (Fig. S6D and Table S1). Annotation of these mRNAs showed that 43% encoded secretory pathway proteins, while 57% encoded cytosolic or nuclear proteins (Fig. S7A). Top targets included the secretory proteins insulin-like growth factor binding protein 2 (Igfbp2) and matrix metalloproteinase inhibitor (Timp3). IRE1α-dependent down-regulation of these two mRNAs was confirmed by shRNA knockdown in HRas keratinocytes (Fig. S7B) and by treatment with 4μ8C for 24 h (Fig. S7C). Bioinformatic analysis showed that 38 of the putative RIDD mRNA targets, including Igfbp2 and Timp3, were strongly associated with cancer progression (Fig. S7D). Sixty-three percent of these targets were linked to cell growth/proliferation, while 37% were linked to the metastatic phenotype (Fig. S7E), suggesting that IRE1α signaling may promote senescence in HRas keratinocytes by down-regulating genes that are prooncogenic. Pathway analysis revealed that ERK1/2 was a major node of regulation for these genes (Fig. S7F), consistent with effects of U0126 on IRE1α activation and signaling during proliferation and senescence (Fig. 4 and Fig. S3).
Fig. S6.
Identification of potential RIDD targets in HRas keratinocytes. Relative expression of known RIDD targets Pmp22 and Hgsnat at indicated times after HRas transduction (A); 5 d after cotransduction with shCTRL, shIRE1α, or shXBP1 lentivirus (B); and 48 h with IRE1α RNase inhibitor 4μ8C (20 μM) (C) is shown. Expression at each time point, as measured by qPCR, was normalized to primary keratinocytes or shCTRL-infected primary keratinocytes or treated with vehicle, respectively. (D) Heat map of IRE1α-dependent down-regulated genes in HRas keratinocytes identified by microarray analysis. The genes named in blue indicate the secretory pathway proteins, and the genes named in black indicate the cytosolic/nuclear proteins. HRas keratinocytes were cotransduced with shCTRL, shIRE1α, or shXBP1 lentivirus, and after 5 d, down-regulated genes dependent on IRE1α were identified as described in SI Materials and Methods. In A–C, data represent mean ± SEM (n = 3). *P < 0.05 as determined by a Student’s t test. CTRL, control.
Table S1.
Candidate IRE1α-RIDD mRNA targets in HRas expressing primary mouse keratinocytes
| Mean log2 (HRas/primary keratinocyte) | ||||||
| Gene symbol | Gene name | Unigene ID | Cellular location | shControl | shIRE1α | shXBP1 |
| Hpgd | Hydroxyprostaglandin dehydrogenase 15-(NAD) | Mm.18832 | Cytosol | −1.41 | 0.93 | −2.04 |
| Timp3 | Tissue inhibitor of metalloproteinase 3 | Mm. 4871 | ECM | −2.37 | −0.59 | −2.96 |
| Id1 | Inhibitor of DNA binding 1 | Mm. 444 | Nucleus | −2.62 | −0.91 | −3.00 |
| Serpinb9b | Serpin peptidase inhibitor, clade B (ovalbumin), member 9 | Mm. 45371 | Cytosol | −1.70 | −0.03 | −2.47 |
| Il18 | Interleukin 18 | Mm. 1410 | ECM | −3.03 | −1.52 | −4.41 |
| Adamts1 | ADAM metallopeptidase with thrombospondin type 1 motif, 1 | Mm. 1421 | ECM | −2.02 | −0.60 | −2.45 |
| Igfbp2 | Insulin-like growth factor binding protein 2 | Mm. 141936 | ECM | −3.88 | −2.46 | −5.44 |
| Edn1 | Endothelin 1 | Mm. 14543 | ECM | −1.41 | −0.09 | −2.03 |
| Fam198b | Family with sequence similarity 198, member b | Mm. 460017 | Golgi membrane | −1.19 | 0.02 | −1.44 |
| Id3 | Inhibitor of DNA binding 3 | Mm. 110 | Nucleus | −1.45 | −0.30 | −1.98 |
| Cmah | Cytidine monophospho-N-acetylneuraminic acid hydroxylase | Mm. 8396 | Cytosol | −2.15 | −1.02 | −2.46 |
| Plagl1 | Pleiomorphic adenoma gene-like 1 | Mm. 287857 | Nucleus | −1.43 | −0.32 | −1.61 |
| Id2 | Inhibitor of DNA binding 2 | Mm. 34871 | Nucleus | −2.72 | −1.67 | −3.06 |
| Fhl1 | Four and a half LIM domains 1 | Mm. 3126 | Cytosol, nucleus | −0.99 | 0.06 | −1.10 |
| Scamp5 | Secretory carrier membrane protein 5 | Mm. 102278 | Plasma membrane | −0.59 | 0.45 | −0.66 |
| Sytl2 | Synaptotagmin-like 2 | Mm. 26751 | Plasma membrane | −1.23 | −0.19 | −1.50 |
| Cnn1 | Calponin 1 | Mm. 4356 | Cytosol | −2.79 | −1.76 | −3.30 |
| Sprr2b | Small proline-rich protein 2b | Mm. 445310 | Cytosol | −2.17 | −1.14 | −2.34 |
| Robo1 | Roundabout, axon guidance receptor, homolog 1 | Mm. 310772 | Plasma membrane | −2.21 | −1.18 | −2.25 |
| Ptpn14 | Protein tyrosine phosphatase receptor 14 | Mm. 4498 | Cytosol | −1.50 | −0.48 | −1.52 |
| Dlc1 | Deleted in liver cancer 1 | Mm.125155 | Cytosol | −0.96 | 0.05 | −1.25 |
| Chst15 | Carbohydrate (N-acetylgalactosamine 4-sulfate 6-O) sulfotransferase 15 | Mm. 213582 | Golgi membrane | −0.95 | 0.03 | −1.41 |
| Krtap3-2 | Keratin-associated protein 3-2 | Mm. 46389 | Cytosol | −0.92 | 0.01 | −0.96 |
| Epb4.1l3 | Erythrocyte membrane protein band 4.1-like 3 | Mm. 131135 | Cytosol | −1.20 | −0.27 | −1.31 |
| Arrdc3 | Arrestin domain containing 3 | Mm. 423137 | Cytosol | −2.48 | −1.60 | −2.71 |
| Gm2115 | Unknown | Mm. 44882 | Unknown | −0.70 | 0.18 | −0.86 |
| Arhgap24 | Rho GTPase-activating protein 24 | Mm. 440191 | Cytosol | −1.43 | −0.56 | −1.46 |
| Dusp8 | Dual-specificity phosphatase 8 | Mm. 39725 | Cytosol, nucleus | −2.28 | −1.42 | −2.49 |
| Hoxc13 | Homeobox c13 | Mm. 207062 | Nucleus | −1.91 | −1.07 | −2.08 |
| Bex1 | Brain expressed, X-linked 1 | Mm. 422943 | Cytosol, nucleus | −5.92 | −5.08 | −6.03 |
| Flrt2 | Fibronectin leucine-rich transmembrane protein 2 | Mm. 341948 | Plasma membrane | −1.82 | −0.98 | −2.38 |
| Bmp4 | Bone morphogenetic protein 4 | Mm. 6813 | ECM | −1.41 | −0.57 | −1.89 |
| Tlcd1 | TLC domain containing 1 | Mm. 390375 | Plasma membrane | −0.66 | 0.17 | −1.02 |
| Pmp22 | Peripheral myelin protein 22 | Mm. 1237 | ECM | −1.18 | −0.37 | −1.47 |
| Tnn | Tenascin N | Mm. 90140 | ECM | −1.13 | −0.32 | −1.92 |
| Htr2a | 5-Hydroxytryptamine (serotonin) receptor 2A | Mm. 214351 | Plasma membrane | −1.31 | −0.51 | −1.81 |
| Lipa | Lipase A | Mm. 157545 | Lysosome | −0.93 | −0.13 | −1.06 |
| Plxdc2 | Plexin domain containing 2 | Mm. 313938 | Plasma membrane | −1.48 | −0.69 | −1.62 |
| Defb1 | Defensin, beta 1 | Mm. 431316 | ECM | −3.59 | −2.79 | −3.84 |
| Gpc4 | Glypican 4 | Mm. 1528 | ECM | −3.17 | −2.39 | −3.22 |
| Tex9 | Testis expressed 9 | Mm. 14485 | Unknown | −0.65 | 0.11 | −0.67 |
| Acer2 | Alkaline ceramidase 2 | Mm. 45019 | Golgi membrane | −1.30 | −0.54 | −1.79 |
| F2r | Coagulation factor II (thrombin) receptor | Mm. 24816 | Plasma membrane | −1.86 | −1.11 | −2.09 |
| Capsl | Calcyphosine-like | Mm. 82143 | Cytosol | −0.71 | 0.03 | −0.98 |
| Tspan6 | Tetraspanin 6 | Mm. 46701 | Plasma membrane | −0.62 | 0.12 | −1.27 |
| Cdc42ep3 | CDC42 effector protein (Rho GTPase binding) 3 | Mm. 140601 | Cytosol | −1.21 | −0.48 | −1.43 |
| Apcdd1 | Adenomatosis polyposis coli down-regulated 1 | Mm. 391102 | Plasma membrane | −1.74 | −1.01 | −1.91 |
| Bet1l | Blocked early in transport 1 homolog-like | Mm. 155696 | Golgi membrane | −0.91 | −0.19 | −1.15 |
| Clip3 | CAP-GLY domain containing linker protein 3 | Mm. 159258 | Cytosol | −0.77 | −0.06 | −0.83 |
| Morn2 | MORN repeat containing 2 | Mm. 45208 | Unknown | −1.67 | −0.96 | −1.81 |
| Marveld1 | MARVEL domain containing 1 | Mm. 206250 | Plasma membrane | −1.39 | −0.68 | −1.60 |
| Myl9 | Myosin regulatory light chain 9 | Mm. 271770 | Cytosol | −3.19 | −2.51 | −3.53 |
| Tmem223 | Transmembrane protein 223 | Mm. 440071 | MT membrane | −0.61 | 0.06 | −0.78 |
| Sepp1 | Selenoprotein P, plasma, 1 | Mm. 392203 | ECM | −2.00 | −1.34 | −2.07 |
| Sesn3 | Sestrin 3 | Mm. 325126 | Cytosol | −1.26 | −0.60 | −1.80 |
| Eif5a2 | Eukaryotic translation initiation factor 5a2 | Mm. 193670 | Cytosol, nucleus | −0.76 | −0.10 | −1.29 |
| Avpi1 | Arginine vasopressin-induced 1 | Mm. 30060 | Unknown | −0.85 | −0.21 | −1.12 |
| Car13 | Carbonic anhydrase 13 | Mm. 58776 | Cytosol | −0.70 | −0.06 | −0.87 |
| Ngfrap1 | Nerve growth factor receptor-associated protein 1 | Mm. 90787 | Cytosol, nucleus | −2.11 | −1.47 | −2.39 |
| Dusp16 | Dual-specificity phosphatase 16 | Mm. 3994 | Cytosol, nucleus | −1.31 | −0.69 | −1.33 |
| Rnf167 | Ring finger protein 167 | Mm. 261818 | Plasma membrane | −1.69 | −1.07 | −1.77 |
| St5 | Suppression of tumorigenicity 6 | Mm. 252009 | Cytosol | −2.11 | −1.50 | −2.30 |
| Leprel4 | Leprecan-like 4 | Mm. 4940 | Nucleus | −0.97 | −0.37 | −1.83 |
| Prss23 | Protease, serine, 23 | Mm. 250438 | ECM | −2.14 | −1.53 | −2.20 |
| Ctgf | Connective tissue growth factor | Mm. 390287 | ECM | −1.79 | −1.19 | −2.36 |
| Tmem69 | Transmembrane protein 69 | Mm. 291484 | Plasma membrane | −0.65 | −0.05 | −0.87 |
| Adam15 | ADAM metallopeptidase domain 15 | Mm. 274049 | Plasma membrane | −0.78 | −0.19 | −1.05 |
| Rnf181 | Ring finger protein 181 | Mm. 489598 | Cytosol | −0.69 | −0.10 | −0.81 |
| Kank1 | KN motif and ankyrin repeat domains 1 | Mm. 260722 | Cytosol, nucleus | −2.00 | −1.41 | −2.20 |
| Col12a1 | Collagen, type 12, alpha 1 | Mm. 3819 | ECM | −1.37 | −0.78 | −1.59 |
| Nmrk1 | Nicotinamide riboside kinase 1 | Mm. 211595 | Unknown | −1.02 | −0.43 | −1.29 |
| Fam171a2 | Family with sequence similarity 171, member A2 | Mm. 259924 | Plasma membrane | −1.57 | −0.99 | −1.69 |
| Gab1 | GRB2-associated binding protein 1 | Mm. 277409 | Cytosol | −1.50 | −0.91 | −1.73 |
Genes identified by microarray analysis as potential RIDD targets in primary mouse keratinocytes transduced with the v-Ha-Ras retrovirus. Genes were selected as those whose expression was down-regulated by HRas and reversed by IRE1α knockdown and enhanced or unaffected by XBP1 knockdown. Data are expressed as the log2 of the ratio of expression for each gene in primary mouse keratinocytes to that in HRas-transduced keratinocytes with the indicated shRNA.
Fig. S7.
Validation of putative RIDD target genes and association with cancer and the MEK-ERK pathway. (A) Cellular localization of proteins encoded by putative RIDD target mRNAs. Relative levels of mRNAs for secreted proteins Timp3 and Igfbp2 in HRas keratinocytes cotransduced with shCTRL, shIRE1α, or shXBP1 lentivirus (B) or treated either with DMSO or 20 μM 4μ8C for 48 h (C) are shown. Expression values were normalized relative to primary keratinocytes transduced with shCTRL lentivirus or treated with DMSO. (D) Disease analysis using Ingenuity Pathway Analysis (IPA) of IRE1α-dependent genes identified by microarray in HRas keratinocytes. (E) Functional analysis using IPA of IRE1α-dependent genes during cancer progression. (F) ERK signaling is a mediator of IRE1α-dependent genes in cancer. The connectivity network was generated by using IPA. The gene network is represented as nodes and lines between two nodes. Yellow lines denote proteins directly regulated by ERK. Gray lines denote proteins indirectly regulated by ERK. Red indicates protein is higher in cancer than normal. CTRL, control.
Fig. 4.
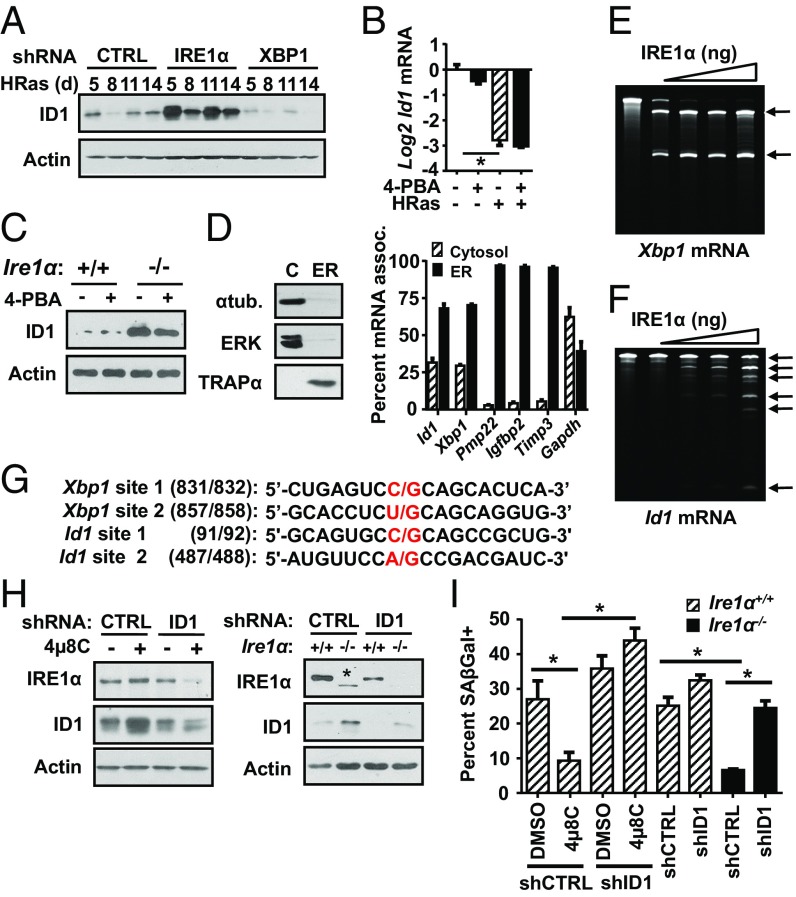
IRE1α mediates HRas-induced senescence through cleavage of Id1 mRNA. (A) Immunoblots of HRas keratinocytes cotransduced with shRNA specific for IRE1α, XBP1, or control (CTRL) shRNA at indicated time points after transduction. (B) qPCR analysis of day 5 HRas keratinocytes treated with 4-PBA (2.5 mM) 24 h before harvest. (C) Immunoblot of ID1 expression in IRE1α+/+ or IRE1α−/− day 5 HRas keratinocytes treated with 4-PBA (2 mM) for 3 d before harvest. (D) Immunoblots of cytosolic and ER resident proteins (Left) and qPCR analysis of IRE1α mRNA targets (Right) from cytosolic and ER fractions isolated from primary keratinocytes by sequential digitonin fractionation. Each mRNA was normalized to 18S, which had an equal distribution in both fractions. Cleavage assay of in vitro-transcribed Xbp1 (E) and Id1 (F) mRNA with increasing amounts of purified human IRE1α cytosolic region (amino acids 465–977). Black arrows indicate cleavage products. (G) Sequence of Id1 mRNA cleavage sites identified by 5′ RACE. Xbp1 mRNA cleavage sites are shown for comparison. (H) Immunoblot analysis of HRas keratinocytes cotransduced with lentiviral shRNA specific for ID1 or CTRL shRNA and treated with 4μ8C (20 μM) for 6 d (Left) or Ire1α+/+ and Ire1α−/− HRas keratinocytes cotransduced with lentiviral shRNA specific for ID1 or CTRL shRNA (Right), with both examined 8 d after transduction. The asterisk represents truncated inactive IRE1α generated by Cre deletion. (I) Percent senescence of groups described in H, B, D, and I represent mean ± SEM (n = 3). *P < 0.05 as determined by a Student’s t test.
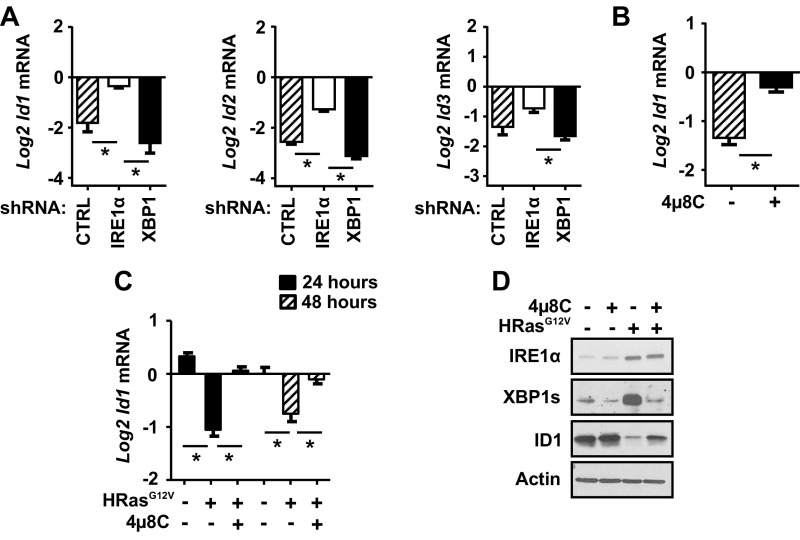
Of the putative RIDD targets identified, a notable group down-regulated by IRE1α comprised three members of the Id family, Id1, Id2, and Id3 (Fig. S6D and Table S1), which are basic helix–loop–helix transcription factors linked to development and cancer (34). In particular, ID1 overexpression is strongly linked to escape from replicative senescence and bypass of Ras-induced senescence (35–37), making it a likely candidate for mediating the senescence block associated with IRE1α depletion. We confirmed IRE1α-dependent down-regulation of Id1 mRNA levels and other family members by shRNA knockdown in HRas keratinocytes (Fig. S8A) and with 4µ8C treatment for 24 h (Fig. S8B). Additionally, in transgenic keratinocytes expressing a doxycycline-inducible human HRASG12V allele, treatment with 4μ8C reversed down-regulation of Id1 mRNA and ID1 protein levels (Fig. S8 C and D). IRE1α knockdown induced ID1 protein levels at all time points examined, paralleling blocked senescence, while XBP1 knockdown enhanced ID1 down-regulation (Fig. 4A). Furthermore, HRas mediated down-regulation of Id1 mRNA was not altered by 4-PBA treatment (Fig. 4B), and 4-PBA did not block increased ID1 protein levels when IRE1α was deleted in HRas-transduced primary Ire1αfl/fl keratinocytes (Fig. 4C). These results link the phenotype of senescence escape under conditions of reduced ER stress in IRE1α-deleted cells to sustained ID1 expression.
Fig. S8.
Regulation of ID1 family expression by IRE1α. (A) Relative levels of mRNAs of the Id family, Id1, Id2, and Id3, in HRas keratinocytes cotransduced with shCTRL, shIRE1α, or shXBP1 lentivirus and examined after 5 d of transduction. (B) Relative levels of Id1 mRNA in HRas keratinocytes after treatment with 20 μM 4μ8C for 24 h. (C) Relative levels of Id1 mRNA in K5rTA × tetOHRASG12V keratinocytes 24 h after induction of human HRASG12V with 1 μg/mL doxycycline with and without 20 μM 4μ8C. Expression was normalized to single transgenic tetoRAS primary keratinocytes in the presence of 1 μg/mL doxycycline. (D) Immunoblots of IRE1α, XBP1s, and ID1 in bitransgenic keratinocytes after induction of human HRASG12V in K5rTA × tetOHRASG12V keratinocytes with 1 μg/mL doxycycline and treated either with DMSO or 20 μM 4μ8C for 48 h. In A–C, data represent mean ± SEM (n = 3). *P < 0.05 as determined by a Student’s t test. CTRL, control.
We next determined if IRE1α regulates Id1 mRNA levels through a mechanism dependent on direct cleavage. Even though Id1 mRNA is thought to be predominately localized in the cytosol, transcriptomic analysis previously showed enrichment of Id1 mRNA in the ER membrane fraction of mammalian cells (38). To confirm this, we used digitonin fractionation to separate cytosolic and ER-associated mRNAs (39). As expected α-tubulin and ERK1/2 proteins were enriched in the cytosolic fraction, and the ER membrane protein TRAPα was enriched in the ER fraction (Fig. 4D). In agreement with published results, the majority of Id1 mRNA was enriched with the ER fraction (70%) and not the cytosol, similar to Xbp1 mRNA (Fig. 4D), while 95% of the mRNAs for Igfbp2, Timp3, and Pmp22 were enriched in the ER fraction as expected for proteins of the secretory pathway. In contrast, Gapdh mRNA had a near-equal distribution in the cytosolic and ER fractions (Fig. 4D).
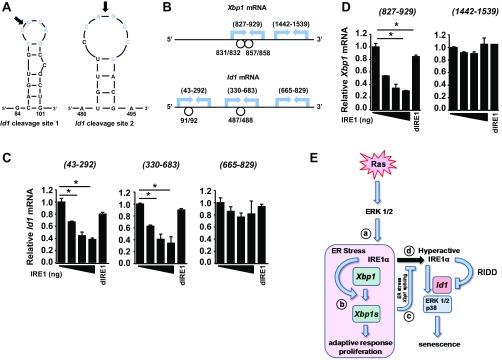
To directly demonstrate cleavage by IRE1α, we incubated in vitro-transcribed Id1 mRNA with recombinant IRE1α protein. As expected, IRE1α cleaved Xbp1 mRNA into two fragments of the expected sizes (Fig. 4E). Importantly, in vitro-transcribed Id1 mRNA was also cleaved by IRE1α, producing two major cleavage fragments and several minor fragments (Fig. 4F). Using 5′ RACE, we identified two cleavage sites in Id1 mRNA that are similar in sequence to the known Xbp1 mRNA cleavage sites (Fig. 4G), form stem–loop structures similar to Xbp1 mRNA and other IRE1α cleavage targets (40) (Fig. S9A), and produce predicted fragments consistent in size with the two major fragments identified by the cleavage assay. When purified total RNA from primary keratinocytes was incubated with recombinant IRE1α, and subsequent cDNA was amplified using primers that spanned these predicted IRE1α cleavage sites (Fig. S9B), Id1 mRNA was significantly reduced compared with primers that spanned a region lacking these cleavage sites (Fig. S9C). Similar reduced amplification of Xbp1 mRNA occurred with primers that spanned known cleavage sites, but not with noncleavage site primers (Fig. S9D). Thus, IRE1α can promote sequence-specific cleavage of both in vitro-transcribed and endogenous Id1 mRNA.
Fig. S9.
IRE1α cleaves purified cellular Id1 and Xbp1 mRNA. (A) Predicted stem loop structure at IRE1α cleavage sites (arrow) on Id1 mRNA. (B) Positions of PCR primers used to detect cleavage of cellular Xbp1 and Id1 mRNA by IRE1α. Circles represent relative positions of stem loops containing cleavage site determined by in vitro cleavage reaction and 5′ RACE (Id1) and a known cleavage site (Xbp1). Amplification of Id1 (C) or Xbp1 (D) sequences bracketing potential IRE1α cleavage sites or noncleavage sites after incubation of total keratinocyte cellular RNA with the recombinant IRE1α cytosolic domain is shown. dIRE1, total RNA was incubated with heat denatured IRE1α. Amplification of each sample was normalized to GAPDH. In C and D, data represent mean ± SEM (n = 2). *P < 0.05 as determined by a Student’s t test. (E) Model of IRE1α outputs and their role in the response to oncogenic HRas. HRas induces and activates IRE1α through the MEK-ERK pathway (a) and ER stress (b). Together, this causes increased Xbp1 splicing as well as degradation of RIDD substrates, including Id1 mRNA. Under these conditions, ER stress-dependent Xbp1 splicing is an adaptive response to stress that promotes proliferation and suppresses senescence due to Id1 mRNA degradation. (c) Subsequent decrease in ER stress leads to reduced Xbp1 splicing, but continued Ras-dependent MEK-ERK signaling sustains IRE1α levels. (d) Reduction in Xbp1 splicing removes a negative feedback on IRE1α activity, allowing for sustained degradation of Id1 mRNA, which drives cells toward senescence.
To determine if Id1 mRNA cleavage by IRE1α was critical for HRas-induced senescence, we measured SA–β-gal–positive cells in HRas-transduced Ire1αfl/fl keratinocytes with ID1 knockdown and either genetic or pharmacological inactivation of IRE1α. Fig. 4H shows that 4µ8C treatment or IRE1α deletion increased ID1 protein levels in HRas keratinocytes transduced with nontarget control shRNA and significantly suppressed senescence (Fig. 4I). In contrast, ID1 knockdown (Fig. 4H) completely reversed the suppressive effect of 4µ8c or Ire1α ablation on senescence (Fig. 4I). Collectively, these data support the conclusion that Id1 mRNA is a direct cleavage target of IRE1α and that its degradation by IRE1α is required for HRas-induced senescence.
Discussion
The UPR can generate both adaptive and apoptotic responses, leading to the paradigm that levels of ER stress and distinct UPR outputs determine the balance between cell death and survival during cancer progression (10). Our results expand understanding of the bifunctional nature of the IRE1α RNase in cell fate regulation linked to the earliest stage of cancer. We show that oncogenic HRas induces and activates the IRE1α RNase in primary epidermal keratinocytes through the MEK-ERK pathway and that IRE1α and Xbp1 splicing are elevated in mouse cutaneous squamous tumors. In contrast to primary melanocytes, where HRas engages multiple UPR pathways (19), the lack of changes in PERK and PERK targets, such as p-eIF2α and CHOP, suggests minimal activation of this pathway in keratinocytes. Similarly, the absence of JNK activation and low levels of IRE1α phosphorylation suggest that the activation of IRE1α by HRas is distinct from other ER stress activators. Since knockdown of IRE1α or XBP1 did not reduce expression of many UPR/ER stress target genes induced by HRas, we cannot rule out a possible role for ATF6, although difficulties in detecting expression and activation of ATF6 prevented direct analysis. While it will be important to determine if ATF6 has overlapping or distinct roles in regulating responses to oncogenic HRas, our data clearly show the importance of the IRE1α pathway in proliferation and senescence. IRE1α activation and Xbp1 splicing were proproliferative in HRas keratinocytes and dependent on ER stress for this response. HRas-induced ER stress linked to proliferation was characterized by a rapid expansion of the ER membrane, increased Xbp1 splicing, and up-regulation of several UPR/ER stress target genes. However, during senescence, levels of BiP, p58ipk, and Ero1L, as well as Xbp1 splicing and ER content, were reduced. This adaptive/proproliferative role of ER stress and Xbp1 splicing is consistent with the tumor-promoting and antisenescence role of chemical ER stress activators in the skin (20, 41) and with association of Xbp1 splicing with cancer progression in several human and mouse cancer models (2).
Unexpectedly, modulating ER stress levels or perturbing Xbp1 splicing revealed an alternate RNase output of the IRE1α pathway that is essential for the senescence response. Reduction of ER stress with the chemical chaperone 4-PBA or shRNA knockdown/genetic deletion of XBP1 drastically accelerated the HRas-induced senescence response. Under both conditions, IRE1α phosphorylation and total IRE1α further increased, representing a “hyperactive state” that reflects removal of a negative feedback loop similar to previous studies using targeted XBP1 null mouse models (30, 31). However, due to the nonspecific nature of Phos-tag analysis, it is unclear if this increased phosphorylation is on ser724 or ser726 in the activation loop, which are both normally phosphorylated in response to ER stress, or on additional sites that could modulate IRE1α activity (42). Nevertheless, genetic ablation, shRNA knockdown, or pharmacological inhibition of hyperactive IRE1α blocked senescence and revealed a previously uncharacterized tumor suppressor role for IRE1α.
Degradation of specific mRNA targets by the IRE1α RNase has been linked to diverse normal cellular and metabolic functions (9, 30, 31), as well as to pathological states such as apoptosis caused by prolonged ER stress (43, 44), and to tumor invasiveness and proliferation (6, 15). Thus, the set of mRNAs that can be degradation targets is likely to be dependent on the cell type and stress environment. Of the putative RIDD mRNA targets identified, Id1 is most notable due to its well-characterized antisenescence/prooncogenic function in cancer (35, 36, 45). Based on several lines of evidence, including preferential association of Id1 mRNA to the ER; identification of IRE1α RNase consensus sites; in vitro degradation of Id1 mRNA by purified IRE1α at these sites; and reversal of Id1 mRNA down-regulation by IRE1α knockdown, genetic ablation, or pharmacological RNase inactivation, we conclude that Id1 mRNA is a direct target of the IRE1α RNase. Although other targets and mechanisms may contribute, degradation of Id1 mRNA is critically important in driving senescence as shRNA knockdown reverses reduced senescence due to IRE1α inhibition. Together with previous results showing defective ER stress-induced RIDD in benign pancreatic insulinoma INS-1 cells overexpressing human cancer-associated mutant IRE1α proteins (46), it is clear that alteration of RIDD activity is likely to be important in cancer progression. We propose that oncogenic Ras induces a stress response in primary keratinocytes, in part, through MAPK activation that causes IRE1α up-regulation and activation of both outputs of its RNase (Fig. S9E). Under conditions of ER stress, the proliferative and adaptive functions of Xbp1 splicing predominate, but with time and reduced ER stress, Xbp1 splicing is reduced and prosenescent RIDD targets, such as degradation of Id1 mRNA, drive Ras keratinocytes into senescence. Senescence is further amplified due to increased phosphorylation of ERK1/2, which drives IRE1α hyperactivation and generates a positive feedback loop under reduced ER stress. However, the exact mechanism by which elevated IRE1α under conditions of normally occurring or 4-PBA–induced ER stress reduction could differentially affect Xbp1 splicing and RIDD is unclear.
An emerging model of IRE1α activation is initial formation of IRE1α monomers into dimers and autophosphorylation preferentially linked to Xbp1 mRNA cleavage and splicing, with increasing ER stress levels causing formation of high-order oligomers allowing for relaxed mRNA specificity and degradation of many mRNA targets through RIDD (5, 46). This allows for the adaptive functions of IRE1α mediated through Xbp1 splicing to be separated temporally and quantitatively from the cell death function of RIDD that occurs in response to chemical ER stress. Although speculative and requiring further study, it is possible that similar changes in IRE1α dimer/oligomeric states occur during the response to oncogenic HRas. Taken together, these studies point to IRE1α as an important node for posttranscriptional regulation of the cancer cell phenotype that is dependent on both oncogenic signaling and stress signals imparted by the tumor microenvironment.
Materials and Methods
Antibodies, reagents, and isolation of newborn primary keratinocytes used in this study are described in SI Materials and Methods. All experiments were processed according to standard protocols. Plasmids, viral production and infection, real-time RT-PCR, immunoblot analysis, SA–β-gal staining, 5-bromo-2′-deoxyuridine incorporation, and in vitro RNA cleavage assays, for example, are described in detail in SI Materials and Methods. The microarray dataset was deposited in the Gene Expression Omnibus database (accession no. GSE70899). All animals for tumor studies or generation of primary keratinocyte cultures were housed and treated according to protocols approved by the Pennsylvania State University Institutional Animal Care and Use Committee.
SI Materials and Methods
Plasmids.
Plasmid pLKO.1 constructs containing the target gene shRNA sequences and nontarget controls were obtained from Sigma. The shRNA targeting sequences were as follows: Xbp1: 5′-CCGGCCCAGCTGATTAGTGTCTAAACTCGAGTTTAGACACTAATCAGCTGGGTTTT-3′, Ire1α: 5′-CCGGCCCACTTCTCTTTCTTTCTAACTCGAGTTAGAAAGAAAGAGAAGTGGGTTTTT-3′, and Id1: 5′-CCGGGCGAGGTGGTACTTGGTCTGTCTCGAGACAGACCAAGTACCACCTCG CTTTTTG-3′. Mouse Xbp1s was amplified by PCR and cloned into the pWPI vector (no. 12254; Addgene) using an In-Fusion HD Cloning Kit (Clontech).
Cell Culture.
Primary mouse keratinocytes from either FVB/n or C57BL/6 mouse strains were isolated from 1- to 3-d-old newborn littermates using overnight flotation in 0.25% trypsin at 4 °C and cultured accordingly in Eagle's minimum essential media (LONZA) with 8% Chelex-treated FBS, antibiotics, and 0.05 mM Ca2+. K5rTA and tetORASG12V transgenic mice (47, 48) were crossed to generate bitransgenic newborn mice, and HRASG12V expression was induced in primary keratinocytes with 1 μg/mL doxycycline. Ire1αfl/fl (49) and Xbp1fl/fl (50) mice were obtained from Laurie Glimcher, Dana Farber Cancer Institute, Boston, and A.-H. Lee, Weill Cornell Medical College, Ithaca, NY. The 4μ8C, 4-PBA, U0126, JNK Inhibitor XVI (Cayman Chemical), and thapsigargin in DMSO (0.001% final concentration for vehicle control) were used at concentrations indicated in figures or figure legends. For long-term treatments, drugs were added on day 2 after v-Ha-Ras transduction and added every 2 d with fresh media. All animals used for tumor studies or generation of primary keratinocyte cultures were housed and treated according to approved institutional animal care and use committee protocols.
Generation of Tumors.
Mouse cutaneous tumors and normal skin were from a previous two-stage chemical carcinogenesis study and were validated on H&E as either papillomas or squamous cell carcinoma (SCC) (51). Tumors in double-transgenic mice were generated by dosing mice with 7 μg/mL doxycycline to induce tetOHRasG12V expression, and tumors were harvested after 30 d and validated as SCC by H&E.
Virus Production and Infection.
The HRas retrovirus was generated from ψ2 producer cells as described previously (17). Virus titer was determined using an NIH 3T3 focus-forming assay and was routinely 1 × 10⁷ virus per milliliter. Primary keratinocytes were infected with HRas retrovirus in the presence of 4 μg/mL Polybrene on day 3 of culture at a multiplicity of infection (MOI) of 2–3 to ensure nearly 100% of cells were infected. HEK293T/N cells were used for lentivirus particle production. Transient transfections were performed using Lipofectamine 3000 (Invitrogen) at a 1:1 ratio using a combination of psPAX2 (Addgene, #12260) and pMD2.G (Addgene #12250) and appropriate pLKO.1 shRNA (Sigma) or overexpression vector, and lentiviral supernatants were collected twice over a 72-h period, concentrated by precipitation with ice-cold PEG solution (10% PEG 6000, 0.5 M NaCl), and titered using a quantitative PCR-based assay kit (Applied Biological Materials) following the manufacturer’s instructions. Primary keratinocytes were infected on day 3, along with HRas as described above, with shRNA lentivirus at an MOI of 20–50. After 2 d of transduction, cells were selected with 2 μg/mL puromycin or 100 μg/mL G418 for 2 d, and subsequent analysis at different time points was examined. XBP1s overexpression was monitored by GFP. Ad-Cre was obtained from the University of Iowa viral vector core facility. Floxed or control primary keratinocytes were infected with v-Ha-Ras and, after 24 h, with AdCre at an MOI of 20 and with specific shRNA if indicated.
Measurement of ER Content.
To measure ER content by flow cytometry, cells were grown in six-well plates, stained with ER-Tracker Green (Invitrogen), trypsinized, and analyzed using the FC500 flow cytometer present in the Huck Institute Flow Cytometry Core Facility. The mean fluorescence intensity from the FITC channel was normalized to cell size as determined from forward scatter. To measure ER content by immunofluorescence, cells were grown on eight-well μ-slides (Ibidi) stained with ER-Tracker Green, fixed in 4% paraformaldehyde, and visualized with a BZ-9000 Fluorescence Microscope. ImageJ (NIH) was used to calculate relative fluorescence from 40× magnification images and normalized to cell size from phase-contrast images. At least 25 cells were analyzed in duplicate for each group at the same exposure time. Protein disulphide isomerase (PDI) was visualized in cells grown similarly using an anti-PDI antibody (Cell Signaling) and goat anti-rabbit Alexa Flour 488 (Invitrogen) following suppliers' protocol, and imaged as above using identical exposure times for all groups.
Measurement of Proliferation and Senescence.
To measure proliferation, cells were pulsed with 10 μM 5-bromo-2′-deoxyuridine (BrdU) for 45 min, washed, and fixed in 70% ethanol. Fixed cells were treated with 0.7 M NaOH for 2 min, blocked with 5% normal goat serum, and incubated with mouse anti-BrdU antibody (1:50; Becton Dickinson) for 1 h at room temperature. Labeled cells were identified using goat anti-mouse IgG, an ABC Kit (Vector Laboratories), and 3,3′-diaminobenzidine (DAB) following Vector Laboratories protocol. The number of BrdU-positive cells was quantified by light microscopy and expressed as a percentage of total cells for each treatment group. Three to six different fields from each well were counted (at least 100 cells per field), and triplicate wells were analyzed for each treatment group. Senescent keratinocytes were measured using SA–β-gal as previously described (17), and positive cells were quantified using an inverted microscope and expressed as a percentage of total cells for each treatment group. Three to six different fields from each well were counted (at least 100 cells per field), and triplicate wells were analyzed for each treatment group. To measure cell viability, primary and HRas keratinocytes, 5 d after v-Ha-Ras retrovirus transduction, were incubated with Thiazolyl Blue tetrazolium bromide in quadruplicate wells of a 48-well culture tray for 3 h, and the absorbance at 590 nm was determined.
Immunoblot Analysis.
Whole-cell protein lysates were made in radioimmunoprecipitation assay (RIPA) buffer [50 mM Tris⋅HCl (pH 7.4), 150 mM NaCl, 1% IGEPAL-CA630 [octylphenoxy poly(ethyleneoxy)ethanol], 0.5% sodium deoxycholate, 0.1% SDS, 2 mM EDTA, and protease/phosphatase inhibitors], rotated for 1 h at 4 °C, and centrifuged to clear cellular debris. A total of 20–50 μg of protein was separated on 8–15% SDS/PAGE gels depending on the detected protein and transferred to nitrocellulose using a Trans -Blot TURBO Transfer System (Bio-Rad) according to the manufacturer’s instructions. The primary antibodies used were from Cell Signaling (BiP, phospho-ERK, ERK, phospho-MEK, MEK, IRE1α, phospho-PERK, PERK, phospho-eIF2α, eIF2α, c-JUN, and phospho–c-JUN Ser63), Santa Cruz Biotechnology (p21 Ras and Id1), Biolegend (XBP1s), Abcam (TRAPα), and Invitrogen (α-tubulin). Actin (Millipore) was used as a loading control. Proteins were routinely detected using ECL reagent (Pierce). To measure IRE1α phosphorylation, 5% Phos-tag (Waco) copolymerized SDS/PAGE gels were prepared, run, transferred to PVDF, and immunoblotted for IRE1α (Cell Signaling). Vinculin (Cell Signaling) was used as a loading control for Phos-Tag gels.
Cytosolic and ER Cell Fractionation.
For digitonin fractionation to isolate cytosolic and soluble ER-associated mRNAs, attached cells were first pretreated with cycloheximide (50 μg/mL) for 10 min, washed twice with ice-cold PBS, incubated on ice for 10 min with ice-cold PBS + cycloheximide (50 μg/mL), and incubated with permeabilization buffer [110 mM potassium acetate, 25 mM potassium Hepes (pH 7.5), 1 mM EGTA, 1 mM DTT, 50 μg/mL cycloheximide, 40 U/mL RNasin, 1 μg/mL leupeptin, 1 mM PMSF] + 1 mg/mL digitonin for 30 min with gentle rocking at 4 °C, and soluble cytosolic lysate was drained and transferred to a prechilled microcentrifuge tube. Attached cells were washed once with wash buffer [110 mM potassium acetate, 25 mM potassium Hepes (pH 7.5), 2.5 mM magnesium acetate, 1 mM EGTA, 1 mM DTT, 50 μg/mL cycloheximide, 40 U/mL RNasin, 1 μg/mL leupeptin, 1 mM PMSF] for 5 min and incubated with lysis buffer [400 mM potassium acetate, 25 mM potassium Hepes (pH 7.5), 15 mM magnesium acetate, 1% IGEPAL, 0.5% sodium deoxycholate, 1 mM DTT, 50 μg/mL cycloheximide, 40 U/mL RNasin, 1 μg/mL leupeptin, 1 mM PMSF] for 30 min with gentle rocking at 4 °C, and soluble ER lysate was drained and transferred to a prechilled microcentrifuge tube. Both fractions were then spun at 7,500 × g for 10 min at 4 °C to clear cellular debris and transferred to new prechilled tubes. Protein lysates from cytosolic and ER fractions were concentrated using Amicon Ultra 10K Centrifugal Filters (Millipore) and resuspended in RIPA lysis buffer.
XBP1 Splicing Assay.
cDNA was amplified using primers that bracketed the mouse Xbp1 spliced sequence so that both spliced and unspliced mRNAs were amplified. Products were electrophoresed on a 12% polyacrylamide/TBE (Tris-Borate-EDTA)gel and identified by staining with ethidium bromide. PCR primers were 5′-CTCCTGGGAGGATACTTTTGC-3′ and 5′-CAATGTGATGGTCAGGGAAAG-3′.
In Vitro RNA Cleavage Assays.
In vitro-transcribed RNAs were generated using SP6 polymerase (Megascript SP6; Invitrogen) and specific Mammalian Gene Collection cDNA clones in pCMV-SPORT6 vector (Open Biosystems). In vitro-transcribed products were precipitated with 5 M LiCl, and purified mRNA (5 μg) was incubated at 37 °C for 45 min with the serially diluted cytoplasmic domain of human IRE1α (Sino Biological, Inc.) in a reaction buffer containing 50 mM Tris (pH 7.5), 150 mM NaCl, 1 mM MgCl2, 1 mM MnCl2, 5 mM β-mercaptoethanol, and 2 mM ATP. Cleavage products were run on a TBE-urea polyacrylamide gel and stained with ethidium bromide. For cleavage of cellular RNA, IRE1α (Sino Biologicals) was incubated with total RNA from primary keratinocytes as above for 2 h at 37 °C with heat-inactivated IRE1α as a negative control. cDNA was made from purified RNA and cleavage-quantitated by qRT-PCR using primers flanking regions with or without potential cleavage sites for Id1 and Xbp1 mRNAs. The relative mRNA level for each cleavage reaction was normalized to Gapdh from that reaction. The primers used, with region amplified in parentheses, were as follows:
Id1 (43–292): 5′-CACTCTGTTCTCAGCCTCCTC, 5′-GTGAGTAGCAGCCGTTCATGT
Id1 (330–683): 5′-CAAAGTGAGCAAGGTGGAGAT, 5′-CAAACCCTCTACCCACTGGAC
Id1 (665–829): 5′-CCAGTGGGTAGAGGGTTTGAT, 5′-TTCCTCAGAAATCCGAGAAGC
Xbp1 (827–909): 5′-AGTCCGCAGCACTCAGACTAT, 5′-TGAAGAGGCAACAGTGTCAGA
Xbp1 (1,442–1,539): 5′-CTCCTGGGAGGATACTTTTGC, 5′-CAATGTGATGGTCAGGGAAAG
5′ RACE.
Products of the in vitro cleavage reaction were purified with an RNeasy MinElute Cleanup Kit and incubated with T4 polynucleotide kinase before ligation with RNA 5′ RACE adapter (5′-CUGAUGGCGAUGAAUGAACACUGCGUUUGCUGGCUUUGAUGAAA-3′) using T4 RNA ligase I. Ligated RNA was converted to cDNA and then amplification using RACE outer primer (5′-GCTGATGGCGATGAATGAACACTG-3′) and several reverse primers that spanned Id1 mRNA. PCR products were cloned into a pGEM-T Easy Kit (Promega) and sequenced in the PennState Genomics facility.
RNA Isolation and Quantitative RT-PCR.
Total RNA from whole-cell lysates or from cytosolic and ER fractionation studies was isolated using Ribozol (Amresco) according to the manufacturer’s instructions. Reverse transcription and qPCR were done with intron-spanning primers using a MyIQ cycler (BioRad). Expression was normalized to either Gapdh or 18s. Primer sequences were as follows:
Atf4: 5′-AACAAGACAGCAGCCACTAGGT, 5′-TCTGCCTTCTCTTTCAGAGCCTCA
Crt: 5′-CCTGAATACTCCCCCGATGC, 5′-CCCACGTCTCATTGCCAAAC
Ddit3 (CHOP): 5′-CAGCGACAGAGCCAGAATAA, 5′-GACCAGGTTCTGCTTTCAGG
Dnajc3 (p58IPK): 5′-CACAGTTTCACGCTGCAGTT, 5′-CTCTGTAGTCTTGCGGCAGT
Ero1L1: 5′-GAATGTGAGCAAGCTGAGCG, 5′-CATACTCAGCATCGGGGGAC
Hgsnat: 5′-AGCGCTGATTACCAACCAGAA, 5′-AAACCATGGGAAGACGAGGTC
Id1: 5′-TACGACATGAACGGCTGCTACTCA, 5′-TTACATGCTGCAGGATCTCCACCT
Id2: 5′-TGAACGACTGCTACTCCAAGCTCA, 5′-GTGCTGCAGGATTTCCATCTTGGT
Id3: 5′-ACAAGAGGAGCTTTTGCCACT, 5′-GAGGCGTTGA GTTCAGGGTAA
Igfbp2: 5′-GCGGGTACCTGTGAAAAGAGA, 5′-ATTGACCTTCTCCCGGAACAC
Ire1α: 5′-TGTTTGTCTCGACCCTGGATG, 5′-CGTTGTTCTTGCCTCCAAGTG
Pdia4: 5′-CCTGATTGGACACCTCCACC, 5′-GGGGCAAGTTTCTTGCAGTG
Pdia5: 5′-TGGGGGATAACTTCCGGGAT, 5′-CAGTGAAGTGGGGGATGACC
Pmp22: 5′-TGGCAGAACTGTACCACATCC, 5′-ACGCTGAAGATGACAGACAGG
Sec61a1: 5′-TCTGCAAAAAGGGTACGGCT, 5′-GCGGTAGAATGCCTCTCGAA
Sec24d: 5′-GCGTGCAGAGCAGGGTTATT, 5′-GAAGGCCCCAATGGCTTCAT
Timp3: 5′-GGGAAAGAAGCTGGTGAAGGA, 5′-AGACTTTCAGAGGCTTCCGTG
Xbp1s: 5′-CTGAGTCCGCAGCAGGTG, 5′-TCTGAAGAGGCAACAGTGTCA
Microarray Analysis.
Primary keratinocytes were cotransduced with HRas and control, IRE1α, or XBP1 shRNA for 2 d; selected with puromycin (2 μg/mL) for 2 d, and harvested on day 5. At the same time, primary keratinocytes were transduced with control shRNA, selected with puromycin (2 μg/mL) for 2 d, and harvested on day 5. Total RNA was isolated from three biological replicates for each group and labeled cDNA hybridized to GeneChip Mouse Gene ST 2.0 arrays (Affymetrix) in the Penn State Genomics Core Facility. Scanned arrays were analyzed using ArrayStar 11 Software (DNASTAR) with Robust Microarray Summarization background correction and quantile normalization, and significantly different genes were identified using a 1.5-fold cutoff and 10% false discovery rate using the method of Benjamini and Hochberg (52). The mRNAs were considered potential HRas-specific RIDD targets if they were down-regulated by HRas relative to primary keratinocytes, had down-regulation reversed by IRE1α knockdown, and were unaffected or had enhanced down-regulation by XBP1 knockdown. Hierarchal clustering was generated using Gene Cluster 3.0 and Treeview software (53). Functional annotation was done using DAVID Bioinformatics Software (54), and pathway analysis was done using Ingenuity Pathway Analysis (Invitrogen). The microarray dataset was deposited in the Gene Expression Omnibus archive (accession no. GSE70899).
Statistical Analysis.
Statistical significance was determined using a Student’s t test, with significance determined as P ≤ 0.05.
Acknowledgments
We thank the Huck Institutes of Life Sciences Flow Cytometry Facility and Penn State Genomics Core Facility and the Penn State Animal Research Program and animal caretakers for their help, and we thank Dr. Laurie Glimcher and Dr. Ann-Hwee Lee for Ire1afl/fl and Xbp1fl/fl mice. We also thank Dr. Bokai Zhu and Dr. Jeffrey Peters and The Pennsylvania State University for helpful discussions and sharing of results during early stages of this project. This work was supported by funds from the Department of Veterinary and Biomedical Sciences, the Penn State Institute for Energy and the Environment, and the Elsa U. Pardee Foundation, and by NIH Grant 1 R01 CA197942 (to A.B.G.).
Footnotes
The authors declare no conflict of interest.
This article is a PNAS Direct Submission.
Data deposition: The microarray dataset reported in this paper has been deposited in the Gene Expression Omnibus (GEO) database, https://www.ncbi.nlm.nih.gov/geo (accession no. GSE70899).
This article contains supporting information online at www.pnas.org/lookup/suppl/doi:10.1073/pnas.1701757114/-/DCSupplemental.
References
- 1.Hetz C, Martinon F, Rodriguez D, Glimcher LH. The unfolded protein response: Integrating stress signals through the stress sensor IRE1α. Physiol Rev. 2011;91:1219–1243. doi: 10.1152/physrev.00001.2011. [DOI] [PubMed] [Google Scholar]
- 2.Glimcher LH. XBP1: The last two decades. Ann Rheum Dis. 2010;69(Suppl 1):i67–i71. doi: 10.1136/ard.2009.119388. [DOI] [PubMed] [Google Scholar]
- 3.Lee AH, Iwakoshi NN, Glimcher LH. XBP-1 regulates a subset of endoplasmic reticulum resident chaperone genes in the unfolded protein response. Mol Cell Biol. 2003;23:7448–7459. doi: 10.1128/MCB.23.21.7448-7459.2003. [DOI] [PMC free article] [PubMed] [Google Scholar]
- 4.Hollien J, et al. Regulated Ire1-dependent decay of messenger RNAs in mammalian cells. J Cell Biol. 2009;186:323–331. doi: 10.1083/jcb.200903014. [DOI] [PMC free article] [PubMed] [Google Scholar]
- 5.Han D, et al. IRE1alpha kinase activation modes control alternate endoribonuclease outputs to determine divergent cell fates. Cell. 2009;138:562–575. doi: 10.1016/j.cell.2009.07.017. [DOI] [PMC free article] [PubMed] [Google Scholar]
- 6.Pluquet O, et al. Posttranscriptional regulation of PER1 underlies the oncogenic function of IREα. Cancer Res. 2013;73:4732–4743. doi: 10.1158/0008-5472.CAN-12-3989. [DOI] [PMC free article] [PubMed] [Google Scholar]
- 7.Moore KA, Plant JJ, Gaddam D, Craft J, Hollien J. Regulation of sumo mRNA during endoplasmic reticulum stress. PLoS One. 2013;8:e75723. doi: 10.1371/journal.pone.0075723. [DOI] [PMC free article] [PubMed] [Google Scholar]
- 8.Li H, Korennykh AV, Behrman SL, Walter P. Mammalian endoplasmic reticulum stress sensor IRE1 signals by dynamic clustering. Proc Natl Acad Sci USA. 2010;107:16113–16118. doi: 10.1073/pnas.1010580107. [DOI] [PMC free article] [PubMed] [Google Scholar]
- 9.Lee AH, Heidtman K, Hotamisligil GS, Glimcher LH. Dual and opposing roles of the unfolded protein response regulated by IRE1alpha and XBP1 in proinsulin processing and insulin secretion. Proc Natl Acad Sci USA. 2011;108:8885–8890. doi: 10.1073/pnas.1105564108. [DOI] [PMC free article] [PubMed] [Google Scholar]
- 10.Wang M, Kaufman RJ. The impact of the endoplasmic reticulum protein-folding environment on cancer development. Nat Rev Cancer. 2014;14:581–597. doi: 10.1038/nrc3800. [DOI] [PubMed] [Google Scholar]
- 11.Fujimoto T, et al. Upregulation and overexpression of human X-box binding protein 1 (hXBP-1) gene in primary breast cancers. Breast Cancer. 2003;10:301–306. doi: 10.1007/BF02967649. [DOI] [PubMed] [Google Scholar]
- 12.Fujimoto T, et al. Overexpression of human X-box binding protein 1 (XBP-1) in colorectal adenomas and adenocarcinomas. Anticancer Res. 2007;27:127–131. [PubMed] [Google Scholar]
- 13.Romero-Ramirez L, et al. XBP1 is essential for survival under hypoxic conditions and is required for tumor growth. Cancer Res. 2004;64:5943–5947. doi: 10.1158/0008-5472.CAN-04-1606. [DOI] [PubMed] [Google Scholar]
- 14.Carrasco DR, et al. The differentiation and stress response factor XBP-1 drives multiple myeloma pathogenesis. Cancer Cell. 2007;11:349–360. doi: 10.1016/j.ccr.2007.02.015. [DOI] [PMC free article] [PubMed] [Google Scholar]
- 15.Dejeans N, et al. Autocrine control of glioma cells adhesion and migration through IRE1α-mediated cleavage of SPARC mRNA. J Cell Sci. 2012;125:4278–4287. doi: 10.1242/jcs.099291. [DOI] [PubMed] [Google Scholar]
- 16.Serrano M, Lin AW, McCurrach ME, Beach D, Lowe SW. Oncogenic ras provokes premature cell senescence associated with accumulation of p53 and p16INK4a. Cell. 1997;88:593–602. doi: 10.1016/s0092-8674(00)81902-9. [DOI] [PubMed] [Google Scholar]
- 17.Tremain R, et al. Defects in TGF-beta signaling overcome senescence of mouse keratinocytes expressing v-Ha-ras. Oncogene. 2000;19:1698–1709. doi: 10.1038/sj.onc.1203471. [DOI] [PubMed] [Google Scholar]
- 18.Yeager TR, et al. Overcoming cellular senescence in human cancer pathogenesis. Genes and Development. 1998;12:163–174. doi: 10.1101/gad.12.2.163. [DOI] [PMC free article] [PubMed] [Google Scholar]
- 19.Denoyelle C, et al. Anti-oncogenic role of the endoplasmic reticulum differentially activated by mutations in the MAPK pathway. Nat Cell Biol. 2006;8:1053–1063. doi: 10.1038/ncb1471. [DOI] [PubMed] [Google Scholar]
- 20.Zhu B, et al. The nuclear receptor peroxisome proliferator-activated receptor-β/δ (PPARβ/δ) promotes oncogene-induced cellular senescence through repression of endoplasmic reticulum stress. J Biol Chem. 2014;289:20102–20119. doi: 10.1074/jbc.M114.551069. [DOI] [PMC free article] [PubMed] [Google Scholar]
- 21.Yuspa SH, Dlugosz AA, Denning MF, Glick AB. Multistage carcinogenesis in the skin. J Investig Dermatol Symp Proc. 1996;1:147–150. [PubMed] [Google Scholar]
- 22.Yang L, et al. A Phos-tag-based approach reveals the extent of physiological endoplasmic reticulum stress. PLoS One. 2010;5:e11621. doi: 10.1371/journal.pone.0011621. [DOI] [PMC free article] [PubMed] [Google Scholar]
- 23.Ozcan U, et al. Chemical chaperones reduce ER stress and restore glucose homeostasis in a mouse model of type 2 diabetes. Science. 2006;313:1137–1140. doi: 10.1126/science.1128294. [DOI] [PMC free article] [PubMed] [Google Scholar]
- 24.Cross BC, et al. The molecular basis for selective inhibition of unconventional mRNA splicing by an IRE1-binding small molecule. Proc Natl Acad Sci USA. 2012;109:E869–E878. doi: 10.1073/pnas.1115623109. [DOI] [PMC free article] [PubMed] [Google Scholar]
- 25.Urano F, et al. Coupling of stress in the ER to activation of JNK protein kinases by transmembrane protein kinase IRE1. Science. 2000;287:664–666. doi: 10.1126/science.287.5453.664. [DOI] [PubMed] [Google Scholar]
- 26.Vijayachandra K, Higgins W, Lee J, Glick A. Induction of p16ink4a and p19ARF by TGFbeta1 contributes to growth arrest and senescence response in mouse keratinocytes. Mol Carcinog. 2009;48:181–186. doi: 10.1002/mc.20472. [DOI] [PubMed] [Google Scholar]
- 27.Wang W, et al. Sequential activation of the MEK-extracellular signal-regulated kinase and MKK3/6-p38 mitogen-activated protein kinase pathways mediates oncogenic ras-induced premature senescence. Mol Cell Biol. 2002;22:3389–3403. doi: 10.1128/MCB.22.10.3389-3403.2002. [DOI] [PMC free article] [PubMed] [Google Scholar]
- 28.Deng Q, Liao R, Wu BL, Sun P. High intensity ras signaling induces premature senescence by activating p38 pathway in primary human fibroblasts. J Biol Chem. 2004;279:1050–1059. doi: 10.1074/jbc.M308644200. [DOI] [PubMed] [Google Scholar]
- 29.Lin AW, et al. Premature senescence involving p53 and p16 is activated in response to constitutive MEK/MAPK mitogenic signaling. Genes Dev. 1998;12:3008–3019. doi: 10.1101/gad.12.19.3008. [DOI] [PMC free article] [PubMed] [Google Scholar]
- 30.So JS, et al. Silencing of lipid metabolism genes through IRE1α-mediated mRNA decay lowers plasma lipids in mice. Cell Metab. 2012;16:487–499. doi: 10.1016/j.cmet.2012.09.004. [DOI] [PMC free article] [PubMed] [Google Scholar]
- 31.Hur KY, et al. IRE1α activation protects mice against acetaminophen-induced hepatotoxicity. J Exp Med. 2012;209:307–318. doi: 10.1084/jem.20111298. [DOI] [PMC free article] [PubMed] [Google Scholar]
- 32.Cho JA, et al. The unfolded protein response element IRE1α senses bacterial proteins invading the ER to activate RIG-I and innate immune signaling. Cell Host Microbe. 2013;13:558–569. doi: 10.1016/j.chom.2013.03.011. [DOI] [PMC free article] [PubMed] [Google Scholar] [Retracted]
- 33.Lipson KL, et al. Regulation of insulin biosynthesis in pancreatic beta cells by an endoplasmic reticulum-resident protein kinase IRE1. Cell Metab. 2006;4:245–254. doi: 10.1016/j.cmet.2006.07.007. [DOI] [PubMed] [Google Scholar]
- 34.Ling F, Kang B, Sun XH. Id proteins: Small molecules, mighty regulators. Curr Top Dev Biol. 2014;110:189–216. doi: 10.1016/B978-0-12-405943-6.00005-1. [DOI] [PubMed] [Google Scholar]
- 35.Alani RM, Young AZ, Shifflett CB. Id1 regulation of cellular senescence through transcriptional repression of p16/Ink4a. Proc Natl Acad Sci USA. 2001;98:7812–7816. doi: 10.1073/pnas.141235398. [DOI] [PMC free article] [PubMed] [Google Scholar]
- 36.Swarbrick A, Roy E, Allen T, Bishop JM. Id1 cooperates with oncogenic Ras to induce metastatic mammary carcinoma by subversion of the cellular senescence response. Proc Natl Acad Sci USA. 2008;105:5402–5407. doi: 10.1073/pnas.0801505105. [DOI] [PMC free article] [PubMed] [Google Scholar]
- 37.Wazir U, Jiang WG, Sharma AK, Newbold RF, Mokbel K. The mRNA expression of inhibitors of DNA binding-1 and -2 is associated with advanced tumour stage and adverse clinical outcome in human breast cancer. Anticancer Res. 2013;33:2179–2183. [PubMed] [Google Scholar]
- 38.Diehn M, Bhattacharya R, Botstein D, Brown PO. Genome-scale identification of membrane-associated human mRNAs. PLoS Genet. 2006;2:e11. doi: 10.1371/journal.pgen.0020011. [DOI] [PMC free article] [PubMed] [Google Scholar]
- 39.Jagannathan S, Nwosu C, Nicchitta CV. Analyzing mRNA localization to the endoplasmic reticulum via cell fractionation. Methods Mol Biol. 2011;714:301–321. doi: 10.1007/978-1-61779-005-8_19. [DOI] [PMC free article] [PubMed] [Google Scholar]
- 40.Zuker M. Mfold web server for nucleic acid folding and hybridization prediction. Nucleic Acids Res. 2003;31:3406–3415. doi: 10.1093/nar/gkg595. [DOI] [PMC free article] [PubMed] [Google Scholar]
- 41.Lowry DT, Li L, Hennings H. Thapsigargin, a weak skin tumor promoter, alters the growth and differentiation of mouse keratinocytes in culture. Carcinogenesis. 1996;17:699–706. doi: 10.1093/carcin/17.4.699. [DOI] [PubMed] [Google Scholar]
- 42.Prischi F, Nowak PR, Carrara M, Ali MM. Phosphoregulation of Ire1 RNase splicing activity. Nat Commun. 2014;5:3554. doi: 10.1038/ncomms4554. [DOI] [PMC free article] [PubMed] [Google Scholar]
- 43.Lerner AG, et al. IRE1α induces thioredoxin-interacting protein to activate the NLRP3 inflammasome and promote programmed cell death under irremediable ER stress. Cell Metab. 2012;16:250–264. doi: 10.1016/j.cmet.2012.07.007. [DOI] [PMC free article] [PubMed] [Google Scholar]
- 44.Upton JP, et al. IRE1α cleaves select microRNAs during ER stress to derepress translation of proapoptotic Caspase-2. Science. 2012;338:818–822. doi: 10.1126/science.1226191. [DOI] [PMC free article] [PubMed] [Google Scholar]
- 45.Polsky D, Young AZ, Busam KJ, Alani RM. The transcriptional repressor of p16/Ink4a, Id1, is up-regulated in early melanomas. Cancer Res. 2001;61:6008–6011. [PubMed] [Google Scholar]
- 46.Ghosh R, et al. Allosteric inhibition of the IRE1α RNase preserves cell viability and function during endoplasmic reticulum stress. Cell. 2014;158:534–548. doi: 10.1016/j.cell.2014.07.002. [DOI] [PMC free article] [PubMed] [Google Scholar]
- 47.Diamond I, Owolabi T, Marco M, Lam C, Glick A. Conditional gene expression in the epidermis of transgenic mice using the tetracycline-regulated transactivators tTA and rTA linked to the keratin 5 promoter. J Invest Dermatol. 2000;115:788–794. doi: 10.1046/j.1523-1747.2000.00144.x. [DOI] [PubMed] [Google Scholar]
- 48.Chin L, et al. Essential role for oncogenic Ras in tumour maintenance. Nature. 1999;400:468–472. doi: 10.1038/22788. [DOI] [PubMed] [Google Scholar]
- 49.Iwawaki T, Akai R, Yamanaka S, Kohno K. Function of IRE1 alpha in the placenta is essential for placental development and embryonic viability. Proc Natl Acad Sci USA. 2009;106:16657–16662. doi: 10.1073/pnas.0903775106. [DOI] [PMC free article] [PubMed] [Google Scholar]
- 50.Kaser A, et al. XBP1 links ER stress to intestinal inflammation and confers genetic risk for human inflammatory bowel disease. Cell. 2008;134:743–756. doi: 10.1016/j.cell.2008.07.021. [DOI] [PMC free article] [PubMed] [Google Scholar]
- 51.Mohammed J, et al. TGFbeta1-induced inflammation in premalignant epidermal squamous lesions requires IL-17. J Invest Dermatol. 2010;130:2295–2303. doi: 10.1038/jid.2010.92. [DOI] [PubMed] [Google Scholar]
- 52.Reiner A, Yekutieli D, Benjamini Y. Identifying differentially expressed genes using false discovery rate controlling procedures. Bioinformatics. 2003;19:368–375. doi: 10.1093/bioinformatics/btf877. [DOI] [PubMed] [Google Scholar]
- 53.Eisen MB, Spellman PT, Brown PO, Botstein D. Cluster analysis and display of genome-wide expression patterns. Proc Natl Acad Sci USA. 1998;95:14863–14868. doi: 10.1073/pnas.95.25.14863. [DOI] [PMC free article] [PubMed] [Google Scholar]
- 54.Huang W, Sherman BT, Lempicki RA. Systematic and integrative analysis of large gene lists using DAVID bioinformatics resources. Nat Protoc. 2009;4:44–57. doi: 10.1038/nprot.2008.211. [DOI] [PubMed] [Google Scholar]


