Significance
Ewing sarcoma is a pediatric bone malignancy driven by the fusion protein EWS/FLI. EWS/FLI mediates oncogenesis through its role as an aberrant transcription factor, but little is known about molecular mechanisms underlying this function. We demonstrate in Ewing sarcoma cells that EWS/FLI activates gene targets through binding at associated GGAA-microsatellites, and these repetitive sequences are necessary for Ewing sarcoma cell proliferation and anchorage-independent growth. Furthermore, we show a previously unknown role for the EWS portion of the fusion protein as critical in binding at EWS/FLI targets. Understanding the mechanism of EWS/FLI transcriptional regulation is imperative to expose novel, targetable biology to inhibit its function. Additionally, these insights provide a useful model for understanding the molecular complexities of other pediatric cancers.
Keywords: microsatellites, Ewing sarcoma, EWS/FLI fusion, transcriptional activation
Abstract
Ewing sarcoma usually expresses the EWS/FLI fusion transcription factor oncoprotein. EWS/FLI regulates myriad genes required for Ewing sarcoma development. EWS/FLI binds GGAA-microsatellite sequences in vivo and in vitro. These sequences provide EWS/FLI-mediated activation to reporter constructs, suggesting that they function as EWS/FLI-response elements. We now demonstrate the critical role of an EWS/FLI-bound GGAA-microsatellite in regulation of the NR0B1 gene as well as for Ewing sarcoma proliferation and anchorage-independent growth. Clinically, genomic GGAA-microsatellites are highly variable and polymorphic. Current data suggest that there is an optimal “sweet-spot” GGAA-microsatellite length (of 18–26 GGAA repeats) that confers maximal EWS/FLI-responsiveness to target genes, but the mechanistic basis for this remains unknown. Our biochemical studies, using recombinant Δ22 (a version of EWS/FLI containing only the FLI portion), demonstrate a stoichiometry of one Δ22-monomer binding to every two consecutive GGAA-repeats on shorter microsatellite sequences. Surprisingly, the affinity for Δ22 binding to GGAA-microsatellites significantly decreased, and ultimately became unmeasureable, when the size of the microsatellite was increased to the sweet-spot length. In contrast, a fully functional EWS/FLI mutant (Mut9, which retains approximately half of the EWS portion of the fusion) showed low affinity for smaller GGAA-microsatellites but instead significantly increased its affinity at sweet-spot microsatellite lengths. Single-gene ChIP and genome-wide ChIP-sequencing (ChIP-seq) and RNA-seq studies extended these findings to the in vivo setting. Together, these data demonstrate the critical requirement of GGAA-microsatellites as EWS/FLI activating response elements in vivo and reveal an unexpected role for the EWS portion of the EWS/FLI fusion in binding to sweet-spot GGAA-microsatellites.
Ewing sarcoma is an aggressive bone malignancy of children, adolescents, and young adults (1). Disease pathogenesis is mediated by a t(11, 22)(q24;q12) chromosomal translocation that creates the EWS/FLI fusion oncoprotein. This fusion protein functions as a transcription factor and master regulator of oncogenic transformation by activating and repressing thousands of target genes (2, 3). The amino-terminal EWS portion is a low-complexity/intrinsically disordered domain that is indispensable for both transcriptional regulation and oncogenic transformation but is not thought to contribute to DNA binding (4, 5). The carboxyl-terminal FLI portion contains the conserved ETS-type DNA-binding domain and binds with high affinity to the ETS consensus sequence ACCGGAAGTG (6, 7). The DNA binding domain is likewise necessary for EWS/FLI-induced oncogenesis. FLI and EWS/FLI each bind this high-affinity motif as a monomer with similar affinity and specificity (8).
We, and others, previously demonstrated the enrichment of GGAA-microsatellites near EWS/FLI-regulated target genes (9, 10). Our early studies found GGAA-microsatellites associated with genes transcriptionally activated, but not repressed, by EWS/FLI (9). Many of these GGAA-microsatellites are bound by EWS/FLI in vivo, and there is a correlation between EWS/FLI binding and EWS/FLI-mediated gene activation. Furthermore, introduction of GGAA-microsatellite sequences confer EWS/FLI-responsiveness to reporter constructs (11). These data suggest GGAA-microsatellites serve as EWS/FLI-response elements in vivo, but this has not been definitively shown.
The human genome contains thousands of GGAA-microsatellites. These display a great deal of sequence variability arising from base transitions and transversions, indels, and variation in number of GGAA-repeats. GGAA-microsatellites studied in detail demonstrate a high degree of polymorphism in populations (12). For example, NR0B1 is a critical EWS/FLI-regulated target gene required for oncogenesis in Ewing sarcoma (13). NR0B1 contains a GGAA-microsatellite ≈1,500 bp upstream of the transcriptional start site that shows significant length polymorphism across populations and between individuals (12). Perhaps most interestingly, Ewing tumors demonstrate marked enrichment of a narrow range of GGAA-microsatellite lengths in the NR0B1-associated microsatellite, with most containing 18–26 GGAA-repeats, suggesting a relationship between NR0B1 microsatellite length and tumor development (11).
Our original biochemical studies focused on short microsatellite constructs containing 0–7 GGAA-repeats, and we found there was increasing EWS/FLI-mediated reporter gene activation as the number of GGAA-motifs increased (9). However, subsequent work found this effect was maximal between 18–26 GGAA-repeats, and longer microsatellite lengths showed diminished EWS/FLI-responsiveness (11). This led us to propose there is an optimal sweet-spot length of GGAA-microsatellite that provides maximal levels of EWS/FLI-mediated gene activation. The molecular basis for this sweet-spot maximal activity is not currently known.
To discover the mechanistic basis underlying optimal sweet-spot GGAA-microsatellite function, we combined in vivo studies of gene expression and oncogenic phenotype with in vitro biochemical evaluation of DNA-binding by EWS/FLI mutant alleles. We show EWS/FLI transcriptionally activates NR0B1 through its associated GGAA-microsatellite. Additionally, this particular microsatellite is required for EWS/FLI-mediated Ewing sarcoma oncogenic transformation, as measured by anchorage-independent colony formation. We also found smaller GGAA-microsatellites are only able to bind in vitro to versions of EWS/FLI that have near-complete deletions of the EWS portion of the fusion; in contrast, optimal sweet-spot microsatellites bind with higher affinity to versions of EWS/FLI that retain the EWS portion. Taken together, these data demonstrate an important role of the transcriptional regulatory EWS-domain of EWS/FLI in contributing to binding of sweet-spot GGAA-microsatellites and thus provide a biochemical basis for the enrichment of these microsatellite lengths in Ewing sarcoma.
Results
The NR0B1 GGAA-Microsatellite Is Required for EWS/FLI-Mediated Transcriptional Activation, Ewing Sarcoma Proliferation, and Oncogenic Transformation.
NR0B1 encodes an orphan nuclear receptor whose expression is necessary for oncogenic transformation of Ewing sarcoma cells (13). There is a highly polymorphic GGAA-microsatellite at ≈1,500 bp 5′ to the NR0B1 transcriptional start site, which is bound by EWS/FLI in Ewing cells (9). Knockdown of EWS/FLI expression causes a concomitant reduction in NR0B1 RNA and protein expression, suggesting NR0B1 is regulated by direct binding of EWS/FLI to its microsatellite (13).
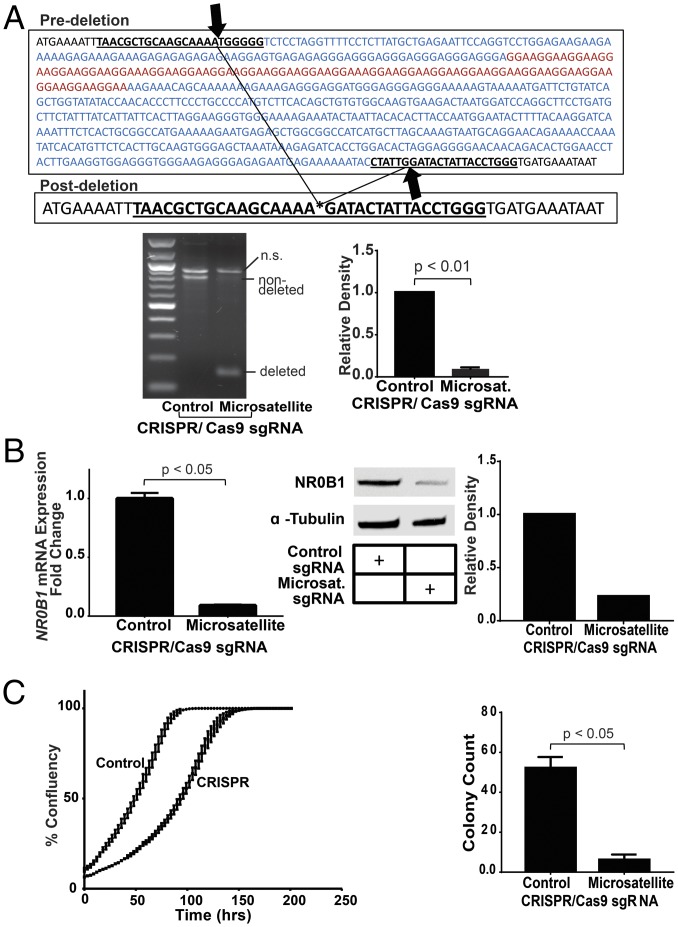
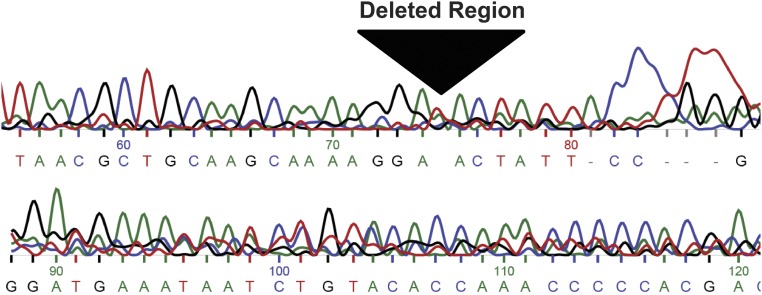
To explicitly test whether the GGAA-microsatellite is necessary for EWS/FLI-mediated activation of NR0B1, we used CRISPR/Cas9 to delete the region containing the NR0B1 microsatellite in A673 Ewing cells. Genomic PCR and Sanger sequencing of isolated polyclonal cell populations demonstrated successful deletion of the GGAA-microsatellite in ≈80% of the polyclonal population (Fig. 1A and Fig. S1).
Fig. 1.
Deletion of the NR0B1 microsatellite reduces NR0B1 expression, impairs A673 cell growth, and inhibits colony formation. (A) Sequencing results validating knockout of the NR0B1 GGAA-microsatellite about 1.5 kb upstream of the NR0B1 TSS in A673 cells. The sgRNAs targeted to either side of this region are underlined. GGAA-microsatellite is highlighted red, and CRISPR/Cas9 deleted region is highlighted blue. Gel shows deletion of NR0B1 microsatellite region compared with control (nondeleted), with densitometry quantification on Right (P < 0.01). Data are represented as mean ± SEM (n = 2). (B) NR0B1 mRNA (P < 0.05) and protein expression levels in control and CRISPR/Cas9-mediated knockout of NR0B1 microsatellite in A673 Ewing sarcoma cells, with Western blot densitometry quantification on Right. Control CRISPR/Cas9 plasmids do not contain sgRNAs. Data are represented as mean ± SEM (n = 3). (C) Growth and colony formation assay quantification of CRISPR/Cas9 control vs. NR0B1 microsatellite knockout in A673 cells (P < 0.05). Data are represented as mean ± SEM (n = 3).
Fig. S1.
Sequencing results of the NR0B1 microsatellite deletion. Shown is the Sanger sequencing chromatogram of genomic DNA demonstrating deletion of the NR0B1 GGAA-microsatellite region in A673 cells.
To determine the effects of microsatellite loss on NR0B1 expression, we next evaluated mRNA and protein levels. Deletion of the microsatellite reduces NR0B1 expression at both the RNA and protein level by 80% or more compared with control cells (Fig. 1B). Remaining NR0B1 expression is likely due to residual cells in the polyclonal population that did not undergo microsatellite excision, but we cannot exclude persistent low-level gene expression after microsatellite deletion. These data indicate the GGAA-microsatellite is required for full-level NR0B1 expression in Ewing sarcoma cells.
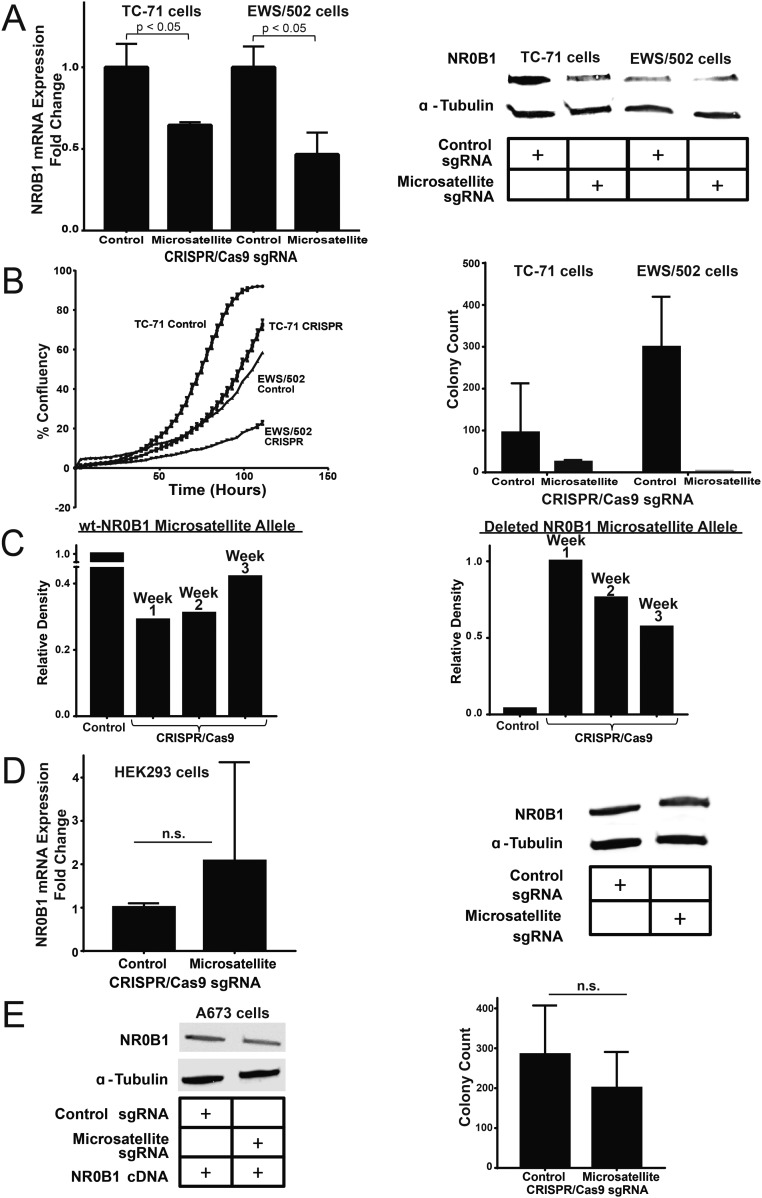
We next evaluated the role of the NR0B1 microsatellite on Ewing sarcoma cell behavior. Growth curves and anchorage-independent growth were determined for control and microsatellite-deleted cells, using live cell imaging and soft-agar assays, respectively. We found cells harboring deletion of the NR0B1 microsatellite exhibited an impaired proliferation rate and near-complete loss of colony formation (Fig. 1C). Similar results were observed using TC71 and EWS502 Ewing sarcoma cells (Fig. S2 A and B). The effect was more subtle in these latter cells likely because of less complete microsatellite deletion coupled with a propensity for nondeleted cells to outgrow CRISPR knockout cells over time (Fig. S2C). In contrast to these Ewing sarcoma cells, deletion of the GGAA-microsatellite–containing region in non-Ewing HEK293 cells did not cause a decrease in NR0B1 mRNA or protein levels; instead, there was a non-statistically significant minor increase in mRNA levels following microsatellite excision (Fig. S2D).
Fig. S2.
Deletion of the NR0B1 microsatellite in other cell lines. (A) NR0B1 mRNA and protein expression levels in control and CRISPR/Cas9-mediated knockout of the NR0B1 microsatellite in TC-71 and EWS/502 Ewing sarcoma cells (P < 0.05). Data are represented as mean ± SEM (n = 3). (B) Growth curves and soft agar assay quantification for NR0B1 microsatellite deletion in two other Ewing sarcoma cell lines (TC-71 cells and EWS/502 cells). Growth curve data are represented as mean ± SEM (n = 4). Control vs. CRISPR for TC-71 and EWS/502 cells are each statistically significant (P < 0.05). Soft agar data are represented as mean ± SEM (n = 2). (C) Densitometry quantification of PCR-amplified NR0B1-microsatellite–containing region for A673 control (wild-type NR0B1-microsatellite) allele vs. CRISPR-Cas9 knockout (deleted NR0B1-microsatellite) allele at different time points for up to 3 wk postlentiviral infection. (D) NR0B1 mRNA and protein expression levels in control and CRISPR/Cas9-mediated knockout of the NR0B1 microsatellite in non-Ewing sarcoma HEK293 cells. Data are represented as mean ± SEM (n = 3). n.s., not statistically significant. (E) NR0B1 protein levels and colony formation assay quantification for A673 cells with NR0B1 cDNA rescue in CRISPR/Cas9 control vs. microsatellite knockout. n.s., not statistically significant. Data are represented as mean ± SEM (n = 2).
To determine if loss of oncogenic transformation of A673 cells following GGAA-microsatellite excision was due to loss of NR0B1 protein expression, we performed “rescue” experiments. We introduced an NR0B1 cDNA into A673 cells by retroviral infection and drug selection and followed this by deletion of the GGAA-microsatellite using the lentiviral system described above. Enforced NR0B1 expression rescued both NR0B1 protein levels and colony formation in soft agar (Fig. S2E), suggesting loss of transformation resulted from loss of NR0B1 protein expression and not from an off-target or other nonspecific effect. Collectively, these data indicate the GGAA-microsatellite is required for full-level expression of the NR0B1 gene, tissue-culture proliferation, and anchorage-independent growth of Ewing sarcoma cells.
The FLI Domain of EWS/FLI Interacts with Short GGAA-Microsatellites as Monomers via Independent Binding Events.
Our prior studies evaluating interactions between EWS/FLI and short GGAA-microsatellite sequences containing 0–7 consecutive GGAA-repeats suggested that FLI exhibits homodimeric binding on elements containing four or more GGAA-repeats with a dissociation constant (KD) of ∼70 nM (14). These data were based on a combination of electrophoretic mobility shift assays and fluorescence anisotropy studies using two recombinant mutants of EWS/FLI: the isolated 101 amino acid FLI ETS domain, and the ∆22 mutant, containing all of the FLI portion of EWS/FLI and six amino acids from the EWS portion (9, 14). These studies did not evaluate larger microsatellite sequences and thus were unable to address the stoichiometry and potential for cooperative binding on longer GGAA-microsatellites.
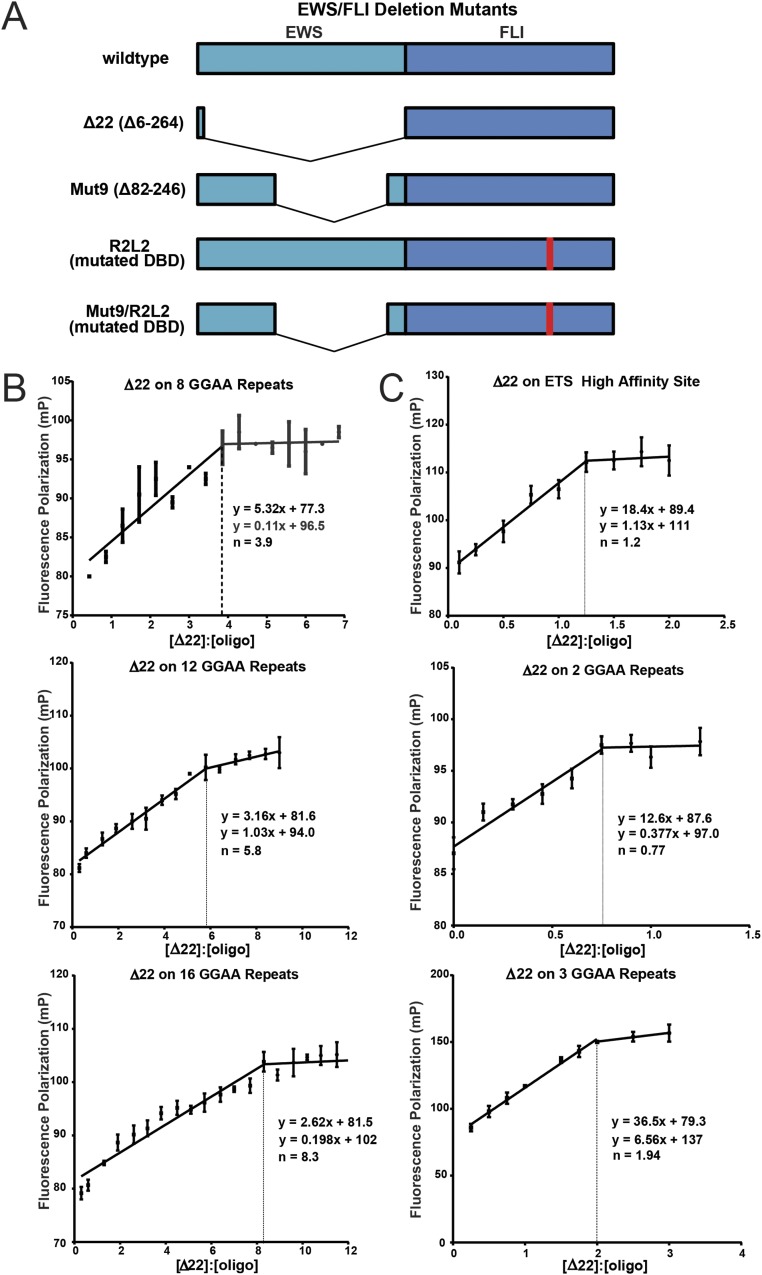
To determine the stoichiometry of EWS/FLI binding on GGAA-microsatellites of more relevant lengths (i.e., longer microsatellites), we conducted fluorescence anisotropy studies using the same Δ22 construct (Fig. S3A) used in our earlier studies (3). Using fluorescein-labeled DNA duplexes containing increasing numbers of consecutive GGAA-motifs, ranging from 2 to 16 repeats, we found a highly consistent stoichiometric ratio of one Δ22 monomer binding for every two GGAA repeats (R2 = 0.9881; Fig. 2A and Fig. S3B). Additional evaluation revealed one Δ22 monomer binds two GGAA-repeats, and two monomers binds three repeats, the only ratio inconsistent with the established 1:2 pattern (Fig. 2A and Fig. S3C). These data differ slightly from our previous studies, which suggested Δ22 is unable to bind three or fewer GGAA-repeats (9). The reason for this discrepancy is unknown but may be related to differing sensitivities of EMSA (used in prior studies) and fluorescence anisotropy (used in this study). Overall, the stoichiometry experiments suggest a “head-to-tail” binding model whereby single molecules of Δ22 can “anchor” to Δ22 molecules already bound on the microsatellite and extend a “chain” of bound Δ22 one molecule at a time.
Fig. S3.
Stoichiometry of Δ22 binding on DNA sequences of increasing GGAA-microsatellite numbers. (A) Schematic of EWS/FLI constructs used in these studies. (B) Fluorescent anisotropy results of recombinant Δ22 protein binding to fluorescein-labeled DNA probes containing 8, 12, and 16 consecutive GGAA-repeats. The inflection points represent stoichiometric ratios and are indicated by dashed lines (exact values indicated on graphs as n = 3.9 for eight repeats, n = 5.8 for 12 repeats, etc.). Data are represented as mean ± SEM (n = 3). (C) Stoichiometry of recombinant Δ22 protein binding at the conserved ETS high-affinity sequence (one GGAA), two, and three consecutive GGAA-repeats to characterize minimal binding of Δ22. Dashed lines and n values on graphs represent inflection points or stoichiometric ratios. Data are represented as mean ± SEM (n = 3).
Fig. 2.
Characterization of Δ22 binding on DNA sequences of increasing GGAA-microsatellite numbers. (A) Fluorescence polarization (FP) was used to determine the stoichiometry of recombinant Δ22 protein binding fluorescein-labeled DNA probes from 2 to 16 consecutive GGAA-repeats. Data represent mean of two independent experiments (each with three technical replicates) for each GGAA-repeat length. R2 = 0.9881. (B) FP was used to assay binding affinity of recombinant Δ22 protein bound to fluorescein-labeled oligonucleotide probes of 4–16 consecutive GGAA-motifs. KD was determined to be ∼70 nM. Data represent mean ± SEM (n = 3). (C) Summary of KD (binding affinity) determined by fluorescence anisotropy for recombinant Δ22 vs. Mut9 proteins binding to fluorescein-labeled DNA oligonucleotides of increasing GGAA-microsatellite numbers. Data represent the mean of two independent experiments for each GGAA-repeat length. R2 = 0.9425 and 0.8795 for Δ22 and Mut9, respectively.
The head-to-tail model suggests that increasing numbers of GGAA-repeats would manifest as higher affinity (i.e., lower KD) for Δ22 binding to longer compared with shorter GGAA-microsatellites, because greater numbers of bound Δ22 would stabilize the bound chain. We therefore used fluorescence anisotropy to determine the KD of Δ22 binding to GGAA-microsatellites of increasing numbers of GGAA-motifs. Instead of decreasing KD values for increasing numbers of GGAA-motifs, we found that Δ22 binds each of the sequences with a nearly identical binding affinity (57.5–68.2 nM; Fig. 2B). This suggests the head-to-tail model is not correct, but instead Δ22 binds each pair of GGAA-repeats via independent binding events.
EWS Sequences Are Required for EWS/FLI Binding to Sweet-Spot GGAA-Microsatellite Lengths in Vitro.
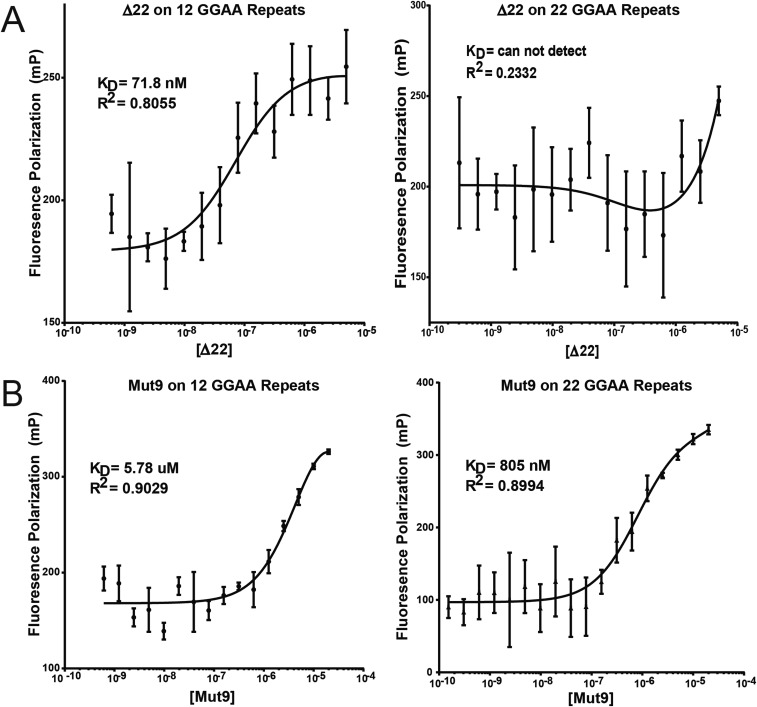
The analysis we performed above included GGAA-microsatellite sequences ranging from 2 to 16 consecutive GGAA-repeats. We next considered the possibility that sweet-spot microsatellite lengths might be optimal for gene expression because of improvements in affinity of the FLI DNA-binding domain for these longer repeat lengths. To test this possibility, we again used fluorescence anisotropy to evaluate binding of Δ22 to GGAA-microsatellites containing 18–22 consecutive GGAA-repeats. Unexpectedly, we found the affinity of Δ22 progressively worsened as the microsatellite length increased and was unmeasureable at the longest microsatellite tested (22 repeats; Fig. S4A). It is known Δ22 is unable to rescue oncogenic transformation of Ewing sarcoma cells in which endogenous EWS/FLI has been knocked down (5). This has been assumed to be due to the absence of a transcriptional regulatory domain contributed by the EWS portion of the fusion. The current data suggest an additional possibility: that Δ22 also fails to bind GGAA-microsatellites in vivo.
Fig. S4.
Mut9 vs. Δ22 binding at increasing GGAA-microsatellite lengths. Fluorescence anisotropy binding of recombinant (A) Δ22 or (B) Mut9 proteins on fluorescein-labeled DNA oligonucleotides containing 12 vs. 22 (sweet-spot) consecutive GGAA-repeats. Data are represented as mean ± SEM (n = 3).
It is clear full-length EWS/FLI binds sweet-spot GGAA-microsatellites in vivo and rescues oncogenic transformation of Ewing sarcoma cells (4, 14). We therefore sought to determine whether the inclusion of EWS sequence would change the binding characteristics of the fusion in vitro. Full-length EWS/FLI is challenging to purify as a recombinant protein in a fully functional form as the low-complexity/intrinsically disordered EWS portion tends to cause aggregation of the protein in vitro (15). To circumvent this challenge, we instead purified a mutant form (Mut9) containing an internal deletion of 164 amino acids that comprise much of the intrinsically disordered domains of the EWS portion of the EWS/FLI fusion. Mut9 fully rescues oncogenic transformation in Ewing sarcoma and regulates the limited number of genes tested in a manner nearly identical to full-length EWS/FLI (see below for Mut9 global transcriptional analysis) (4). This construct is, however, readily purified as a recombinant protein, and we therefore used it in place of full-length EWS/FLI.
We analyzed recombinant Mut9 binding to a series of GGAA-microsatellite sequences using fluorescence anisotropy. In the case of suboptimal/shorter GGAA-repeat sequences, we found Mut9 binds with poor affinity (KD in the 3–6 μM range for 8–12 GGAA-repeats; Fig. 2C). Interestingly, the KD significantly improves as the number of GGAA-motifs is increased into sweet-spot lengths: At 22 GGAA-repeats, the KD decreased to 805 nM (Fig. S4B). These data demonstrate a significant change in binding capacity to GGAA-microsatellites that is dependent on the EWS portion of the EWS/FLI fusion: Δ22 binds well to short but not sweet-spot microsatellites, while Mut9 binds to sweet-spot, but not shorter, microsatellites (Fig. 2C). Taken together, these data demonstrate the transcriptional regulatory EWS domain plays an unanticipated but critical role in binding of the EWS/FLI fusion to sweet-spot GGAA-microsatellite regulatory elements.
EWS Sequences Are Required for EWS/FLI Binding to Sweet-Spot GGAA-Microsatellite Lengths in Vivo.
The work we presented on GGAA-microsatellite binding thus far used recombinant proteins and DNA duplexes in an in vitro setting. These in vitro studies are limited by their inability to account for the more complicated intracellular milieu and additional protein–protein interactions present in living Ewing sarcoma cells. To address this issue, we next performed in vivo experiments to test our model.
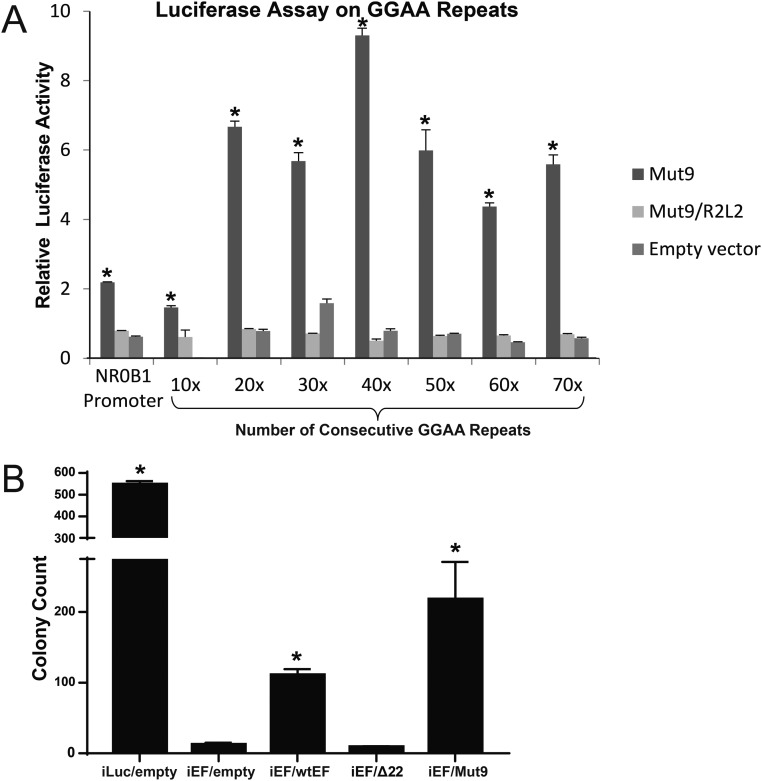
We previously demonstrated EWS/FLI activation of luciferase reporters containing GGAA-microsatellites reveals a sweet spot of ≈20–30 GGAA-repeats. To test whether Mut9 demonstrates a similar sweet-spot preference, we performed luciferase reporter assays using GGAA-repeat lengths from 10 to 70 repeats (Fig. S5A). We found peak Mut9 responsiveness at 40 repeats and evidence of a second peak in the 70-repeat range (generally similar to what was previously observed with full-length EWS/FLI). These data indicate Mut9 functions in an analogous manner to wild-type EWS/FLI in this reporter system. In contrast, a Mut9/R2L2 mutant, which contains a two-amino acid substitution in the DNA-binding domain of the FLI portion (Fig. S3A) and cannot bind DNA (3), does not induce transcriptional activation, regardless of GGAA-repeat length (Fig. S5A). Thus, our data suggest a requirement for both the EWS and FLI portions of the fusion for DNA binding and transcriptional activation.
Fig. S5.
Mut9 transcriptional activation of increasing consecutive GGAA-repeats. (A) Luciferase assay results showing transcriptional activity of Mut9 and Mut9/R2L2 vs. empty vector at microsatellites of increasing GGAA-repeat numbers. Mut9-induced activity is significantly greater than Mut9/R2L2 and the empty vector control (P < 0.01) and are denoted by asterisks. Data are represented as mean ± SEM (n = 3). (B) Quantification of colony formation assays for EWS/FLI knockdown and rescue cells used in RNA-seq experiments. Data represent mean ± SD (n = 2). Paired two-tailed t tests were performed between constructs that rescue anchorage-independent growth (Luc-RNAi, EWS/FLI, and Mut9) and those that do not (iEF-2–RNAi, Δ22, and R2L2). Asterisks denote statistical significance (P < 0.05).
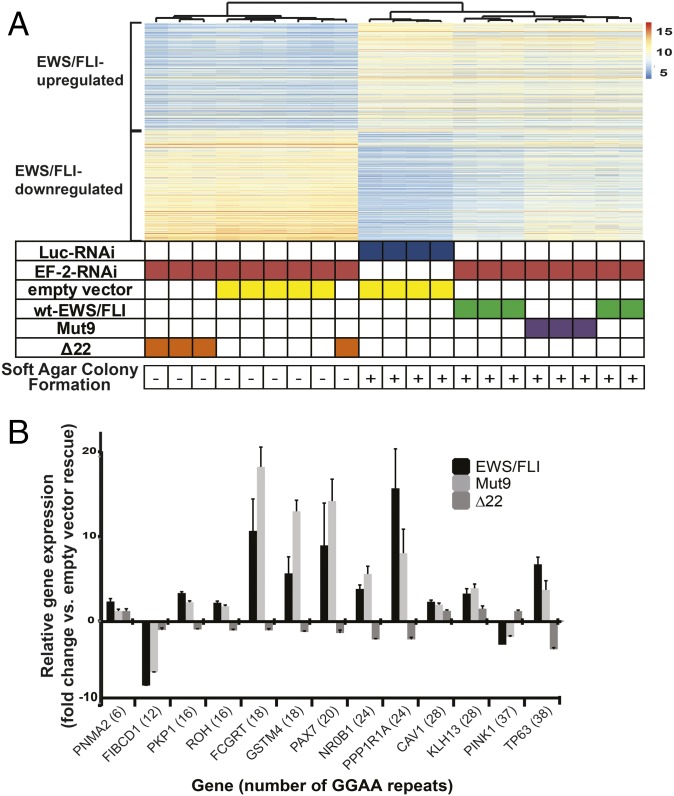
We next extended these findings to endogenous genes in patient-derived A673 Ewing sarcoma cells. We “knocked down” EWS/FLI with a retrovirally expressed shRNA (EF-2–RNAi) or used a control RNAi-targeting luciferase (Luc-RNAi) and “rescued” expression with RNAi-resistant cDNAs expressing either wild-type EWS/FLI, Mut9 or Δ22, or an empty-vector control. As previously reported (3), both wild-type EWS/FLI and the Mut9 mutant rescue oncogenic transformation, while the Δ22 and empty-vector controls did not (Fig. S5B). RNA-seq was next performed on these polyclonal populations of cells. Unsupervised hierarchical clustering revealed that Mut9-rescued cells clustered (and intermixed) with the wild-type EWS/FLI-rescued cells (Fig. 3A). These had gene expression patterns that were highly similar to cells treated with the Luc-RNAi control. In contrast, the Δ22-rescued cells clustered (and intermingled) with empty-vector rescue cells (Fig. 3A). These data indicate Mut9 shares a nearly identical gene expression pattern with wild-type EWS/FLI and therefore validates its use as an “EWS/FLI-equivalent” version.
Fig. 3.
EWS/FLI-mediated differential gene expression in Mut9 vs. Δ22 rescue of EWS/FLI knockdown in A673 cells at different microsatellite lengths. (A) Heat map of hierarchical clustering of the 500 most EWS/FLI up- and down-regulated genes across cells expressing varying knockdown/rescue constructs. Each row represents one gene, and each column represents one biological sample. Values used to determine differential expression were normalized count matrices (scale represents normalized counts). (B) Results comparing differential gene expression from RNA-seq data (A) of EWS/FLI-regulated genes in the context of rescue with wild-type, Mut9, and Δ22 constructs. The number of GGAA-motifs (according to UCSC hg19 reference genome) contained in their respective gene-associated microsatellites is indicated. Data represent mean ± SD (n = 3).
To determine whether GGAA-microsatellite repeat number affects EWS/FLI- and Mut9-mediated gene activation, we next selected a handful of EWS/FLI-regulated genes containing nearby microsatellites of varying lengths (range: 6–38 GGAA-repeats) and plotted their EWS/FLI-induced gene expression from our RNA-seq data. Genes associated with microsatellites containing 18–26 GGAA-repeats had high levels of EWS/FLI- and Mut9-mediated gene activation (Fig. 3B). In contrast, those with fewer or greater numbers of repeats showed diminished EWS/FLI- and Mut9-mediated activation. As anticipated, Δ22 showed little if any gene regulatory activity.
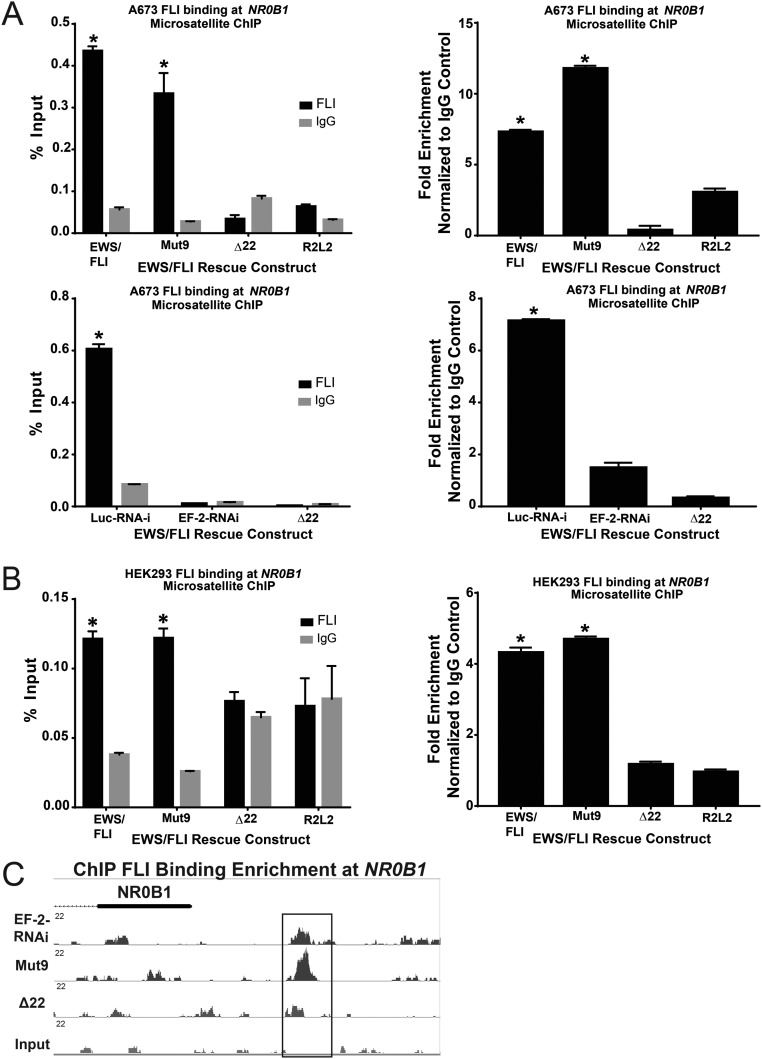
We next asked whether the EWS portion of EWS/FLI is critical for binding sweet-spot GGAA-microsatellites in vivo. We performed directed ChIP–PCR experiments using an anti-FLI antibody. We used the A673 knockdown/rescue approach described above and rescued expression with cDNAs expressing either wild-type EWS/FLI, Mut9, Δ22, or the R2L2 DNA-binding mutant (16). Schematics of the EWS/FLI mutants are shown in Fig. S3A. Following ChIP, we performed qPCR for the NR0B1 microsatellite as an example sweet-spot microsatellite (containing 25 GGAA-repeats). We found wild-type EWS/FLI and Mut9 both demonstrate binding enrichment at this site, whereas Δ22 and R2L2 do not (Fig. S6A). Similarly, when introduced into the non-Ewing sarcoma cell line HEK293, both wild-type EWS/FLI and Mut9 show enrichment at the NR0B1 GGAA-microsatellite, while Δ22 and R2L2 do not (Fig. S6B).
Fig. S6.
Mut9 and Δ22 binding at NR0B1 microsatellite. qPCR shows binding enrichment expressed as percent input and fold-change normalized to IgG mock control at the NR0B1 microsatellite following ChIP using an antibody against FLI vs. IgG in (A) A673 cells with control (Luc-RNAi) or EWS/FLI knockdown (“iEF-2–RNAi”) rescued with the indicated EWS/FLI mutant constructs or empty vector (“EF-2–RNAi”) and (B) non-Ewing sarcoma HEK 293 EBNA cells infected with mutant EWS/FLI constructs. Data are represented as mean ± SEM (n = 3). Asterisks denote statistical significance (P < 0.05) as assessed by paired two-tailed t tests, between EWS/FLI wild-type, Mut9, and Luc-RNAi vs. iEF-2-RNAi, Δ22, and R2L2, respectively. (C) A representative example from ChIP-seq data, showing FLI binding enrichment at the NR0B1 microsatellite in EWS/FLI-depleted cells and A673 cells rescued with empty vector, Mut9, or Δ22.
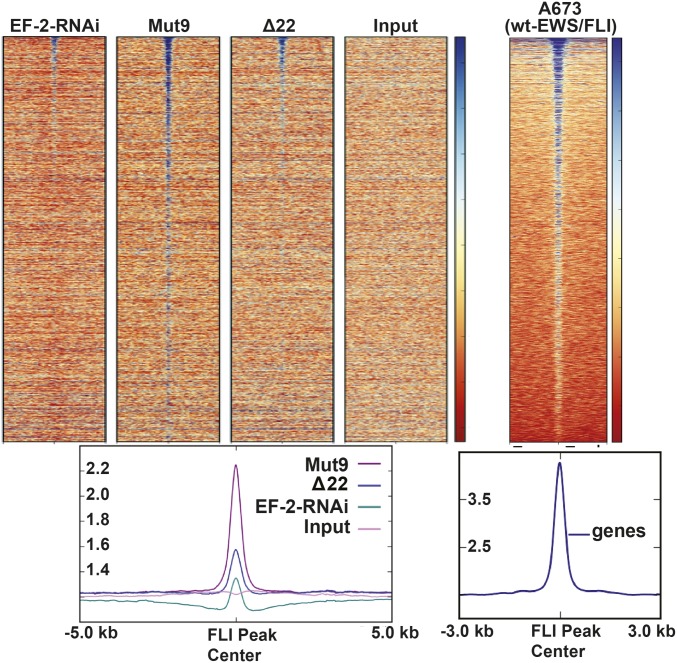
We next compared the genomic localization of Mut9 to Δ22 using the knockdown/rescue strategy in A673 Ewing sarcoma cells. ChIP-seq demonstrated that Mut9 was globally enriched at EWS/FLI binding sites across the human genome, while Δ22 binding was not significantly enriched over control cells expressing an empty-vector rescue construct (Fig. 4 and Fig. S6C). Residual FLI binding present in the empty-vector and Δ22 rescue samples reflects the incomplete knockdown observed with our EWS/FLI shRNA. Overall, these data extend our in vitro findings: The EWS portion of EWS/FLI is required for in vivo DNA binding.
Fig. 4.
Genome-wide FLI ChIP binding of Mut9 vs. Δ22. Shown is a heat map of genome-wide FLI ChIP-seq data from A673 cells with EWS/FLI knockdown vs. Mut9 or Δ22 rescue compared with input and A673 wild-type EWS/FLI cells. See SI Materials and Methods for additional supporting information.
Taken together, these data highlight a previously unrecognized requirement for sequences contributed by the EWS portion of the EWS/FLI fusion in DNA binding and gene activation. Furthermore, these data localize the portion of EWS required for this activity to the portion retained in the Mut9 construct (amino acids 1–82 and 246–264 of the EWS portion of full-length EWS/FLI).
Discussion
EWS/FLI is a modular transcription factor containing an ETS-type DNA binding domain in the FLI portion of the fusion and a transcriptional activation/repression domain in the EWS portion of the fusion (4). We now demonstrate an unanticipated critical modulatory role for the EWS portion in EWS/FLI binding to GGAA-microsatellites: At shorter microsatellite lengths, the EWS portion inhibits binding, and at longer sweet-spot lengths, the EWS portion enables binding. This finding has important implications for our understanding of transcriptional regulation and Ewing sarcoma development.
We and others first identified GGAA-microsatellites as potential EWS/FLI response elements using ChIP-chip, luciferase reporter, and in vitro DNA binding assays (9–11). However, the data implicating GGAA-microsatellites as requisite EWS/FLI response elements was circumstantial at best. In the current report, we demonstrate the region containing the GGAA-microsatellite adjacent to the NR0B1 gene is required for activation of that gene in Ewing sarcoma, and genetic deletion of that region disrupts normal Ewing sarcoma cell growth and colony formation in soft agar. These studies explicitly link EWS/FLI-bound GGAA-microsatellites to cancerous phenotypes in Ewing sarcoma. These data support the notion that alterations in GGAA-microsatellite function (for example, through microsatellite-length polymorphisms) can have significant effects on Ewing sarcoma development. This is important because we have shown significant population differences in GGAA-microsatellite length polymorphisms between African and European populations: Europeans have a significant enrichment in sweet-spot length GGAA-microsatellites at the NR0B1 locus compared with Africans, who have greater numbers of larger microsatellites (>30 GGAA-repeats) (12). These data correlate with the incidence of Ewing sarcoma in these two populations: Europeans have a 10-fold higher incidence of Ewing sarcoma compared with Africans (12). Furthermore, patients who develop Ewing sarcoma have an even higher level of enrichment of sweet-spot microsatellites (11). These data were certainly suggestive of a contribution of the NR0B1 microsatellite polymorphisms in Ewing sarcoma susceptibility, but our current demonstration of the necessity for the adjacent GGAA-microsatellite in NR0B1 gene expression provides an explicit linkage between these findings. These data also support a recent study suggesting a Ewing sarcoma-susceptibility locus creates a sweet-spot microsatellite in the risk allele and this leads to increased expression of the EGR2 gene and Ewing sarcoma development (17).
The in vitro and in vivo studies presented in this report strongly corroborate one another and indicate the EWS portion of the EWS/FLI fusion is critical for binding of EWS/FLI to sweet-spot microsatellites. These data provide a mechanistic rationale for the presence of sweet-spot microsatellites: If GGAA-microsatellites are too short, EWS/FLI is not able to bind well. Thus, EWS/FLI binding and associated gene activation is only possible at microsatellites exhibiting at least sweet-spot numbers of GGAA-repeats. We do not currently have the capability to assess microsatellite lengths longer than sweet-spot lengths in our in vitro studies, but we anticipate that longer microsatellite lengths would be inefficient at binding EWS/FLI.
Interestingly, recent published data indicate EWS/FLI-bound GGAA-microsatellites in Ewing sarcoma are in an open chromatin state, while knockdown of EWS/FLI results in a closed chromatin configuration at these loci (18). Conversely, introduction of EWS/FLI into mesenchymal stem cells converts closed chromatin into an open state (18, 19). These data suggest an important role of EWS/FLI at GGAA-microsatellites is to convert closed chromatin to an open state to enable transcriptional activation. The implication is EWS/FLI might function at these loci as a “pioneer factor,” binding DNA and recruiting chromatin-modifying complexes to induce an open-chromatin configuration (20). An intriguing interpretation of our data is EWS/FLI may induce this chromatin opening at GGAA-microsatellites via a “mechanical” biophysical mechanism: Initial binding of EWS/FLI at sweet-spot microsatellites might facilitate the binding of additional EWS/FLI molecules and essentially open the chromatin through a “coating” mechanism. Our data therefore implicate the EWS portion of the fusion as critical in facilitating DNA accessibility.
Our data do not speak to the detailed mechanism by which the EWS portion of EWS/FLI participates in fusion binding to sweet-spot microsatellites. It is tempting to speculate a polymerization process, mediated by the EWS portion, is involved. FUS, a paralog of EWS, is also involved in chromosomal translocations leading to oncogenic fusion transcription factors. FUS is capable of polymerizing and forming hydrogels under certain conditions (21). When the amino terminus of FUS is joined to the FLI DNA binding domain, addition of GGAA-microsatellite sequences appears to trigger polymerization of the fusion. This is thought to occur at a series of [G/S]Y[G/S] amino acid repeats (21). Similar [G/S]Y[G/S] repeats are present in the amino-terminal portion of EWS that is included in the EWS/FLI fusion protein (21). Future studies will be required to determine if polymerization, via the EWS-portion, is required for binding to sweet-spot GGAA-microsatellites.
In addition to GGAA-microsatellite binding, a significant portion of the EWS/FLI fusion is bound to high-affinity ETS sites (9, 18). One limitation of the current study is we did not evaluate the role of the EWS portion of the fusion on binding to these high-affinity sites. Studies addressing this question may shed additional light on the mechanism of EWS/FLI binding to, and activation of, its target genes.
In summary, we provide strong evidence for a critical role of the NR0B1 GGAA-microsatellite in Ewing sarcoma development and provide mechanistic details for the ability of EWS/FLI to bind to GGAA-microsatellites at sweet-spot lengths. These data indicate the role of the EWS portion of the fusion protein is not simply to interact with transcriptional coregulators to mediate gene expression, but it is also required for binding to GGAA-microsatellites. Furthermore, this work suggests opportunities in targeting of the fusion: Approaches that disrupt the DNA-binding modulatory role of the EWS portion of EWS/FLI may be sought out as new therapeutic approaches for patients with Ewing sarcoma.
Materials and Methods
Constructs and Retroviruses.
Mammalian expression constructs included the following: Lentiviral vectors containing CRISPR/Cas9 cDNA and sgRNA (SI Materials and Methods); retroviral vectors encoding Luc-RNAi and EF-2–RNAi and cDNAs for EWS/FLI, Δ22, R2L2, Mut9, and NR0B1 are previously described (4, 13, 22, 23); the Mut9/R2L2 construct was ordered as a gene block (IDT) and cloned into the pMSCV hygro vector between EcoRI and HindIII restriction sites. Luciferase reporter constructs included human-derived NR0B1 GGAA-microsatellite polymorphic or synthetic GGAA constructs cloned upstream of the pGL3-promoter SV40 minimal promoter element (Promega Corporation), as described previously (9, 11). Bacterial expression constructs included cDNAs for 6xHis-Δ22 and Halo-Tagged-Mut9 in pET28a and pFN18K, respectively (EMD Chemicals, Promega Corporation).
Cell Culture.
HEK 293EBNA and Ewing sarcoma cell lines were grown as previously described (13, 23). Cells were infected with CRISPR/Cas9 lentiviral constructs for NR0B1 microsatellite knockout experiments as previously described (22). A673 cells were used for EWS/FLI knockdown/rescue experiments. Growth assays were performed on the IncucyteZoom live cell imager. Soft agar assays were performed as described previously (23).
CRISPR/Cas9.
Two lentiviruses expressing Cas9 and distinct CRISPR sgRNAs (Table S1 for sequences) and either puromycin and blastocidin resistance markers were used to infect target cells. Vectors were provided by the University of Utah MGD Core (cores.utah.edu/mutation-generation-detection/). A ∼700-bp region containing the NR0B1 GGAA-microsatellite was deleted and was the smallest that could be targeted with high-quality sgRNAs due to the region’s repetitive nature. Control lentiviruses lacked the sgRNA sequences. Genomic DNA from drug-selected polyclonal cell populations was isolated within 10 d of infection, PCR amplified (using primers listed in Table S1), and sequenced to verify NR0B1 microsatellite deletion (Fig. S1). Results were validated by gel electrophoresis (Fig. 1A). RNA and protein were collected within 2–3 wk of CRISPR/Cas9 infection. A673 genomic DNA was collected weekly for 3 wk to assess stability of CRISPR/Cas9-mediated knockout (Fig. S2C).
Table S1.
Sequences for primers used in ChIP, qRT-PCR, and PCR experiments
| Locus | Forward primer | Reverse primer |
| NR0B1 (ChIP) | GCTATTTAGGGCCTCTCACAGG | CCAGGACCTGGAATTCTCAGC |
| GAPDH (qRT-PCR) | CCGAGCCACATCGCTCAGACA | GCCTTCTCCATGGTGGTGAAG |
| NR0B1 (qRT-PCR) | GGGGACCGTGCTCTTTAACC | CTGACTGTGCCGATGATGG |
| NR0B1 (gDNA) | TGTCTATTTAGGGCCTCTCACA | TCAGGAGTACATGTGCGGGT |
| NR0B1 sgRNA | TAACGCTGCAAGCAAAATGGGGGG | CCCAGGTAATAGTATCCAATAGG |
| Control sgRNA | No sgRNA sequence | No sgRNA sequence |
qRT-PCR.
RNA was collected using an RNeasy Kit (Qiagen). Total RNA from cells was amplified and detected using SYBR green fluorescence for quantitative analysis (23). Primer sequences are listed in Table S1.
Immunodetection.
Antibodies used for immunodetection were as follows: anti-FLI (ab15289; Abcam), anti–α-Tubulin (CP06; Calbiochem), and anti-NR0B1 (ab97369; Abcam).
FLI ChIP and ChIP-Seq.
FLI ChIP experiments were performed as previously described (24) using the anti-FLI antibody (sc-356X; Santa Cruz Biotechnology, Inc.) and chromatin prepared from A673 and HEK 293 EBNA cells. ChIP DNA and input controls were sequenced with the HiSeq Illumina Genome Analyzer, and data were analyzed following the procedures previously described (25–27). See SI Materials and Methods for additional information.
RNA-Seq Data Collection and Analysis.
See SI Materials and Methods for RNA-seq data collection and analysis.
Protein Purification.
Recombinant proteins were expressed in BL21-competent cells from pET28a or pFN18K (EMD Chemicals, Promega) expression plasmids encoding Δ22 and Mut9, respectively. Batch purification conditions are available in SI Materials and Methods.
Fluorescence Polarization.
Fluorescein-labeled DNA duplexes were obtained from IDT (Integrated DNA Technologies). Sequences are listed in Table S2. Fluorescence polarization was performed using a BioTek Synergy2 fluorometer. Recombinant protein preparation is described in SI Materials and Methods. DNA duplex (I) (containing a high-affinity ETS binding site) was used as a control for monomeric protein binding. Binding and stoichiometry assays were performed as before (14). Affinity plots and curve fits were generated using the GraphPad Prism program (GraphPad Software). See detailed procedures in SI Materials and Methods.
Table S2.
Sequences for synthetic microsatellite oligos used in fluorescence anisotropy experiments
| DNA oligo | Sequence, forward strand of duplex |
| FlrHighAffinity | 56-FAM/TT TAC CGG AAG TGT TT |
| Flr2 repeats | 56-FAM/TT TTG GAA GGA ATT TT |
| Flr3 repeats Scramble | 56-FAM/TT GAG AGA GAG AGA TT |
| Flr3 repeats | 56-FAM/TTGGAAGGAAGGAATT |
| Flr4 repeats | 56-FAM/TTGGAAGGAAGGAAGGAA |
| Flr8 repeats | 56-FAM/TTGGAAGGAAGGAAGGAAGGAAGGAAGGAAGGAA |
| Flr12 repeats | 56-FAM/TTGGAAGGAAGGAAGGAAGGAAGGAAGGAAGGAAGGAAGGAAGGAAGGAA |
| Flr16 repeats | 56-FAM/TTGGAAGGAAGGAAGGAAGGAAGGAAGGAAGGAAGGAAGGAAGGAAGGAAGGAAGGAAGGAAGGAA |
| Flr20 repeats | 56-FAM/TTGGAAGGAAGGAAGGAAGGAAGGAAGGAAGGAAGGAAGGAAGGAAGGAAGGAAGGAAGGAAGGAAGGAAGGAAGGAAGGAA |
| Flr22 repeats | 56-FAM/TTGGAAGGAAGGAAGGAAGGAAGGAAGGAAGGAAGGAAGGAAGGAAGGAAGGAAGGAAGGAAGGAAGGAAGGAAGGAAGGAAGGAAGGAA |
Luciferase Assays.
Luciferase reporter assays were performed by transfecting reporter constructs as well as appropriate EWS/FLI expression constructs into HEK 293 EBNA cells. Luminescence was measured after 24 h as described previously (11). See SI Materials and Methods for details.
SI Materials and Methods
Cell Culture.
HEK 293EBNA cells and Ewing sarcoma cell lines (A673, TC71, EWS/502) were infected with CRISPR/Cas9 lentivirus, and A673 cells were retrovirally infected as previously described for EWS/FLI knockdown/rescue experiments (13, 24). Polyclonal cell populations were grown in the appropriate selection media for at least 4 d before any cells were seeded for collection (13, 24). Growth assays were performed in 96-well plates on the IncucyteZoom live cell imager within 7–10 d of lentiviral infection. Briefly, 8,000 cells per well were seeded in triplicate and imaged every 4–6 h for 7–10 d. IncucyteZoom software precalibrated for Ewing sarcoma cells measured cell confluence levels as a percentage to assess cell growth over time.
qRT-PCR.
Total RNA from cells was amplified and detected using SYBR green fluorescence for quantitative analysis in triplicate for each sample (24). Normalized fold enrichment was calculated by determining the fold-change of the mean of each condition relative to the control mean, with the data in each condition normalized to an internal housekeeping control gene, GAPDH. Primer sequences used for qRT-PCR analysis for all target genes are included in Table S1. Two-tailed t tests were used for statistical comparison.
FLI ChIP and ChIP-Seq.
ChIP assays were carried out on A673 and HEK293 cultures of ∼3–10 × 106 cells per sample and per epitope, following the procedures previously described (26, 27). Chromatin from formaldehyde-fixed cells was fragmented to a size range of 200–700 bases with a Misonix Sonicator. Solubilized chromatin was immunoprecipitated with antibodies against FLI (sc-356X; Santa Cruz Biotechnology, Inc.) or IgG (sc-2027; Santa Cruz Biotechnology, Inc.). Antibody–chromatin complexes were pulled down with M-280 sheep anti-rabbit IgG Dynabeads (Thermo Scientific), washed (8 min each in 20 mM Tris–Cl, pH 8.0, buffers containing 250 mM NaCl, 500 mM NaCl, and 250 mM LiCl), and then eluted (50 mM Tris–Cl, pH 8.0, 50 mM NaHCO3, 1% SDS, and 1 mM EDTA). After crosslink reversal RNase A and Proteinase K treatment, immunoprecipitated DNA was extracted with the Mini-Elute PCR purification kit (Qiagen). ChIP DNA was quantified with Qubit. qRT-PCR was performed with NR0B1 primers and normalized with 1% of starting chromatin, used as input, for each sample. ChIP analysis was performed using the percent input method and the fold enrichment method normalized to mock (IgG) control for each sample (Thermo Fisher Scientific). Remaining ChIP DNA samples were used to prepare sequencing libraries, and ChIP DNA and input controls were sequenced with the HiSeq Illumina Genome Analyzer. Peak calling was performed using USeq software (27). Heat maps and the profile plot were generated by individual sorting of the ChIP-seq signal from lowest to highest for each mutant rescue construct and centered on FLI peaks demonstrated in previous A673 cell FLI ChIP-seq data. Integrated Genome Browser (IGB) was used to visualize individual FLI enrichment at specific genomic loci, such as at NR0B1. Raw sequence reads can be found in NCBI’s Gene Expression Omnibus and are accessible through GEO SuperSeries accession number GSE94503.
RNA-Seq Data Collection and Analysis.
A673 cells were stably infected and selected for expression of a control Luc-RNAi or the EF-2–RNAi. Following 4 d of selection, cells were infected with either an empty pMSCV-hygro vector or vector expressing full-length type IV EWS/FLI, the Δ22 EWS/FLI mutant, or Mut9 EWS/FLI mutant. Knockdown and rescue were verified by seeding cells in soft agar in duplicate for each condition. RNA was extracted with an RNAeasy kit (Qiagen) using an on-column DNase digestion protocol. Libraries for deep sequencing were prepared according to the manufacturer’s instructions (Illumina) and sequenced on an Illumina Hi-Seq 4000 to generate 150-bp paired-end reads. Sequences were aligned to the human genome build hg19 using version 2.5.0c of the aligner STAR. Raw sequence reads can be found in NCBI’s Gene Expression Omnibus and are accessible through GEO SuperSeries accession number GSE94503. Raw read counts were generated using htseq-count with intersection-strict mode. Raw counts were normalized in DESeq2 with rlog. The 500 genes most up- and down-regulated by EWS/FLI were used to generate the heat map in pheatmap with default column clustering settings and row clustering off. Differential expression was calculated using DEseq2 for each pairwise comparison of each EWS/FLI construct expressed over EWS/FLI knockdown compared with rescue with an empty vector. Genes selected for GGAA-repeat number vs. mRNA expression level comparison were selected from a panel of microsatellite-associated genes (TSS of gene nearest to the center of the GGAA-microsatellite) that represented a spectrum of GGAA-repeat lengths. The TSS of 9 of the 13 genes selected are within 7 kb of a GGAA-microsatellite. The fold-change values in Fig. 3B represent the mean of at least three biological replicates for each condition, derived from our RNA-seq data (Fig. 3A).
Recombinant Protein Purification.
Recombinant Δ22 and Mut9 proteins were prepared from Escherichia coli BL21(DE3) cells transformed with pET28a or pFN18K (EMD Chemicals, Promega) expression plasmids, respectively. Cultures were auto-induced in low-phosphate ZY media at 37 °C for 7 h and then 24 °C for 20–22 h. Harvested cells were lysed with 0.2 mg/mL lysozyme in a lysis buffer containing a protein inhibitor mixture (Roche), 10% glycerol, 50 mM Tris·HCl (pH 8.0) (Hepes Ph 7.5 for Mut9), 500 mM NaCl, 0.5 mM BME, and 0.1 mM PMSF for 45 min on ice and then sonicated. The cell lysate was centrifuged at 242,000 × g for 45 min. The supernatant was then mixed for 2 h at 4 °C with either Ni-NTA resin (Qiagen) for His-tagged Δ22 or Halo-link resin (EMD Chemicals, Promega) for Halo-tagged Mut9. Resin-bound Δ22 was washed over a column (Fisher) by gravity flow with 50 mM Tris·HCl (pH 8.0), 100 mM NaCl, 10% glycerol, imidazole (40 mM for first wash, 20 mM for second and third wash), and 20 mM BME. Resin-bound Mut9 was washed with buffer containing 50 mM Hepes (pH 7.5), 150 mM NaCl, 0.5 Mm EDTA, and 10% glycerol. TEV protease (EMD Chemicals, Promega) was added to Halo-tagged Mut9 for 1 h at room temperature. TEV protease was removed via mix with Ni-NTA resin for 30 min at 4 °C, followed by 5 min of centrifugation. Supernatant was collected and concentrated with Amicon Ultra centrifugal filters (Millipore). Bound Δ22 was eluted from the resin with a buffer containing 20 mM Tris·HCl (pH 8.0), 500 mM NaCl, 200 mM imidazole, 20 mM BME, and 0.1 mM PMSF. Mut9 was eluted from the resin with buffer containing 50 mM Hepes (pH 7.5), 150 mM NaCl, 0.5 Mm EDTA, and 10% glycerol. Purified proteins were concentrated with Amicon Ultra centrifugal filters (Millipore), and concentrations were determined by absorbance at UV280. Purified protein purities were assessed by SDS/PAGE.
Fluorescence Polarization.
Fluorescence polarization was performed in a 384-well format using a BioTek Synergy2 fluorometer with fluorescein-labeled probes containing 0–22 consecutive GGAA-motifs and 1× Gel Shift binding buffer (Promega Corporation). Sequences of the consecutive GGAA-motifs harboring probes and control sequences used in these assays are listed in Table S2. Recombinant proteins were prepared as described above.
For binding assays, recombinant Δ22 or Mut9 protein concentrations were varied in individual wells in triplicate for each concentration and mixed with DNA at a final concentration at least 10-fold below the expected KD. Samples were incubated at room temperature for at least 25 min before measuring polarization. Polarization values (mP) were measured and plotted as a function of Δ22 or Mut9 protein concentrations. The free and total protein concentrations were assumed to be equal because the DNA concentration is at least 10-fold lower than the KD. The total fluorescence intensities were conserved across all protein concentrations tested, indicating that the characteristics of the probe were stable across different protein concentrations. The affinity plots and curve fits were performed using the GraphPad Prism program, using the one-site total binding equation (GraphPad Software). Each probe was tested in at least two independent experiments.
For stoichiometry experiments, polarization measurements were performed as above. DNA was mixed in binding buffer solution at a concentration 20-fold above the determined KD. Δ22 protein was added to the DNA solution in triplicate in a 384-well plate format at different final molar ratios and equilibrated for at least 25 min before measuring polarization. Each probe was tested in at least two independent experiments. Polarization values were plotted as a function of the concentration ratio of protein versus DNA. The protein:DNA ratio at which an inflection in the data occurs represents the binding stoichiometry, as this is the point at which DNA is saturated by protein and polarization values change minimally as protein concentration increases.
Luciferase Assays.
The pGL3-promoter luciferase vector (Promega) was used for all experimental and control conditions. HEK 293EBNA cells were transfected with experimental reporter plasmid constructs or control plasmids, the Renilla plasmid, and plasmids with Mut9, empty vector, or Mut9/R2L2 cDNA as previously described (11). Firefly luciferase activity was normalized to Renilla luciferase activity to control for transfection efficiency and is reported in figures as “relative luciferase activity.” Each experimental condition was performed in triplicate. Two-tailed t test was used for statistical comparison.
Acknowledgments
We thank Ryan Roberts for critical reading of the manuscript and members of the S.L.L. laboratory for helpful discussions. This work was supported by funds awarded to S.L.L. from the National Cancer Institute (Grants R01 CA140394 and R01 CA183776) and funds awarded to K.M.J. from the National Cancer Institute (Grant F30 CA210588).
Footnotes
Conflict of interest statement: S.L.L. is the Acting Chief Medical Officer of Salarius Pharmaceuticals.
This article is a PNAS Direct Submission.
Data deposition: The data reported in this paper have been deposited in the Gene Expression Omnibus (GEO) database, https://www.ncbi.nlm.nih.gov/geo (accession no. GSE94503).
This article contains supporting information online at www.pnas.org/lookup/suppl/doi:10.1073/pnas.1701872114/-/DCSupplemental.
References
- 1.Delattre O, et al. Gene fusion with an ETS DNA-binding domain caused by chromosome translocation in human tumours. Nature. 1992;359:162–165. doi: 10.1038/359162a0. [DOI] [PubMed] [Google Scholar]
- 2.Braun BS, Frieden R, Lessnick SL, May WA, Denny CT. Identification of target genes for the Ewing’s sarcoma EWS/FLI fusion protein by representational difference analysis. Mol Cell Biol. 1995;15:4623–4630. doi: 10.1128/mcb.15.8.4623. [DOI] [PMC free article] [PubMed] [Google Scholar]
- 3.Sankar S, et al. Mechanism and relevance of EWS/FLI-mediated transcriptional repression in Ewing sarcoma. Oncogene. 2013;32:5089–5100. doi: 10.1038/onc.2012.525. [DOI] [PMC free article] [PubMed] [Google Scholar]
- 4.Lessnick SL, Braun BS, Denny CT, May WA. Multiple domains mediate transformation by the Ewing’s sarcoma EWS/FLI-1 fusion gene. Oncogene. 1995;10:423–431. [PubMed] [Google Scholar]
- 5.May WA, et al. The Ewing’s sarcoma EWS/FLI-1 fusion gene encodes a more potent transcriptional activator and is a more powerful transforming gene than FLI-1. Mol Cell Biol. 1993;13:7393–7398. doi: 10.1128/mcb.13.12.7393. [DOI] [PMC free article] [PubMed] [Google Scholar]
- 6.Wei GH, et al. Genome-wide analysis of ETS-family DNA-binding in vitro and in vivo. EMBO J. 2010;29:2147–2160. doi: 10.1038/emboj.2010.106. [DOI] [PMC free article] [PubMed] [Google Scholar]
- 7.Szymczyna BR, Arrowsmith CH. DNA binding specificity studies of four ETS proteins support an indirect read-out mechanism of protein-DNA recognition. J Biol Chem. 2000;275:28363–28370. doi: 10.1074/jbc.M004294200. [DOI] [PubMed] [Google Scholar]
- 8.Mao X, Miesfeldt S, Yang H, Leiden JM, Thompson CB. The FLI-1 and chimeric EWS-FLI-1 oncoproteins display similar DNA binding specificities. J Biol Chem. 1994;269:18216–18222. [PubMed] [Google Scholar]
- 9.Gangwal K, et al. Microsatellites as EWS/FLI response elements in Ewing’s sarcoma. Proc Natl Acad Sci USA. 2008;105:10149–10154. doi: 10.1073/pnas.0801073105. [DOI] [PMC free article] [PubMed] [Google Scholar]
- 10.Guillon N, et al. The oncogenic EWS-FLI1 protein binds in vivo GGAA microsatellite sequences with potential transcriptional activation function. PLoS One. 2009;4:e4932. doi: 10.1371/journal.pone.0004932. [DOI] [PMC free article] [PubMed] [Google Scholar]
- 11.Monument MJ, et al. Clinical and biochemical function of polymorphic NR0B1 GGAA-microsatellites in Ewing sarcoma: A report from the Children’s Oncology Group. PLoS One. 2014;9:e104378. doi: 10.1371/journal.pone.0104378. [DOI] [PMC free article] [PubMed] [Google Scholar]
- 12.Beck R, et al. EWS/FLI-responsive GGAA microsatellites exhibit polymorphic differences between European and African populations. Cancer Genet. 2012;205:304–312. doi: 10.1016/j.cancergen.2012.04.004. [DOI] [PMC free article] [PubMed] [Google Scholar]
- 13.Kinsey M, Smith R, Lessnick SL. NR0B1 is required for the oncogenic phenotype mediated by EWS/FLI in Ewing’s sarcoma. Mol Cancer Res. 2006;4:851–859. doi: 10.1158/1541-7786.MCR-06-0090. [DOI] [PubMed] [Google Scholar]
- 14.Gangwal K, Close D, Enriquez CA, Hill CP, Lessnick SL. Emergent properties of EWS/FLI regulation via GGAA microsatellites in Ewing’s sarcoma. Genes Cancer. 2010;1:177–187. doi: 10.1177/1947601910361495. [DOI] [PMC free article] [PubMed] [Google Scholar]
- 15.Uren A, Tcherkasskaya O, Toretsky JA. Recombinant EWS-FLI1 oncoprotein activates transcription. Biochemistry. 2004;43:13579–13589. doi: 10.1021/bi048776q. [DOI] [PubMed] [Google Scholar]
- 16.May WA, et al. Ewing sarcoma 11;22 translocation produces a chimeric transcription factor that requires the DNA-binding domain encoded by FLI1 for transformation. Proc Natl Acad Sci USA. 1993;90:5752–5756. doi: 10.1073/pnas.90.12.5752. [DOI] [PMC free article] [PubMed] [Google Scholar]
- 17.Grünewald TG, et al. Chimeric EWSR1-FLI1 regulates the Ewing sarcoma susceptibility gene EGR2 via a GGAA microsatellite. Nat Genet. 2015;47:1073–1078. doi: 10.1038/ng.3363. [DOI] [PMC free article] [PubMed] [Google Scholar]
- 18.Riggi N, et al. EWS-FLI1 utilizes divergent chromatin remodeling mechanisms to directly activate or repress enhancer elements in Ewing sarcoma. Cancer Cell. 2014;26:668–681. doi: 10.1016/j.ccell.2014.10.004. [DOI] [PMC free article] [PubMed] [Google Scholar]
- 19.Patel M, et al. Tumor-specific retargeting of an oncogenic transcription factor chimera results in dysregulation of chromatin and transcription. Genome Res. 2012;22:259–270. doi: 10.1101/gr.125666.111. [DOI] [PMC free article] [PubMed] [Google Scholar]
- 20.Zaret KS, Carroll JS. Pioneer transcription factors: Establishing competence for gene expression. Genes Dev. 2011;25:2227–2241. doi: 10.1101/gad.176826.111. [DOI] [PMC free article] [PubMed] [Google Scholar]
- 21.Kato M, et al. Cell-free formation of RNA granules: Low complexity sequence domains form dynamic fibers within hydrogels. Cell. 2012;149:753–767. doi: 10.1016/j.cell.2012.04.017. [DOI] [PMC free article] [PubMed] [Google Scholar]
- 22.Smith R, et al. Expression profiling of EWS/FLI identifies NKX2.2 as a critical target gene in Ewing’s sarcoma. Cancer Cell. 2006;9:405–416. doi: 10.1016/j.ccr.2006.04.004. [DOI] [PubMed] [Google Scholar]
- 23.Lessnick SL, Dacwag CS, Golub TR. The Ewing’s sarcoma oncoprotein EWS/FLI induces a p53-dependent growth arrest in primary human fibroblasts. Cancer Cell. 2002;1:393–401. doi: 10.1016/s1535-6108(02)00056-9. [DOI] [PubMed] [Google Scholar]
- 24.Hollenhorst PC, Shah AA, Hopkins C, Graves BJ. Genome-wide analyses reveal properties of redundant and specific promoter occupancy within the ETS gene family. Genes Dev. 2007;21:1882–1894. doi: 10.1101/gad.1561707. [DOI] [PMC free article] [PubMed] [Google Scholar]
- 25.Ku M, et al. Genomewide analysis of PRC1 and PRC2 occupancy identifies two classes of bivalent domains. PLoS Genet. 2008;4:e1000242. doi: 10.1371/journal.pgen.1000242. [DOI] [PMC free article] [PubMed] [Google Scholar]
- 26.Mikkelsen TS, et al. Genome-wide maps of chromatin state in pluripotent and lineage-committed cells. Nature. 2007;448:553–560. doi: 10.1038/nature06008. [DOI] [PMC free article] [PubMed] [Google Scholar]
- 27.Nix DA, Courdy SJ, Boucher KM. Empirical methods for controlling false positives and estimating confidence in ChIP-seq peaks. BMC Bioinformatics. 2008;9:523. doi: 10.1186/1471-2105-9-523. [DOI] [PMC free article] [PubMed] [Google Scholar]


