Significance
Intrinsically disordered proteins (IDPs) rapidly exchange between conformations of marginal stability. These transient structures are much more sensitive to solution conditions than ordered proteins. Here we reveal that coupled folding and binding of IDPs are affected by the presence of different common salts beyond simple electrostatic effects, such that their affinities are ion-specific, and occur at physiological concentrations. We demonstrate that the phenomenon is rooted in the structural sensitivity of IDPs to co-solutes, which in turn affects binding rates and affinities. We suggest that the sensitivity of coupled folding and binding reactions to the environment might be a functional consequence of protein disorder. Considering the role of ions in biology, it might be a regulatory mechanism of physiological significance.
Keywords: PPI, folding upon binding, protein stability, co-solute, electrostatic steering
Abstract
Intrinsically disordered proteins (IDPs) are characterized by a lack of defined structure. Instead, they populate ensembles of rapidly interconverting conformations with marginal structural stabilities. Changes in solution conditions such as temperature and crowding agents consequently affect IDPs more than their folded counterparts. Here we reveal that the residual structure content of IDPs is modulated both by ionic strength and by the type of ions present in solution. We show that these ion-specific structural changes result in binding affinity shifts of up to sixfold, which happen through alteration of both association and dissociation rates. These effects follow the Hofmeister series, but unlike the well-established effects on the stability of folded proteins, they already occur at low, hypotonic concentrations of salt. We attribute this sensitivity to the marginal stability of IDPs, which could have physiological implications given the role of IDPs in signaling, the asymmetric ion profiles of different cellular compartments, and the role of ions in biology.
Intrinsically disordered proteins (IDPs) and proteins with intrinsically disordered regions (IDRs) make up a large proportion of the proteome, especially of eukaryotic organisms (1–6). These disordered regions are characterized by a lack of a uniquely defined structure, instead populating many near-isoenergetic conformations (7, 8). Despite their structural heterogeneity, IDPs are functional and involved in numerous cellular tasks (5, 9). The disordered nature and marginal stability of IDPs make their structural ensembles particularly susceptible to changes in solution conditions. For example, it has been demonstrated that changes in solvent excluded volume and ionic strength can significantly affect the radius of gyration of disordered proteins (10, 11).
Coupled folding and binding reactions—where an IDP folds upon binding to its target protein—constitute an important class of protein–protein interactions (PPIs). With the added dimension of folding to the binding reaction, factors affecting affinities and lifetimes of complexes involving IDPs are yet to be completely understood (12). Much of the early work in the field has focused on the protein (sequence) determinant of these reactions (13–17). However, the role of environment (solution) conditions on coupled folding and binding has largely been ignored in biophysical studies, despite the established effect on IDP structural ensembles (10, 18–20).
In the cellular milieu, electrostatic interactions are partially screened by the presence of electrolytes, with the type and concentration of ions present varying in different cellular compartments. Since changing ionic strength affects both long-range electrostatic forces and chain collapse, we investigated its effect on coupled folding and binding reactions.
Here we present the results of an investigation of the effect of charged co-solutes on the coupled folding and binding of two well-characterized and contrasting model IDP systems. We find that association and dissociation rates—and thus the affinity of the complex—are ion type-dependent and not a simple consequence of ionic strength. The discrepancy in association kinetics occurs at surprisingly low ionic strengths and is likely to be relevant at physiological concentrations of salts. We find that the explanation for this ion specificity lies in a high sensitivity of the residual structure of IDPs to ionic strength and the nature of the salt. By demonstrating a correlation between kinetics, ion-induced structural changes, and the Hofmeister series, we provide an explanation for these ion-specific results.
Results
Choice of Experimental Systems.
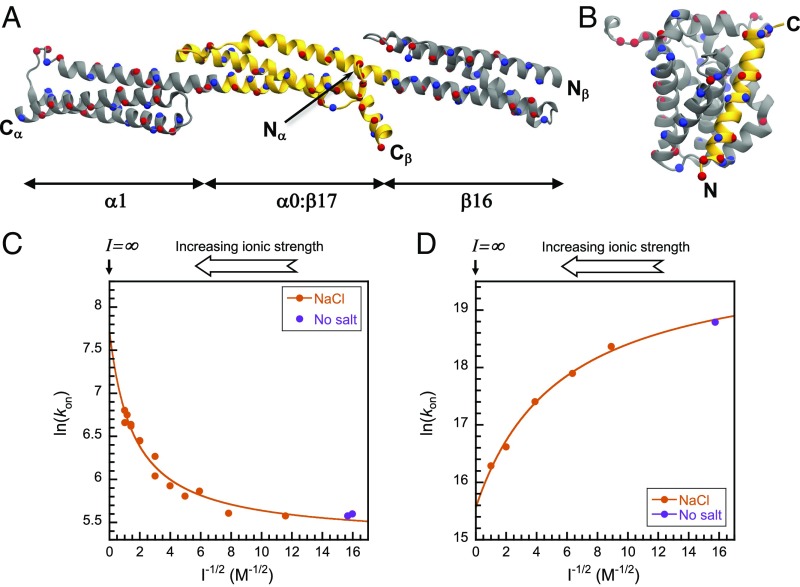
Two well-characterized and contrasting IDP systems were chosen for investigation: the spectrin tetramerization domain (21) and the PUMA:MCL1 (22) complex (described in detail in Fig. 1 A and B, respectively). They possess very different thermodynamic, kinetic, and mechanistic signatures under physiological-like conditions (Table S1) as well as opposite electrostatic steering components to their association rate constants. Under physiological-like conditions, spectrin associates relatively slowly (6.3 × 10² M−1·s−1) (23), while PUMA and MCL1 associate rapidly (1.6 × 10⁷ M−1·s−1) (19). With similar dissociation rate constants (2.6 × 10⁻⁴ s−1 and 1.6 × 10⁻³ s−1, respectively), the stabilities of the resultant complexes are very different: 0.4 μM for spectrin and 0.1 nM for PUMA:MCL1. The amount of structure present at the transition state for the association of each system is also distinctly dissimilar: Spectrin already possesses significant helicity and packing interactions (24), while PUMA is still almost completely disordered and makes few native interactions (14, 15). Using NaCl to screen charge–charge interactions, we found that the association of spectrin is slowed by electrostatic repulsion (Fig. 1C), while the association of PUMA with MCL1 is electrostatically accelerated (Fig. 1D). However, the effects are modest: ∼10-fold for spectrin and ∼25-fold for PUMA:MCL1 between the lowest (4 mM) and infinite ionic strength. Interestingly, while fast overall, binding of PUMA to MCL1 is only marginally accelerated by long-range electrostatics.
Fig. 1.
Model systems and electrostatic modulation of their association speed. (A) Structure of the spectrin tetramerisation domain (α0:β17) flanked by the respective folded domains (α1 and β16 for the α- and β-spectrin chains, respectively). Structure is based on PDB ID code 3LBX (50). (B) Structure of PUMA:MCL1 based on PDB ID code 2ROC (51). The domains/proteins that are folded in isolation are depicted in gray. The IDPs/IDRs are depicted in gold. Asp/Glu and Lys/Arg residues are colored onto their Cα (represented as spheres) in red and blue, respectively. Figures were prepared with VMD (52). Ionic strength dependence of the association rate constants (kon) modulated by NaCl for spectrin (C) and PUMA:MCL1 (D). Increasing salt concentration accelerates spectrin association but reduces the speed of PUMA binding MCL1. Solid lines are fits to the Debye–Hückel-like model (Methods), where the intercept represents the association at infinite ionic strength—that is, the basal rate constant. The ionic strength of the buffer without salt is 4 mM.
Table S1.
Thermodynamic, kinetic, and mechanistic signatures of the systems investigated in this work under physiological-like conditions
| System | kon, M−1·s−1 | koff, s−1 | Kd | Transition state | Conditions |
| α0α1:β16β17 (2, 4) | 6.3 × 10² | 2.6 × 10⁻⁴ | 0.4 μM | Transiently helical β17 docks onto a more structured α0 | 25 °C |
| 50 mM sodium phosphate, 150 mM NaCl, pH 7 | |||||
| I ∼ 250 mM | |||||
| MCL1:PUMA (5, 6) | 1.6 × 10⁷ | 1.6 × 10⁻³ | 0.1 nM | Mostly unstructured (few native interactions present) | 25 °C |
| 50 mM sodium phosphate, pH 7 | |||||
| I ∼ 100 mM |
These data are taken from previously published work (references in column 1).
Different Salts Affect Rates of Complex Formation Beyond Ionic Strength Effects Alone.
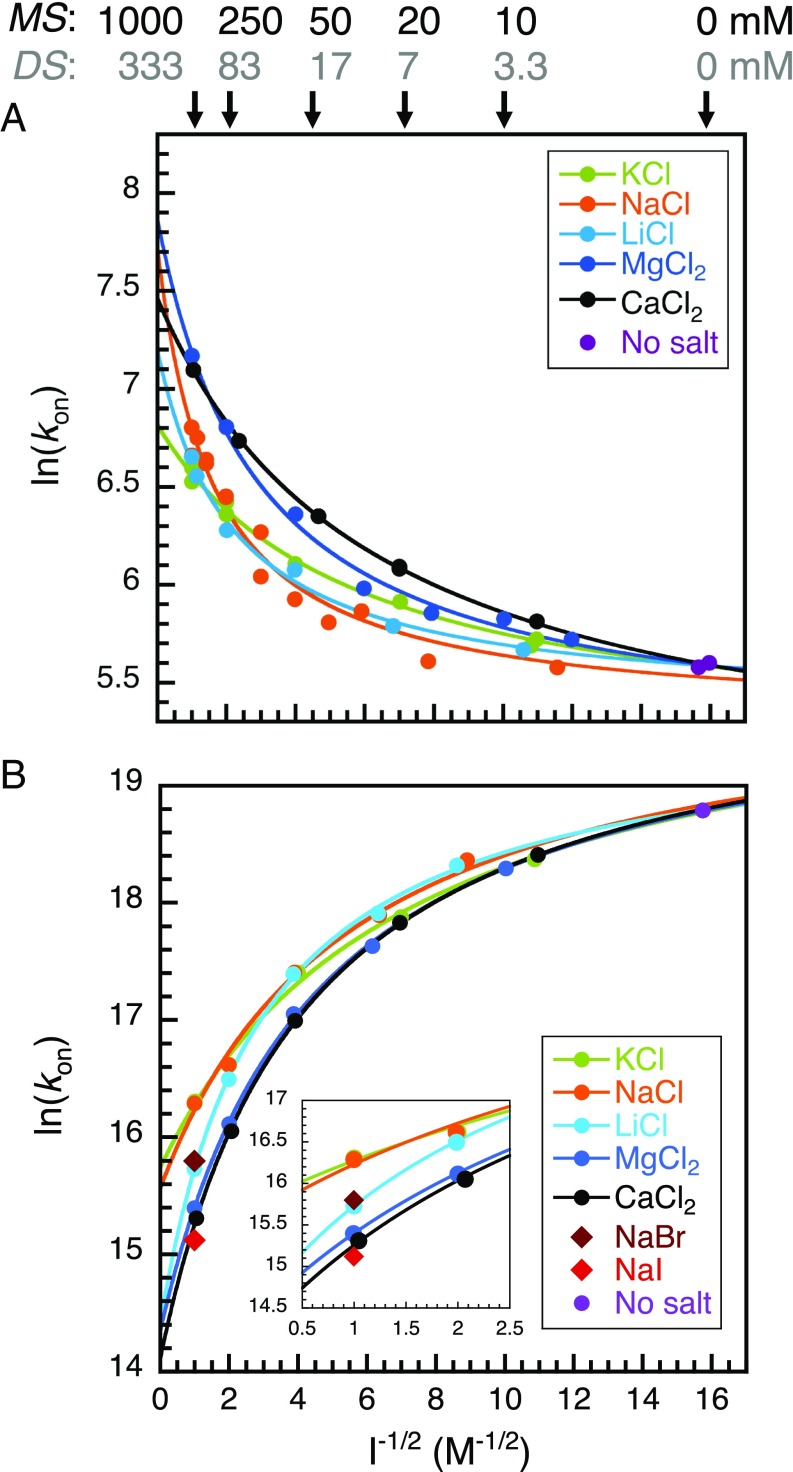
Ionic strength is, by definition, assumed to be independent of the nature of the ion beyond its charge. It is also implicitly assumed that ions in solution affect reaction kinetics through ionic strength alone. We systematically varied one ion type while keeping the counterion constant to test this hypothesis in the context of coupled folding and binding reactions. Chloride salts of monoatomic cations were chosen to avoid possible consequences arising from the specific geometries of polyatomic ions. We focused on the biologically relevant cations K+, Na+, Li+, Mg2+, and Ca2+ to study both mono- and divalent ions. All experiments were performed between 4 mM (no salt added, contribution from the buffer only) and 1 M ionic strength. We found that the association is not only ionic strength-dependent but salt-dependent as well (Fig. 2). The discrepancy between salts is largest for the highest ionic strengths studied, indicating concentration-dependent effects. Consequently, using the Debye–Hückel-like model to fit the data of an ionic strength series for a given salt yields different basal rate constants. Our results clearly show that there is more at play than ionic strength alone. Importantly, we note that systematic deviations are observed for ionic strengths as low as 10 mM (Fig. 2).
Fig. 2.
Association kinetics under a range of ionic strengths and salt types. (A) Association kinetics of spectrin and (B) PUMA:MCL1. The solid lines represent fits to the Debye–Hückel-like model (Methods), where the intercepts are the basal rate constants. For PUMA:MCL1, the results of varying the anion at 1 M ionic strength are shown (compare the results for NaCl, NaBr, and NaI in B). The Inset highlights the ion specificity of the association rate constant (at 1 M ionic strength). The ionic strength in the absence of added salt comes from the buffer and is equal to 4 mM. This point is common to all fitted lines. Some reference values of salt concentrations corresponding to the x scale are indicated for salts with monovalent cations (1:1 salts; MS) and divalent cations (1:2 salts; DS).
The effect of the different salts on each system shows comparable trends. The divalent ions lead to the largest change in rates (acceleration for spectrin and deceleration for PUMA:MCL1) between 4 mM and 1 M ionic strength, despite being present at lower concentrations (1 M ionic strength is achieved with a third of the salt concentration—that is, ∼333 mM; cf. SI Methods). Broadly speaking, the monovalent cations sodium and potassium give rise to the smallest modulation in association rates, and lithium’s effect is intermediate. This is most clearly seen for the PUMA:MCL1 system (Fig. 2B). The effect is substantial, with the largest difference (KCl vs. CaCl2) being about threefold at the same ionic strength (1 M), and more substantial still if simply considering concentration, since the concentration of calcium and magnesium ions are one-third of the monovalent ions when normalizing for ionic strength.
For PUMA:MCL1 the nature of the anion was also systematically varied. There was a clear difference between each salt at 1 M ionic strength. The order Cl− < Br− < I− is highlighted in Fig. 2B, Inset. NaI leads to a larger change in association rate than any of the divalent cations, clearly highlighting that valency is not an accurate predictor for rationalizing the effect of the different salts.
The Different Salts also Modulate the Rate of Complex Dissociation.
The fact that association rates are modulated by the addition of salts beyond their impacts on ionic strength highlights more than a pure electrostatic effect. Therefore, a similar ion-specific behavior might be expected for the dissociation rates. The unimolecular nature of complex dissociation implies no long-range electrostatic steering, and therefore, dissociation rate modulation would confirm ion-specific effects of a different nature to ionic strength. We measured the dissociation rates of PUMA:MCL1 for each salt at 1 M ionic strength and in buffer alone (4 mM ionic strength) (Table 1). As with the association experiments, we observed ion-specific changes in the rate of complex dissociation. The trend for the different salts was identical to that for association, and there was an inverse correlation between the association and dissociation rates; that is, the faster the complex forms, the slower it dissociates. As for the association, the largest change in complex dissociation (KCl vs. CaCl2) was significant and amounted to ∼twofold. Ionic strength also had an effect, since the lifetime of the complex is longer in buffer-only than in any of the 1 M ionic strength conditions. However, the effect is much smaller than on association, as would be expected since there is no screening of long-range electrostatic interactions compared with bimolecular reactions. [Note that the dissociation rates were obtained with a slightly different PUMA sequence containing a dye, meaning that the absolute rates are slightly different. However, an alternative experiment showed similar trends for the actual peptide sequence (Table S2).]
Table 1.
Kinetic and thermodynamic parameters for PUMA binding MCL1 in the presence of different salts (at 1 M ionic strength) and no added salt conditions
| Salt | kon × 106,* M−1·s−1 | koff × 10−3,† s−1 | Kd,‡ nM |
| No salt | 145 ± 4 | 1.5 ± 0.1 | 0.01 ± 0.001 |
| KCl | 12.1 ± 0.4 | 2.42 ± 0.06 | 0.20 ± 0.01 |
| NaCl | 11.9 ± 0.2 | 2.4 ± 0.2 | 0.21 ± 0.02 |
| LiCl | 6.8 ± 0.4 | 2.9 ± 0.2 | 0.43 ± 0.04 |
| MgCl2 | 4.9 ± 0.3 | 4.0 ± 0.4 | 0.82 ± 0.09 |
| CaCl2 | 4.5 ± 0.3 | 5.29 ± 0.03 | 1.19 ± 0.08 |
| NaBr | 7.3 ± 0.3 | 5.7 ± 0.2 | 0.79 ± 0.04 |
| NaI | 3.7 ± 0.1 | — | — |
Errors represent SEM.
From irreversible association experiments between MCL1 and acetylamidated PUMA.
From out-competition dissociation experiments of MCL1:TAMRA-PUMA complex.
From the relationship Kd = koff/kon.
Table S2.
Kinetic and thermodynamic parameters for PUMA binding MCL1 in the presence of different salts (at 1 M ionic strength) and no-salt conditions
| Salt | kon × 106,* M−1·s−1 | koff × 10−2,† s−1 | Kd,‡ nM |
| No salt | 145 ± 4 | 0.7 ± 0.2 | 0.05 ± 0.01 |
| KCl | 12.1 ± 0.4 | 0.82 ± 0.07 | 0.68 ± 0.06 |
| NaCl | 11.9 ± 0.2 | 1.29 ± 0.07 | 1.09 ± 0.06 |
| LiCl | 6.8 ± 0.4 | 1.4 ± 0.1 | 2.0 ± 0.2 |
| MgCl2 | 4.9 ± 0.3 | 0.61 ± 0.06 | 1.25 ± 0.09 |
| CaCl2 | 4.5 ± 0.3 | 1.6 ± 0.2 | 3.5 ± 0.3 |
Errors represent SEM.
From irreversible association experiments between MCL1 and acetylamidated PUMA.
From the relationship koff = Kd × kon.
From reversible, low-nM, association experiments between MCL1 and acetylamidated PUMA.
The Amount of Residual Structure in the IDP Is Ion-Specific.
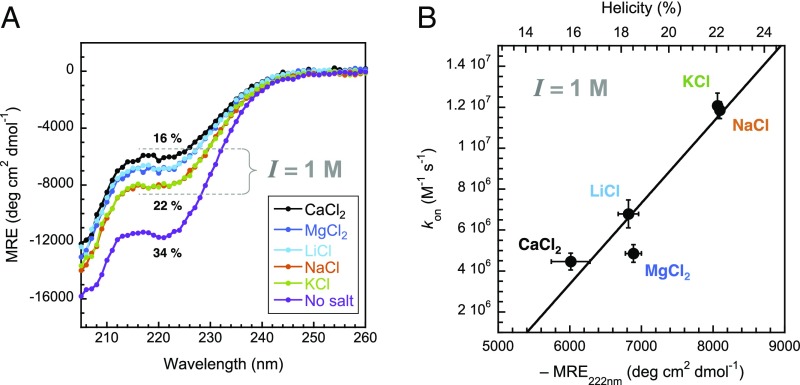
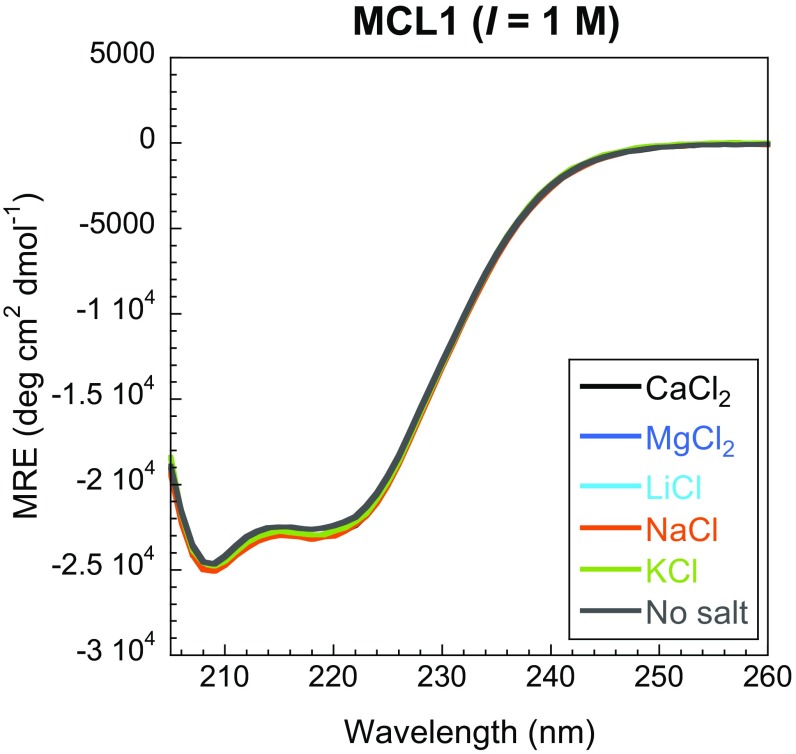
The absence of convergence for the basal association rate constant in the presence of different ions is not consistent with an ionic strength effect alone. Similarly, the dependence of the dissociation rate constant on the nature of the salt suggests an additional effect. We probed possible structural changes using circular dichroism (CD) spectroscopy, allowing bulk secondary structure properties of proteins and changes in residual helicity to be determined (25, 26). In isolation, PUMA showed a reduction in helicity with increasing ionic strength (Fig. 3A). But the residual helicity is also ion-dependent. The effect is far from negligible, with ion-specific changes accounting for about half of the overall change in helicity reported in Fig. 3A, the rest being due to ionic strength. Similar to our kinetics findings, the structural changes do not appear to be a consequence of the valency of the ion, with lithium and magnesium having comparable effects. Importantly, no changes due to either ionic strength or ion type were observed for the folded protein MCL1 (Fig. S1), highlighting the higher sensitivity of IDPs toward changes in solution conditions. Importantly, the rate constants of association of PUMA to MCL1 correlate with structural changes of unbound PUMA observed by CD spectroscopy (Fig. 3B); that is, the more helical the IDP, the faster it binds and the slower it unbinds. We were unable to obtain CD data with bromide and iodide anions as they absorb strongly in the far-UV. Similarly, the spectrin proteins contain large helical folded domains, which give strong CD signals compared with the disordered regions, so it was not possible to assess the effect of salts and ionic strength on the IDR.
Fig. 3.
Association of PUMA with MCL1 correlates with its ion-dependent helicity. (A) Residual structure of PUMA was probed using CD spectroscopy and shows a marked decrease in helical content upon increasing salt concentration. Importantly, the nature of the salt also affects the helicity. (B) The Mean Residue Elipticity (MRE) value at 222 nm is used as a proxy for helicity (the lower the MRE, the higher the helical content), showing a correlation between the association rate constant and the helicity. Some helical contents (%), estimated using the method of Muñoz and Serrano (48), are indicated for reference. Error bars represent SDs.
Fig. S1.
CD spectra of MCL1 in the presence of each salt (ionic strength of 1 M) and no salt. No change in structure is observable, consistent with the absence of any Hofmeister effect for folded proteins under the concentrations of salt investigated in this work (up to 1 M). Each trace is the average of two independent scans.
SI Methods
Protein Expression and Purification.
Genes for recombinant expression of proteins were subcloned into a modified version of the pRSET A vector, containing an N-terminal hexahistidine-tag followed by a thrombin cleavage site. Proteolytic cleavage introduced an extra GS at the N terminus in all cases.
Erythrocytic spectrin proteins from H. sapiens α0α1 and β16β17 were expressed in C41(DE3). α0α1 consists of the first partial (α0) and full (α1) domains of α-spectrin (UniProt P02549 residues 2–163) and β16β17 constitutes the last full (β16) and partial (β17) domains of β-spectrin (UniProt P11277 residues 1,898–2,083). Cells were grown in LB media at 37 °C until they reached an OD600 of 0.4–0.6, induced with isopropyl β-d-1-thiogalactopyranoside (0.1 mM final concentration; ITPG), and protein expression was carried out overnight at 25 °C. Cells were harvested by centrifugation, sonicated, and the proteins were purified from the soluble fraction. Ni-NTA affinity was used as the first purification step. The bound proteins were released from the resin by thrombin cleavage, followed by size-exclusion chromatography (Superdex 75; GE Healthcare) in PBS (50 mM sodium phosphate, 150 mM NaCl, pH 7). The proteins were stored in buffer at 4 °C.
MCL1 (induced myeloid leukemia cell differentiation protein from M. musculus, UniProt P97287 residues 152–308) was produced following a similar protocol, except that overnight expression was carried out at 18 °C. After size-exclusion chromatography in PBS (50 mM sodium phosphate, pH 7), the protein was buffer-exchanged into water, lyophilized, and stored at −20 °C.
PUMA (p53 up-regulated modulator of apoptosis from M. musculus, Q99ML1 residues 127–161, M144A) used for out-competition was expressed as a His6-GB1 fusion containing a Factor Xa cleavage site before the peptide. Expression was carried out at 37 °C for 4 h in C41(DE3)pLysS cells. After sonication, the construct was bound to nickel resin and the peptide cleaved off with Factor Xa (New England Biolabs) in 20 mM Tris, pH 8.0, 50 mM NaCl, and 5 mM CaCl2 overnight. The peptide was first purified by anion-exchange chromatography (HiTrap Q HP; GE Healthcare) with a 20 mM Tris, pH 8.0/1 M NaCl buffer system (elution ∼150 mM ionic strength). The final purification step was size-exclusion chromatography (Superdex 30; GE Healthcare) into 50 mM sodium phosphate, pH 7, and the peptide was stored frozen (−80 °C) until used. For the experiments, the peptide was buffer-exchanged into water containing 0.1% Tween 20 and diluted with 2× MOPS buffers containing the appropriate salt.
Protein identities and purities were checked by SDS/PAGE and mass spectrometry (positive ion LC-MS on a Waters Xevo G2-S QTof).
Peptides.
A 34 residue-long sequence containing the 15 residues from the BH3 motif of PUMA from M. musculus (UniProt Q99ML1 residues 128–161) was synthesized by Selleck Chemicals and used from the lyophilized powder without further purification. This sequence includes the M144I mutation used in the NMR structure 2ROC (51). Termini were protected by N-terminal acetylation and C-terminal amidation. Out-competition dissociation experiments were performed with a slightly different sequence (UniProt Q99ML1 residues 127–161, M144A) containing a TAMRA dye at the N terminus and an unprotected C terminus (Biomatik).
Protein Sequences.
Sequence differences compared with the gene products were limited to redundant N-terminal GS from thrombin cleavage, and a single point mutation at M144 in PUMA [to isoleucine in the acetylamidated peptide, to match the sequence present in the structure of PDB ID code 2ROC (51), and to alanine for the TAMRA-labeled peptide, to reduce oligomerization at high concentrations]. These differences are highlighted in bold. Unstructured regions are underlined. Domain boundaries for spectrin proteins defined as previously reported (23). Protein sequences were almost identical to those found in the protein complex structures [PDB ID codes 2ROC (51) and 3LBX (50)], but with some extra flanking residues:
>α-spectrin from H. sapiens (domains α0α1, UniProt: P02549 2–163) GSEQFPKETVVESSGPKVLETAEEIQERRQEVLTRYQSFKERVAERGQKLEDSYHLQVFKRDADDLGKWIMEKVNILTDKSYEDPTNIQGKYQKHQSLEAEVQTKSRLMSELEKTREERFTMGHSAHEETKAHIEELRHLWDLLLELTLEKGDQLLRALKFQQY
>β-spectrin from H. sapiens (domains β16β17, UniProt: P11277 1,898–2,083) GSQLVDTADKFRFFSMARDLLSWMESIIRQIETQERPRDVSSVELLMKYHQGINAEIETRSKNFSACLELGESLLQRQHQASEEIREKLQQVMSRRKEMNEKWEARWERLRMLLEVCQFSRDASVAEAWLIAQEPYLASGDFGHTVDSVEKLIKRHEAFEKSTASWAERFAALEKPTTLELKERQIAE
>MCL1 from M. musculus (UniProt: P97287 152–308) GSEDDLYRQSLEIISRYLREQATGSKDSKPLGEAGAAGRRALETLRRVGDGVQRNHETAFQGMLRKLDIKNEGDVKSFSRVMVHVFKDGVTNWGRIVTLISFGAFVAKHLKSVNQESFIEPLAETITDVLVRTKRDWLVKQRGWDGFVEFFHVQDLEGG
>PUMABH3 from M. musculus (UniProt: Q99ML1 128–161, M144I, N-terminal acetylation, C-terminal amidation) Ac-VEEEEWAREIGAQLRRIADDLNAQYERRRQEEQH-NH2
>t-PUMABH3 from M. musculus (UniProt: Q99ML1 127–161, M144A, N-terminal TAMRA) TAMRA-RVEEEEWAREIGAQLRRAADDLNAQYERRRQEEQH
Protein Concentrations.
Concentrations of proteins and peptides used in biophysical experiments were determined by absorbance spectroscopy, in multiplicates, using empirical extinction coefficients. Extinction coefficients for spectrin proteins were determined by the method of Gill and von Hippel (53) [ε280(α0α1) = 18,320 M−1·cm−1, ε280(β16β17) = 32,600 M−1·cm−1], while those for MCL1 and PUMA were determined using amino acid analysis [ε280(MCL1) = 22,158 M−1·cm−1, ε280(PUMA) = 7,113 M−1·cm−1]. TAMRA-labeled peptide concentrations were determined using ε555 = 105,000 M−1·cm−1.
Buffers.
All ionic strength studies were performed in 10 mM MOPS, pH 7.0, with variable concentrations of the salt investigated. Buffers for spectrin proteins were prepared at 1× dilution and the proteins buffer-exchanged using HiTrap desalting columns (GE Healthcare). Buffers for PUMA:MCL1 were prepared at 2× concentrations, the lyophilized protein/peptide reconstituted in water containing 0.1% (vol/vol) Tween 20, and the buffer added (1:1 volume). The exact ionic strengths for each buffer (I) were calculated using Eq. S1:
| [S1] |
where ci is the concentration of a specific ion and zi is its net charge. The contribution from MOPS at pH 7.0 was estimated at 4 mM, corresponding to the singly charged species. The zwitterionic species was not included in the calculation, as it does not contribute to ionic strength (47).
CD Spectroscopy.
The effect of different salts and ionic strength on protein structures was assessed using CD spectroscopy in the far-UV using a Chirascan instrument (Applied Photophysics). Scans were performed at 25.0 °C from 205 to 260 nm, collecting every nm for 5–20 s using adaptive sampling. Protein concentrations were 5–10 μM for spectrin and ∼2.5 μM for PUMA/MCL1. The contributions from different concentrations and chain lengths were corrected by reporting mean residual ellipticities (MREs). Estimations of peptides’ helicities from MRE values were calculated according to the method of Muñoz and Serrano (48). CD experiments for each protein/ionic strength condition were performed on a single day from a common stock of protein. This was done to reduce protein concentration-related experimental errors between salt types. Spectrin proteins were directly buffer-exchanged into the appropriate buffer, while PUMA/MCL1 were reconstituted in water from lyophilized stocks, followed by twofold dilution with two-times MOPS buffers. At least two independent samples were prepared for each condition. The individual scans were then averaged, buffer-subtracted, and converted to MRE.
Binding Kinetics.
All association kinetics were carried out on either a SX-18 or SX-20 stopped-flow spectrophotometer (Applied Photophysics) thermostated at 25.0 °C. Experiments were performed using intrinsic tryptophan fluorescence by exciting at 280 nm and using a 320-nm longpass filter. Data collected before the first 5 ms were discarded before fitting due to the mixing artifact of the instruments.
Spectrin association was monitored over 1,000 s, and 10–15 traces were recorded for each condition. The traces were individually fit to a near-equimolar, reversible, bimolecular, two-state model including a linear drift term (54):
| [S2] |
where F is the fluorescence signal, F0 the initial fluorescence, ΔF the fluorescence amplitude of the reaction, a the linear drift term, b = – (Kd + (1 + x)[A]0), z = (Kd2 + 2(1 + x) Kd [A]0 + (x2 – 2x + 1)[A]02)1/2, and x = [B]0/[A]0 with A and B the two proteins involved in the binding reaction. All but x are fitting parameters. This equation allows us to obtain both kon and Kd (and therefore koff) provided that the conditions are near-equimolar and close to the Kd—that is, both forward and backward reactions are significant.
PUMA:MCL1 association was monitored over 2–20 s (adjusted for the slowing down in association rate with increasing ionic strength). Between 20–30 traces were collected and averaged for each condition and fit using a near-equimolar, irreversible, bimolecular, two-state model including a linear drift term (55):
| [S3] |
where all of the terms have the same meaning as for the reversible model. This equation allows us to obtain kon provided that the conditions are near-equimolar and far away from the Kd—that is, the dissociation reaction is negligible.
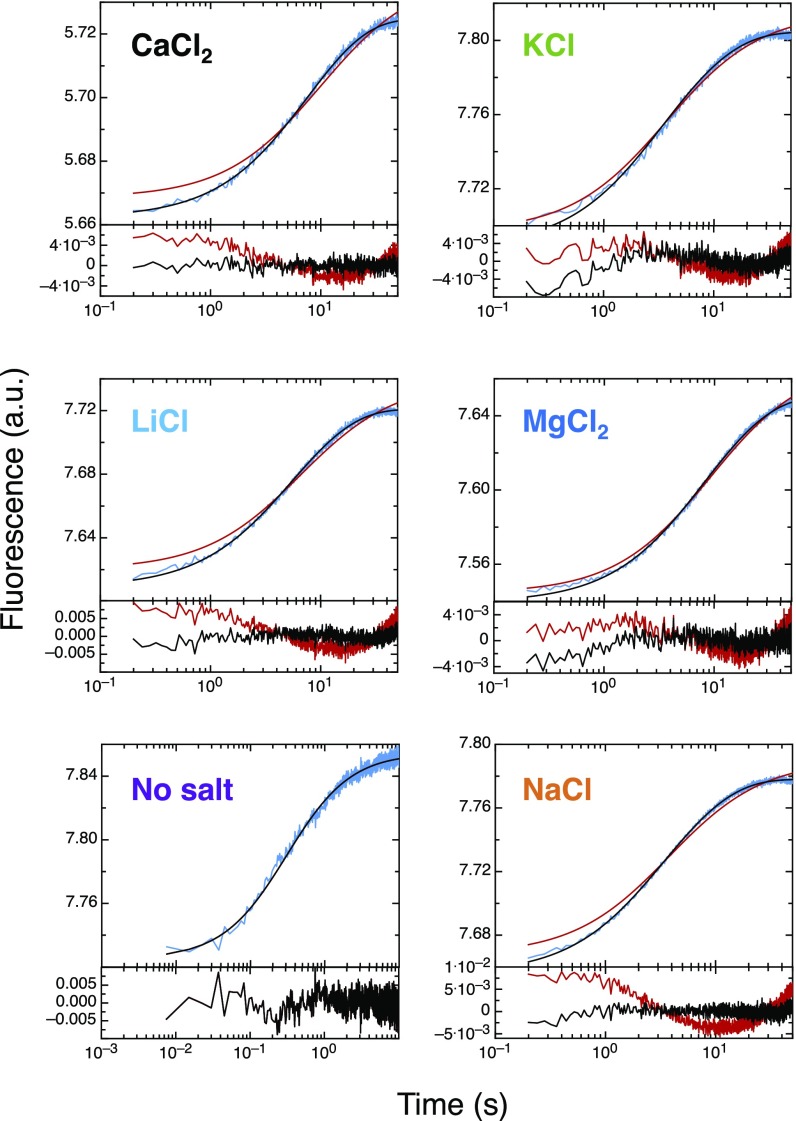
PUMA:MCL1 dissociation rate constants were obtained using two distinct approaches; both gave similar results and the same trend with respect to the different salts (Table 1 and Table S2). The first method involved near-equimolar, reversible association under low-nM concentrations (∼20 nM) of MCL1 and acetylamidated PUMA using stopped-flow kinetics measurements (Fig. S7). Fitting the data to Eq. S2, with kon fixed to the value obtained under irreversible association, yielded Kd. The dissociation rate constants were obtained using koff = kon × Kd, which is valid for a two-state system. The second method involved irreversible dissociation of preformed TAMRA-PUMA:MCL1 complex (171 nM) by out-competition with unlabeled PUMA of the same sequence (80–300× excess, to confirm that the rate constants were independent of out-competitor concentration). The reaction was followed by excitation at 555 nm and measuring fluorescence at 575 nm on a Cary Eclipse fluorescence spectrophotometer (Varian). The data fit to a single exponential decay function.
Fig. S7.
Binding of MCL1 to PUMA under reversible conditions. Binding affinities of acetylamidated PUMA to MCL1 were measured by performing low-nM (∼20 nM), near-equimolar, association experiments. At low concentrations, the dissociation reaction becomes significant, and the data no longer fit to an irreversible bimolecular binding model (Eq. S3, red fits and residuals). Instead, the data are properly captured by a reversible bimolecular binding equation (Eq. S2, black fits and residuals). Fitting of the data to Eq. S2 allows for extraction of Kd and therefore koff. Note that the no-salt condition fits equally well to both models. This is consistent with a tighter affinity where the dissociation reaction is negligible. The experiments were performed for each salt at 1 M ionic strength and no-salt conditions. The residuals to the fits are plotted under each graph. Results from the fits are reported in Table S2.
Debye–Hückel-Like Model.
It has been experimentally demonstrated that for folded proteins, the change in association rate constant with the ionic strength of the solution could be captured by a Debye–Hückel-like formalism (56). This model implies that the rate-limiting step for association is correlated with the electrostatic potential between the proteins, which is altered by the ionic strength of the solution, I. This empirical equation was further rationalized in terms of the Debye length and the basal rate constant for association in the absence of electrostatic interactions, (49).
Discussion
Here we studied the effect of charged co-solutes on two IDP systems having very different kinetic, thermodynamic, and mechanistic signatures (Table S1). Under physiological-like conditions, spectrin associates slowly, with extensive structure present at the transition state, while the PUMA:MCL1 complex is formed rapidly and is mostly unstructured at the transition state. They also proceed through different mechanisms. Association of PUMA with MCL1 is via an induced fit mechanism—PUMA largely folds only after association (14)—whereas the likely explanation for the slow association of spectrin is that it contains some degree of conformational selection (24).
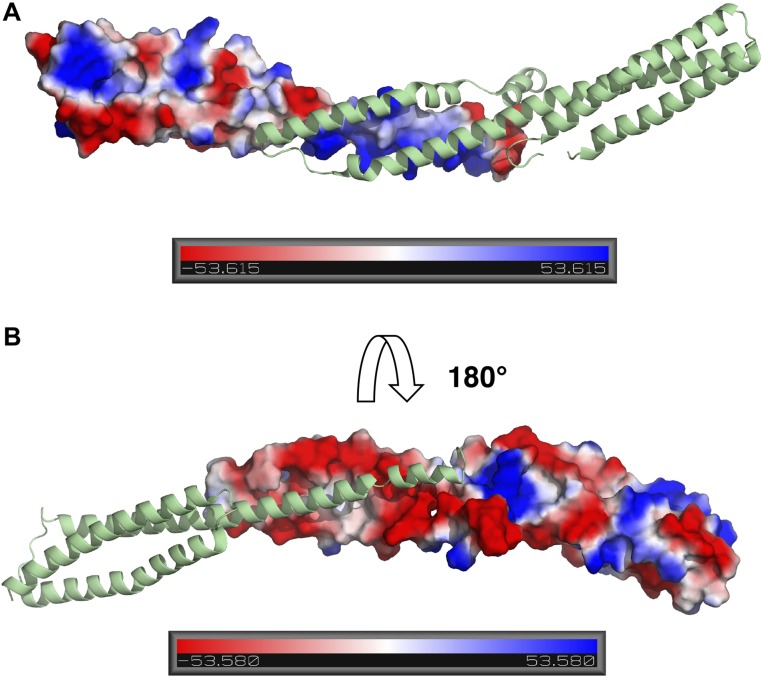
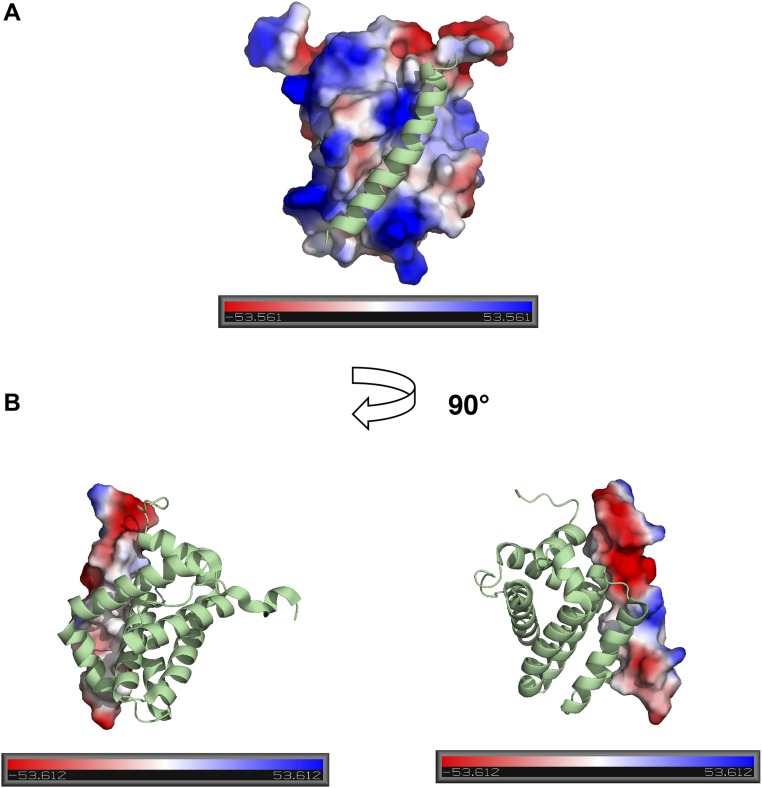
IDPs generally contain a higher proportion of charged residues than folded proteins (27–30). This sequence-level bias, as well as the patterning of charges, has been shown to be important in dictating the overall geometrical features of disordered proteins (10, 31, 32), but less is known about its impact on the kinetics of coupled folding and binding reactions. Here we find that despite their marked differences in binding affinities, net charges, and high number of charged residues (Table S3), both reactions only experience marginal effects from long-range electrostatics (Fig. 1 C and D). This is in stark contrast to the typical electrostatic enhancement reported when both proteins are folded and undergoing fast association (3–5 orders of magnitude) (33). The direction of the effects is as one might expect from knowledge of the overall net charges of the proteins—acceleration of association by salt screening in the case of negatively charged spectrins (∼10 fold), reflecting repulsion, and deceleration for negatively charged PUMA binding to positively charged MCL1 (∼25-fold), where binding is enhanced by electrostatic attraction. Interestingly, repulsive charge–charge interactions are observed for spectrin, despite the presence of electrostatically complementary binding interfaces in the bound structure (Fig. S2), highlighting the importance of long-range electrostatics (considering the overall net charges) over local ones. PUMA and MCL1 have opposite net charges and complementary charge patterns at their interfaces in the bound complex (Fig. S3) yet only exhibit a small enhancing effect from electrostatic steering. It is possible that relatively modest electrostatic steering components to binding rates might be a common feature of IDPs due to their lack of stable structure and thus lack of well-defined, preformed binding interfaces in isolation.
Table S3.
Number of charged residues and estimated isoelectric points for each protein
| Protein | No. Asp | No. Glu | No. Arg | No. Lys | No. AA, total | Asp + Glu, % | Arg + Lys, % | Charged residues, % | Net charge* | pI† |
| α0α1 | 8 | 25 | 11 | 15 | 164 | 20.1 | 15.8 | 36.0 | −7 | 5.48 |
| α1, folded | 8 | 15 | 6 | 12 | 116 | 19.8 | 15.5 | 35.3 | −5 | 5.68 |
| α0, IDR | 0 | 10 | 5 | 3 | 48 | 20.8 | 16.7 | 37.5 | −2 | 5.06 |
| β16β17 | 7 | 26 | 17 | 11 | 188 | 17.5 | 14.9 | 32.4 | −5 | 5.56 |
| β16, folded | 4 | 15 | 12 | 6 | 109 | 17.4 | 16.5 | 33.9 | −1 | 6.20 |
| β17, IDR | 3 | 11 | 5 | 5 | 79 | 17.7 | 12.7 | 30.4 | −4 | 5.11 |
| MCL1 | 11 | 12 | 14 | 10 | 159 | 14.5 | 15.1 | 29.6 | +1 | 8.20 |
| PUMABH3‡ | 2 | 8 | 6 | 0 | 34 | 29.4 | 17.6 | 47.0 | −4 | 4.75 |
| t-PUMABH3§ | 2 | 8 | 7 | 0 | 35 | 28.6 | 20.0 | 48.6 | −4 | 4.97 |
Calculated by summing the net charges of Asp, Glu, Arg, and Lys, assuming full ionization at pH 7 (corresponding to our experimental conditions).
pIs were estimated at the sequence level using ProtParam (web.expasy.org/protparam/).
The sequence is acetylamidated (both termini are protected and no longer contain any charges). This is considered for estimating the net charge but not the pI.
The peptide has an N-terminal TAMRA dye (zwitterion with a neutral net charge) and a free C terminus. This is considered for estimating the net charge but not the pI.
Fig. S2.
Relative electrostatic potential contact maps for spectrin proteins. (A) Map of α-spectrin with β-spectrin displayed in cartoon representation. (B) Map of β-spectrin with α-spectrin in cartoon representation. Structures are based on PDB ID code 3LBX (50) and electrostatic maps generated with PyMOL (Schrödinger, Inc.). The scales are in units of kBT/e, where kB is the Boltzmann constant, T the temperature, and e the unit charge.
Fig. S3.
Relative electrostatic potential contact maps for MCL1 and PUMA proteins. (A) Map of MCL1 with PUMA displayed in cartoon representation. (B) Map of PUMA with MCL1 in cartoon representation. Structures are based on PDB ID code 2ROC (51) and electrostatic maps generated with PyMOL (Schrödinger, Inc.). The scales are in units of kBT/e, where kB is the Boltzmann constant, T the temperature, and e the unit charge. Each structure is oriented so that the N terminus of PUMA is located at the bottom of the image.
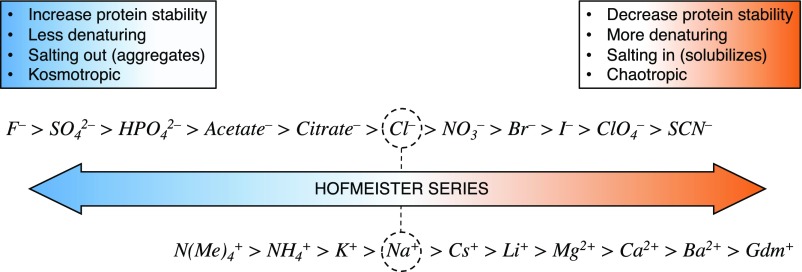
We further show that the residual structure content of the IDP is ion-dependent. We note that the folded protein MCL1 is structurally unaffected under the same conditions (Fig. S1), clearly highlighting the higher sensitivity of IDPs to environmental conditions compared with folded proteins. The results presented in Fig. 3A highlight that (i) ionic strength affects the stability of the transient helix of PUMA and (ii) the amount of residual helicity is ion-dependent. We stress that this is not simply an effect of valency, as evident from the similar CD spectra in the presence of Li+ or Mg2+, therefore excluding specific binding or chelate effects as the reason for the observed trend. Nor would the charge density of the ions, which has been reported to affect RNA folding (34), explain the kinetic results observed for the anion series (Fig. 2), as the trend would be expected to be the inverse if that was the case. Rather, these structural changes follow the Hofmeister series of the corresponding ions (Fig. S4). This classification of ions and their associated effect on protein stability has long been established (35) and has been the focus of extensive research over the years (36–40). The exact physical principle behind the Hofmeister effect remains controversial, but binding to peptide backbones and charged residues seems to be the cause of altered protein stability (41). While our experiments do not answer the atomistic details of ion specificity, we demonstrate sizeable structural effects at low concentrations of ‘common’ salts. Furthermore, we can relate the stability/structural changes of the IDP to binding affinities in the context of coupled folding and binding reactions. We suggest that the marginal folding stability of IDPs as well as their larger solvent-accessible surface area are the reasons for their greater sensitivity. Indeed, compared with folded proteins that require multimolar concentrations of salts before structural effects become apparent, IDPs are already affected in the low millimolar regime. This might be a functional consequence of protein disorder.
Fig. S4.
Hofmeister series for both anions and cations. It provides a qualitative ranking of ions with respect to their ability to solubilize (salting in) or precipitate (salting out) proteins in solutions. The series is centered around sodium and chloride, which are traditionally taken as references of “neutral” effects within each series.
Importantly, we reveal that ions affect more than the structure of the free IDP and also modulate binding rates specifically. This is attributable to the added dimension of folding that lies on-pathway for IDPs binding to their partners. We demonstrate a correlation between the ion-specific amount of residual structure in free PUMA and its rate of association with MCL1 (Fig. 3B); the less structured PUMA is, the slower it associates. We emphasize that this correlation does not imply conformational selection and is equally consistent with an induced-fit mechanism (42). This kinetic divergence becomes more pronounced the more salt there is, indicating a concentration-dependent effect, but we emphasize that deviation in binding rates occurs at concentrations as low as 10 mM.
Interestingly, a correlation is also observed for the dissociation rate constants. However, the effect of each salt is opposite to that on the association; that is, the slower the association, the faster the dissociation of the complex. Importantly, the fact that these effects are opposite means that they compound in terms of binding affinity, shifting the Kd even more than if only an effect on the association or dissociation rate constant was observed (Table 1 and Fig. S5). Taking potassium and calcium at 1 M ionic strength as an example, there is a ∼threefold difference in kon and a ∼twofold difference in koff, which implies a sixfold shift in affinity. We stress that this effect is purely due to the nature of the ion, since the results are within the same ionic strength, therefore excluding long-range electrostatic effects. It is tempting to speculate that the observed changes in rates point to both a ground state effect of the IDP (probed by CD) and a transition-state effect, since the dissociation rates are affected but the bound complex is not.
Fig. S5.
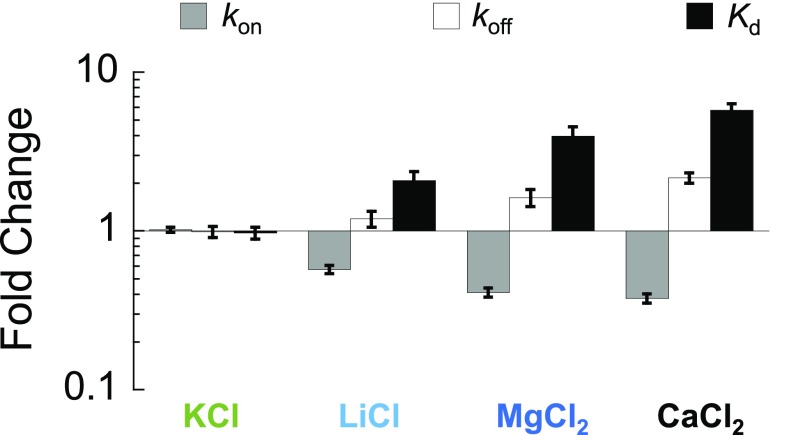
Fold change compared with NaCl. The fold change for the association rate constant (kon), the dissociation rate constant (koff), and the binding affinity (Kd) between each salt and NaCl (all at 1 M ionic strength). Error bars; from standard error propagation of the SEM as reported in Table 1.
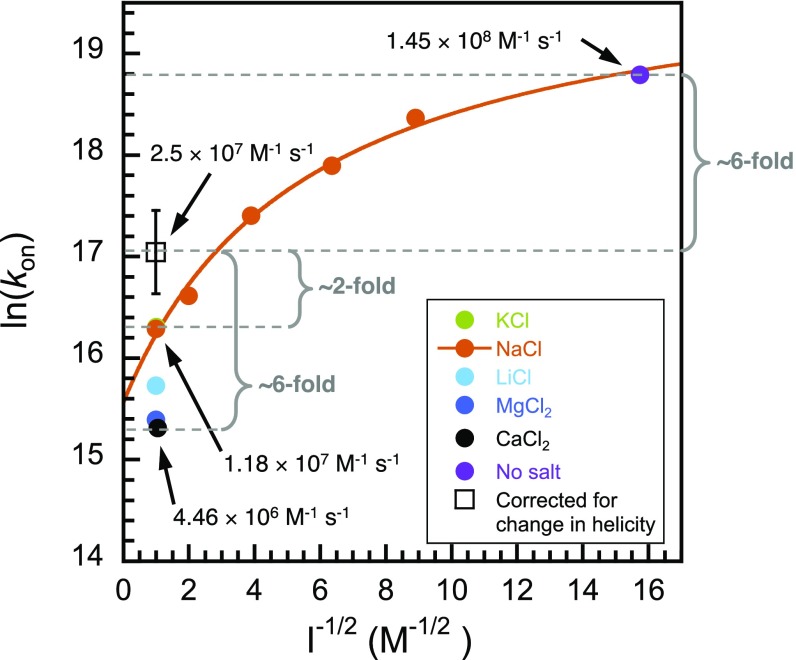
Ionic strength, regardless of ion-type, destabilizes the nascent helical structure in PUMA as evident from Fig. 3A and Fig. S6 (PUMA in the presence of all salts at 1 M ionic strength is less helical than under buffer-only condition). Thus, salt concentration may affect association rates of IDPs by two different mechanisms: through shielding of long-range electrostatic interactions and through changes in residual structure. But what is the relative weight of each effect on the rate of formation of the IDP:partner complex? By comparing salts within ionic strengths, we can deconvolute general electrostatic from ion-specific effects. The correlation obtained from Fig. 3B (helicity vs. association rate for the different salts at 1 M ionic strength) can be used to estimate the association rate constant for any arbitrary values of MRE at the same ionic strength (Fig. 4). We can therefore deconvolute the electrostatic and structural effects by comparing observed rate constants with estimated rate constants corrected for helicity. Using the MRE222 nm value at 4 mM ionic strength (buffer-only), the extrapolated association rate constant (kon) at 1 M ionic strength becomes 2.5 ± 1.0 × 10⁷ M−1·s−1. This corresponds to the association rate constant assuming no change in helicity over the range 4 mM to 1 M ionic strength. Taking NaCl as an example, this suggests that the ∼12-fold decrease in kon observed over that range is sixfold electrostatic and twofold due to reduction in helicity. The effect is even more pronounced for, for example, CaCl2, where the ∼35-fold change is sixfold electrostatic and ∼sixfold structural; half of the observed change in rate constant results from loss of intrinsic helical structure of the IDP. Intriguingly, these results imply that the association of PUMA with MCL1 is even less electrostatically enhanced than previously thought. It is possible, even probable, that in some systems the effect might be opposing—in the spectrin system, for example, increased ionic strength speeds association, but if salts were to decrease residual structure, and thereby decrease the on-rate, the apparent effect of ionic strength might be less. We suggest that use of different salts while keeping the ionic strength constant could be used for mechanistic investigations, allowing the deconvolution of structural and electrostatic effects in coupled folding and binding reactions.
Fig. S6.
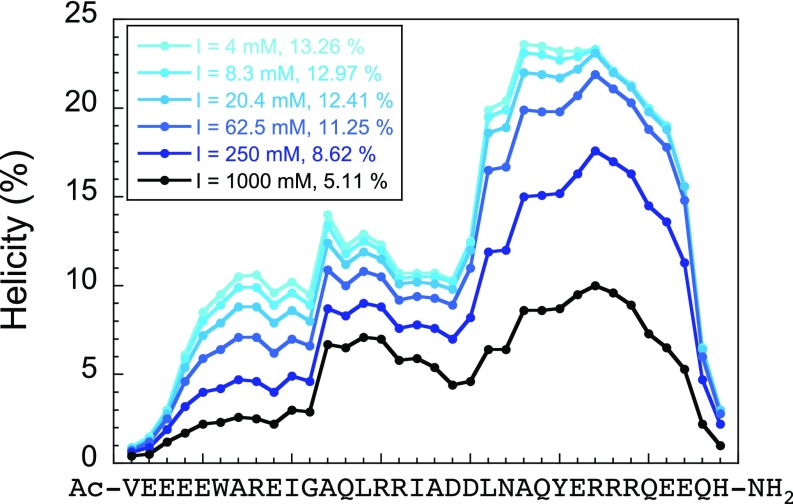
Agadir (48, 57–60) plot of acetylamidated PUMA showing residue-level helicity and overall helicity (indicated in the legend). The peptide shows a reduction in helicity with increasing ionic strength, which is consistent with our CD data (Fig. 3A). We note that the absolute values of helicities are different, but the fold change approximately matches our experimental data. Calculations were performed under the same conditions as our experiments (25 °C, pH 7, and ionic strengths corresponding to our MOPS buffers).
Fig. 4.
Contribution of PUMA helicity to its association rate constant. Adding salt affects both long-range electrostatics (Figs. 1D and 2B) and residual structure content (Fig. 3A). Depicted in open square is the predicted rate constant at I = 1 M, assuming no change in helicity compared with buffer-only. Comparison between this point and the observed rate constants for the different salts at 1 M ionic strength indicates a two- to sixfold discrepancy due to changes in helicity. The extrapolated point (open square) was obtained by using the fit to the line of Fig. 3B [kon = −2.03 × 10⁷ + 3,948.6 × (−MRE222 nm)] and the MRE value of PUMA under no salt condition (−11,536 deg·cm2·dmol−1). The plot and Debye–Hückel fit for the association of PUMA with MCL1 in the presence of NaCl (Fig. 1D) is reproduced here for comparison. The error bars represent relative error and were obtained using standard error propagation calculations.
Conclusions
PPIs involving IDPs are of enormous biological significance, and it has been shown that relatively small changes in affinity, stemming from changes in the residual structure of the IDP, can have significant physiological consequences. In the context of p53 binding MDM2, for instance, changes in residual structure upon mutation resulted in a 10-fold shift in Kd that strongly impaired cellular function (43). Despite their importance and prevalence, far less is understood about the fundamental biophysics of IDP:partner interactions than about PPIs involving structured partners (12, 42). In particular, the role of solvent conditions and co-solutes are usually neglected, despite their known effect on IDP structural ensembles (10, 11). We performed a systematic analysis of the role of charged co-solutes on coupled folding and binding reactions, on two very different intrinsically disordered systems. Our results revealed that binding affinities are ion-specific, even when normalized for ionic strength. By deconvoluting the stability of the complex into its kinetic components, we show that affinity changes stem from variation in both the association and dissociation rate constants. These ion-specific differences are linked to structural changes in the free IDP and the transition state and relate to the Hofmeister series. Surprisingly, these effects occur at low concentrations of salts, which, to the best of our knowledge, has been unappreciated so far. We suggest that the marginal folding stability of IDPs results in higher structural sensitivity, even to modest changes in environmental conditions. This translates into modulation of binding kinetics and affinity even at physiological concentrations of salt. We expect these findings to be generally applicable to PPIs involving disordered partners. It is interesting to speculate that this system-dependent sensitivity to environmental conditions may have physiological implications, given the asymmetric ion profiles of different cellular compartments (44), the role of ion fluxes in signaling pathways (45), and the importance of charged osmolytes in maintaining cellular function (46).
Methods
Protein and Peptides.
Both erythrocyte spectrin proteins from Homo sapiens [α0α1; first partial (α0) and full (α1) domains of α-spectrin (UniProt P02549 residues 2–163) and β16β17; last full (β16) and partial (β17) domains of β-spectrin (UniProt P11277 residues 1,898–2,083)] were expressed and purified as described previously (23). MCL1 from Mus musculus (UniProt P97287 residues 152–308) was produced as reported (19). PUMA from M. musculus (UniProt Q99ML1 residues 128–161, M144I) was purchased from Selleck Chemicals. For dissociation experiments, TAMRA-labeled PUMA (Biomatik), was out-competed by a peptide of the same sequence [produced recombinantly (15)]. Sequences and detailed protocols are reported in SI Methods.
Buffers.
All ionic strength studies were performed in 10 mM MOPS, pH 7.0, with variable concentrations of the salt investigated. The ionic strength contribution from MOPS at pH 7.0 was estimated at 4 mM, corresponding to the singly charged species. The zwitterionic species was not included in the calculation, as it does not contribute to ionic strength (47).
CD Spectroscopy.
The effects of different salts and ionic strengths on protein structures were assessed using CD spectroscopy in the far-UV using a Chirascan instrument (Applied Photophysics). Estimations of peptides’ helicities from MRE values were calculated according to the method of Muñoz and Serrano (48).
Binding Kinetics.
All association kinetics were carried out on either a SX-18 or SX-20 stopped-flow spectrophotometer (Applied Photophysics) thermostated at 25.0 °C. Experiments were performed using intrinsic tryptophan fluorescence by exciting at 280 nm and using a 320-nm long-pass filter. Details of experimental conditions and kinetic equations used for fitting can be found in SI Methods. Dissociation kinetics of the TAMRA-PUMA:MCL1 complex was followed by excitation at 555 nm and measuring fluorescence at 575 nm on a Cary Eclipse fluorescence spectrophotometer (Varian). Sample kinetic traces are shown in Fig. S7.
Debye–Hückel-Like Model.
The second-order rate constants obtained as a function of ionic strength were fitted to a Debye–Hückel-like model to estimate the basal rate constant of association that would be observed in the absence of long-range electrostatic interactions. We used a rearranged version of the equation proposed by Vijayakumar et al. (49):
| [1] |
where and are the free-fitting parameters. In this equation, QA and QB represent the charges of the proteins, d is the separation distance of the encounter complex, kB is the Boltzmann constant, NA is the Avogadro’s number, T is the temperature, e is the elementary charge, and ε is the permittivity of water ε = ε0∙εr. Additional details can be found in SI Methods.
Acknowledgments
This work was supported by Wellcome Trust Grant WT095195. J.C. is a Wellcome Trust Senior Research Fellow. B.I.M.W. is supported by a Cambridge Trust Scholarship.
Footnotes
The authors declare no conflict of interest.
This article is a PNAS Direct Submission.
This article contains supporting information online at www.pnas.org/lookup/suppl/doi:10.1073/pnas.1705105114/-/DCSupplemental.
References
- 1.Wright PE, Dyson HJ. Intrinsically unstructured proteins: Re-assessing the protein structure-function paradigm. J Mol Biol. 1999;293:321–331. doi: 10.1006/jmbi.1999.3110. [DOI] [PubMed] [Google Scholar]
- 2.Dunker AK, et al. Intrinsically disordered protein. J Mol Graph Model. 2001;19:26–59. doi: 10.1016/s1093-3263(00)00138-8. [DOI] [PubMed] [Google Scholar]
- 3.van der Lee R, et al. Classification of intrinsically disordered regions and proteins. Chem Rev. 2014;114:6589–6631. doi: 10.1021/cr400525m. [DOI] [PMC free article] [PubMed] [Google Scholar]
- 4.Tompa P. Unstructural biology coming of age. Curr Opin Struct Biol. 2011;21:419–425. doi: 10.1016/j.sbi.2011.03.012. [DOI] [PubMed] [Google Scholar]
- 5.Wright PE, Dyson HJ. Intrinsically disordered proteins in cellular signalling and regulation. Nat Rev Mol Cell Biol. 2015;16:18–29. doi: 10.1038/nrm3920. [DOI] [PMC free article] [PubMed] [Google Scholar]
- 6.Ward JJ, Sodhi JS, McGuffin LJ, Buxton BF, Jones DT. Prediction and functional analysis of native disorder in proteins from the three kingdoms of life. J Mol Biol. 2004;337:635–645. doi: 10.1016/j.jmb.2004.02.002. [DOI] [PubMed] [Google Scholar]
- 7.Eliezer D. Biophysical characterization of intrinsically disordered proteins. Curr Opin Struct Biol. 2009;19:23–30. doi: 10.1016/j.sbi.2008.12.004. [DOI] [PMC free article] [PubMed] [Google Scholar]
- 8.Chebaro Y, Ballard AJ, Chakraborty D, Wales DJ. Intrinsically disordered energy landscapes. Sci Rep. 2015;5:10386. doi: 10.1038/srep10386. [DOI] [PMC free article] [PubMed] [Google Scholar]
- 9.Uversky VN, Oldfield CJ, Dunker AK. Intrinsically disordered proteins in human diseases: Introducing the D2 concept. Annu Rev Biophys. 2008;37:215–246. doi: 10.1146/annurev.biophys.37.032807.125924. [DOI] [PubMed] [Google Scholar]
- 10.Müller-Späth S, et al. Charge interactions can dominate the dimensions of intrinsically disordered proteins. Proc Natl Acad Sci USA. 2010;107:14609–14614. doi: 10.1073/pnas.1001743107. [DOI] [PMC free article] [PubMed] [Google Scholar]
- 11.Soranno A, et al. Single-molecule spectroscopy reveals polymer effects of disordered proteins in crowded environments. Proc Natl Acad Sci USA. 2014;111:4874–4879. doi: 10.1073/pnas.1322611111. [DOI] [PMC free article] [PubMed] [Google Scholar]
- 12.Gibbs EB, Showalter SA. Quantitative biophysical characterization of intrinsically disordered proteins. Biochemistry. 2015;54:1314–1326. doi: 10.1021/bi501460a. [DOI] [PubMed] [Google Scholar]
- 13.Iešmantavičius V, Dogan J, Jemth P, Teilum K, Kjaergaard M. Helical propensity in an intrinsically disordered protein accelerates ligand binding. Angew Chem Int Ed Engl. 2014;53:1548–1551. doi: 10.1002/anie.201307712. [DOI] [PubMed] [Google Scholar]
- 14.Rogers JM, et al. Interplay between partner and ligand facilitates the folding and binding of an intrinsically disordered protein. Proc Natl Acad Sci USA. 2014;111:15420–15425. doi: 10.1073/pnas.1409122111. [DOI] [PMC free article] [PubMed] [Google Scholar]
- 15.Rogers JM, Wong CT, Clarke J. Coupled folding and binding of the disordered protein PUMA does not require particular residual structure. J Am Chem Soc. 2014;136:5197–5200. doi: 10.1021/ja4125065. [DOI] [PMC free article] [PubMed] [Google Scholar]
- 16.Toto A, Gianni S. Mutational analysis of the binding-induced folding reaction of the mixed-lineage leukemia protein to the KIX domain. Biochemistry. 2016;55:3957–3962. doi: 10.1021/acs.biochem.6b00505. [DOI] [PubMed] [Google Scholar]
- 17.Toto A, Giri R, Brunori M, Gianni S. The mechanism of binding of the KIX domain to the mixed lineage leukemia protein and its allosteric role in the recognition of c-Myb. Protein Sci. 2014;23:962–969. doi: 10.1002/pro.2480. [DOI] [PMC free article] [PubMed] [Google Scholar]
- 18.Soranno A, et al. Quantifying internal friction in unfolded and intrinsically disordered proteins with single-molecule spectroscopy. Proc Natl Acad Sci USA. 2012;109:17800–17806. doi: 10.1073/pnas.1117368109. [DOI] [PMC free article] [PubMed] [Google Scholar]
- 19.Rogers JM, Steward A, Clarke J. Folding and binding of an intrinsically disordered protein: Fast, but not ‘diffusion-limited’. J Am Chem Soc. 2013;135:1415–1422. doi: 10.1021/ja309527h. [DOI] [PMC free article] [PubMed] [Google Scholar]
- 20.Dogan J, Jonasson J, Andersson E, Jemth P. Binding rate constants reveal distinct features of disordered protein domains. Biochemistry. 2015;54:4741–4750. doi: 10.1021/acs.biochem.5b00520. [DOI] [PubMed] [Google Scholar]
- 21.Speicher DW, Marchesi VT. Erythrocyte spectrin is comprised of many homologous triple helical segments. Nature. 1984;311:177–180. doi: 10.1038/311177a0. [DOI] [PubMed] [Google Scholar]
- 22.Czabotar PE, Lessene G, Strasser A, Adams JM. Control of apoptosis by the BCL-2 protein family: Implications for physiology and therapy. Nat Rev Mol Cell Biol. 2014;15:49–63. doi: 10.1038/nrm3722. [DOI] [PubMed] [Google Scholar]
- 23.Shammas SL, Rogers JM, Hill SA, Clarke J. Slow, reversible, coupled folding and binding of the spectrin tetramerization domain. Biophys J. 2012;103:2203–2214. doi: 10.1016/j.bpj.2012.10.012. [DOI] [PMC free article] [PubMed] [Google Scholar]
- 24.Hill SA, Kwa LG, Shammas SL, Lee JC, Clarke J. Mechanism of assembly of the non-covalent spectrin tetramerization domain from intrinsically disordered partners. J Mol Biol. 2014;426:21–35. doi: 10.1016/j.jmb.2013.08.027. [DOI] [PMC free article] [PubMed] [Google Scholar]
- 25.Kelly SM, Jess TJ, Price NC. How to study proteins by circular dichroism. Biochim Biophys Acta. 2005;1751:119–139. doi: 10.1016/j.bbapap.2005.06.005. [DOI] [PubMed] [Google Scholar]
- 26.Greenfield NJ. Using circular dichroism spectra to estimate protein secondary structure. Nat Protoc. 2006;1:2876–2890. doi: 10.1038/nprot.2006.202. [DOI] [PMC free article] [PubMed] [Google Scholar]
- 27.Uversky VN, Gillespie JR, Fink AL. Why are “natively unfolded” proteins unstructured under physiologic conditions? Proteins. 2000;41:415–427. doi: 10.1002/1097-0134(20001115)41:3<415::aid-prot130>3.0.co;2-7. [DOI] [PubMed] [Google Scholar]
- 28.Romero P, et al. Sequence complexity of disordered protein. Proteins. 2001;42:38–48. doi: 10.1002/1097-0134(20010101)42:1<38::aid-prot50>3.0.co;2-3. [DOI] [PubMed] [Google Scholar]
- 29.Weathers EA, Paulaitis ME, Woolf TB, Hoh JH. Reduced amino acid alphabet is sufficient to accurately recognize intrinsically disordered protein. FEBS Lett. 2004;576:348–352. doi: 10.1016/j.febslet.2004.09.036. [DOI] [PubMed] [Google Scholar]
- 30.Lise S, Jones DT. Sequence patterns associated with disordered regions in proteins. Proteins. 2005;58:144–150. doi: 10.1002/prot.20279. [DOI] [PubMed] [Google Scholar]
- 31.Das RK, Pappu RV. Conformations of intrinsically disordered proteins are influenced by linear sequence distributions of oppositely charged residues. Proc Natl Acad Sci USA. 2013;110:13392–13397. doi: 10.1073/pnas.1304749110. [DOI] [PMC free article] [PubMed] [Google Scholar]
- 32.Mao AH, Crick SL, Vitalis A, Chicoine CL, Pappu RV. Net charge per residue modulates conformational ensembles of intrinsically disordered proteins. Proc Natl Acad Sci USA. 2010;107:8183–8188. doi: 10.1073/pnas.0911107107. [DOI] [PMC free article] [PubMed] [Google Scholar]
- 33.Schreiber G, Haran G, Zhou H-X. Fundamental aspects of protein-protein association kinetics. Chem Rev. 2009;109:839–860. doi: 10.1021/cr800373w. [DOI] [PMC free article] [PubMed] [Google Scholar]
- 34.Koculi E, Hyeon C, Thirumalai D, Woodson SA. Charge density of divalent metal cations determines RNA stability. J Am Chem Soc. 2007;129:2676–2682. doi: 10.1021/ja068027r. [DOI] [PMC free article] [PubMed] [Google Scholar]
- 35.Hofmeister F. Zur Lehre von der Wirkung der Salze–Zweite Mittheilung. Arch für Exp Pathol und Pharmakologie. 1888;24:247–260. [Google Scholar]
- 36.Zhang Y, Cremer PS. Interactions between macromolecules and ions: The Hofmeister series. Curr Opin Chem Biol. 2006;10:658–663. doi: 10.1016/j.cbpa.2006.09.020. [DOI] [PubMed] [Google Scholar]
- 37.Gurau MC, et al. On the mechanism of the Hofmeister effect. J Am Chem Soc. 2004;126:10522–10523. doi: 10.1021/ja047715c. [DOI] [PubMed] [Google Scholar]
- 38.Zhang Y, Cremer PS. Chemistry of Hofmeister anions and osmolytes. Annu Rev Phys Chem. 2010;61:63–83. doi: 10.1146/annurev.physchem.59.032607.093635. [DOI] [PubMed] [Google Scholar]
- 39.Baldwin RL. How Hofmeister ion interactions affect protein stability. Biophys J. 1996;71:2056–2063. doi: 10.1016/S0006-3495(96)79404-3. [DOI] [PMC free article] [PubMed] [Google Scholar]
- 40.Lo Nostro P, Ninham BW. Hofmeister phenomena: An update on ion specificity in biology. Chem Rev. 2012;112:2286–2322. doi: 10.1021/cr200271j. [DOI] [PubMed] [Google Scholar]
- 41.Okur HI, et al. Beyond the Hofmeister series: Ion-specific effects on proteins and their biological functions. J Phys Chem B. 2017;121:1997–2014. doi: 10.1021/acs.jpcb.6b10797. [DOI] [PubMed] [Google Scholar]
- 42.Shammas SL, Crabtree MD, Dahal L, Wicky BIM, Clarke J. Insights into coupled folding and binding mechanisms from kinetic studies. J Biol Chem. 2016;291:6689–6695. doi: 10.1074/jbc.R115.692715. [DOI] [PMC free article] [PubMed] [Google Scholar]
- 43.Borcherds W, et al. Disorder and residual helicity alter p53-Mdm2 binding affinity and signaling in cells. Nat Chem Biol. 2014;10:1000–1002. doi: 10.1038/nchembio.1668. [DOI] [PubMed] [Google Scholar]
- 44.Alberts B, et al. Molecular Biology of the Cell. 2nd Ed Garland Publishing; New York: 1989. [Google Scholar]
- 45.Clapham DE. Calcium signaling. Cell. 2007;131:1047–1058. doi: 10.1016/j.cell.2007.11.028. [DOI] [PubMed] [Google Scholar]
- 46.Yancey PH, Clark ME, Hand SC, Bowlus RD, Somero GN. Living with water stress: Evolution of osmolyte systems. Science. 1982;217:1214–1222. doi: 10.1126/science.7112124. [DOI] [PubMed] [Google Scholar]
- 47.Stellwagen E, Prantner JD, Stellwagen NC. Do zwitterions contribute to the ionic strength of a solution? Anal Biochem. 2008;373:407–409. doi: 10.1016/j.ab.2007.10.038. [DOI] [PMC free article] [PubMed] [Google Scholar]
- 48.Muñoz V, Serrano L. Elucidating the folding problem of helical peptides using empirical parameters. III. Temperature and pH dependence. J Mol Biol. 1995;245:297–308. doi: 10.1006/jmbi.1994.0024. [DOI] [PubMed] [Google Scholar]
- 49.Vijayakumar M, et al. Electrostatic enhancement of diffusion-controlled protein-protein association: Comparison of theory and experiment on barnase and barstar. J Mol Biol. 1998;278:1015–1024. doi: 10.1006/jmbi.1998.1747. [DOI] [PubMed] [Google Scholar]
- 50.Ipsaro JJ, et al. Crystal structure and functional interpretation of the erythrocyte spectrin tetramerization domain complex. Blood. 2010;115:4843–4852. doi: 10.1182/blood-2010-01-261396. [DOI] [PMC free article] [PubMed] [Google Scholar]
- 51.Day CL, et al. Structure of the BH3 domains from the p53-inducible BH3-only proteins Noxa and Puma in complex with Mcl-1. J Mol Biol. 2008;380:958–971. doi: 10.1016/j.jmb.2008.05.071. [DOI] [PubMed] [Google Scholar]
- 52.Humphrey W, Dalke A, Schulten K. VMD: Visual molecular dynamics. J Mol Graph. 1996;14:33–38, 27–28. doi: 10.1016/0263-7855(96)00018-5. [DOI] [PubMed] [Google Scholar]
- 53.Gill SC, von Hippel PH. Calculation of protein extinction coefficients from amino acid sequence data. Anal Biochem. 1989;182:319–326. doi: 10.1016/0003-2697(89)90602-7. [DOI] [PubMed] [Google Scholar]
- 54.Shammas SL, Travis AJ, Clarke J. Remarkably fast coupled folding and binding of the intrinsically disordered transactivation domain of cMyb to CBP KIX. J Phys Chem B. 2013;117:13346–13356. doi: 10.1021/jp404267e. [DOI] [PMC free article] [PubMed] [Google Scholar]
- 55.Malatesta F. The study of bimolecular reactions under non-pseudo-first order conditions. Biophys Chem. 2005;116:251–256. doi: 10.1016/j.bpc.2005.04.006. [DOI] [PubMed] [Google Scholar]
- 56.Schreiber G, Fersht AR. Rapid, electrostatically assisted association of proteins. Nat Struct Biol. 1996;3:427–431. doi: 10.1038/nsb0596-427. [DOI] [PubMed] [Google Scholar]
- 57.Lacroix E, Viguera AR, Serrano L. Elucidating the folding problem of alpha-helices: Local motifs, long-range electrostatics, ionic-strength dependence and prediction of NMR parameters. J Mol Biol. 1998;284:173–191. doi: 10.1006/jmbi.1998.2145. [DOI] [PubMed] [Google Scholar]
- 58.Muñoz V, Serrano L. Development of the multiple sequence approximation within the AGADIR model of α-helix formation: Comparison with Zimm-Bragg and Lifson-Roig formalisms. Biopolymers. 1997;41:495–509. doi: 10.1002/(SICI)1097-0282(19970415)41:5<495::AID-BIP2>3.0.CO;2-H. [DOI] [PubMed] [Google Scholar]
- 59.Muñoz V, Serrano L. Elucidating the folding problem of helical peptides using empirical parameters. Nat Struct Biol. 1994;1:399–409. doi: 10.1038/nsb0694-399. [DOI] [PubMed] [Google Scholar]
- 60.Muñoz V, Serrano L. Elucidating the folding problem of helical peptides using empirical parameters. II. Helix macrodipole effects and rational modification of the helical content of natural peptides. J Mol Biol. 1995;245:275–296. doi: 10.1006/jmbi.1994.0023. [DOI] [PubMed] [Google Scholar]


