Significance
Metabolic reprogramming is one of the hallmarks of cancer. However, the underlying mechanisms that regulate cancer metabolism are poorly understood. Here we performed multiomics-based analysis of paired normal–tumor tissues from patients with colorectal cancer, which revealed that the protooncogene protein MYC regulated global metabolic reprogramming of colorectal cancer by modulating 215 metabolic reactions. Importantly, this metabolic reprogramming occurred in a manner not associated with specific gene mutations in colorectal carcinogenesis. For many years, small-molecule or biologic inhibitors of MYC have been required. Here we demonstrate that knockdown of MYC downstream pyrimidine synthesis genes contributes to the suppression of colorectal cancer cell proliferation similar to MYC, and thus pyrimidine synthesis pathways could be potential targets for colorectal cancer therapy.
Keywords: metabolomics, omics, metabolism, colorectal cancer, MYC
Abstract
Cancer cells alter their metabolism for the production of precursors of macromolecules. However, the control mechanisms underlying this reprogramming are poorly understood. Here we show that metabolic reprogramming of colorectal cancer is caused chiefly by aberrant MYC expression. Multiomics-based analyses of paired normal and tumor tissues from 275 patients with colorectal cancer revealed that metabolic alterations occur at the adenoma stage of carcinogenesis, in a manner not associated with specific gene mutations involved in colorectal carcinogenesis. MYC expression induced at least 215 metabolic reactions by changing the expression levels of 121 metabolic genes and 39 transporter genes. Further, MYC negatively regulated the expression of genes involved in mitochondrial biogenesis and maintenance but positively regulated genes involved in DNA and histone methylation. Knockdown of MYC in colorectal cancer cells reset the altered metabolism and suppressed cell growth. Moreover, inhibition of MYC target pyrimidine synthesis genes such as CAD, UMPS, and CTPS blocked cell growth, and thus are potential targets for colorectal cancer therapy.
One of the prominent characteristics of rapidly growing tumor cells is their capacity to sustain high rates of glycolysis for ATP generation irrespective of oxygen availability, termed the Warburg effect (1). Recent studies have shown that cancer cells shift metabolic pathways to facilitate the uptake and incorporation of abundant nutrients, such as glucose and glutamine (2, 3), into cell building blocks, such as nucleotides, amino acids, and lipids, that are essential for highly proliferating cells (4). This seems to be a universal characteristic of highly malignant tumors (5), independent of their carcinogenetic origin (6). Understanding how cancer cells reprogram metabolism can stimulate the development of new approaches in cancer therapy.
Although there is now substantial information about how these pathways are regulated, most existing studies on cancer metabolism have used in vitro cell lines. In addition to genetic and epigenetic alterations, altered tumor microenvironment (e.g., blood flow, oxygen and nutrient supply, pH distribution, redox state, and inflammation) plays a profound role in modulating tumor cell metabolism (7–9). Therefore, a systematic characterization of in vivo metabolic pathways was deemed necessary to understand how metabolic phenotypes are regulated in intact human tumors.
Here we applied multiomics-based approaches [i.e., metabolomics, target sequencing of cancer-related genes, transcriptomics, and methylated DNA immunoprecipitation sequencing (MeDIP-seq)] to paired normal and tumor tissues obtained from 275 patients with colorectal cancer (CRC) and uncovered the details of which factors contributed, and when they contributed, to metabolic reprogramming in colorectal cancer. The results were confirmed by analysis of colorectal tissue from Apc mutant mice and cancer cell lines.
Results
Multiomics Analyses of Tumor and Normal Tissue from CRC.
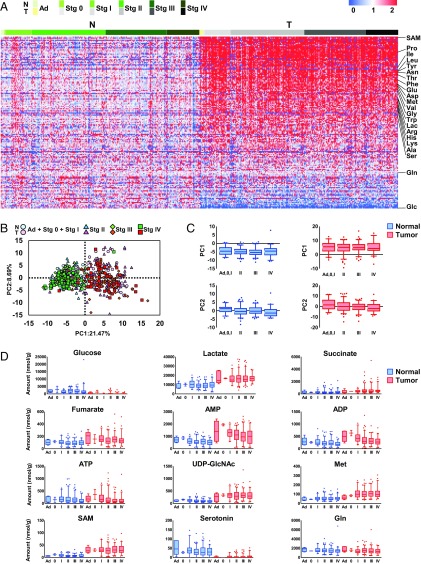
To explore the mechanisms that underlie the reprogramming of cancer cell metabolism, we performed capillary electrophoresis time-of-flight mass spectrometry-based metabolome profiling (10, 11) of paired tumor and normal tissue obtained from 275 patients with CRC (SI Appendix, Table S1). Significant differences in the levels of many metabolites were observed between normal tissues and tumor tissues (SI Appendix, Fig. S1). Unexpectedly, most of the changes were found in the adenoma stage, early in the adenoma–carcinoma sequence of CRC progression, and remained similar through all cancer stages (Fig. 1). S-adenosylmethionine (SAM), a methyl donor, was the most up-regulated metabolite in tumor tissue (Fig. 1A and SI Appendix, Fig. S1). Glucose was the second most decreased metabolite in tumor tissue, whereas lactate was increased (Fig. 1A and SI Appendix, Fig. S1), implying activation of glycolysis, termed the Warburg effect (1). Interestingly, every amino acid except glutamine, the main substrate in glutaminolysis, was significantly accumulated in tumor tissue (SI Appendix, Fig. S1).
Fig. 1.
Metabolite levels are altered at the adenoma stage of colorectal tumors. (A) Heat map of metabolite levels in paired normal and tumor tissues obtained from 275 patients with CRC. Each metabolite was normalized by dividing by the median of the normal tissue. Data colored in the red–white–blue scheme indicate a relatively higher, average, and lower concentration, respectively. Data are horizontally arranged by Union for International Cancer Control (UICC) cancer staging (seventh edition) and vertically arranged by the fold change in median values of paired tumor and normal tissue. N and T indicate normal and paired tumor tissues, respectively. Ad and Stg indicate adenoma and stage, respectively. (B) Score plots of principal component analysis of normal (green) and tumor colorectal tissue (red) based on metabolome data (n = 274 each). Samples were grouped by UICC cancer staging. (C and D) Comparison of metabolite levels in normal and tumor tissues (n = 274) at each stage (adenoma, n = 5; stage 0, n = 2; stage I, n = 36; stage II, n = 101; stage III, n = 85; and stage IV, n = 45). PCA of the PC1 and PC2 values for normal (blue) and tumor tissue (red) at each stage. Data outside the 5 and 95 percentiles were plotted as dots. Error bars represent standard deviation. (D) Levels of representative metabolites in normal and tumor tissues at each stage.
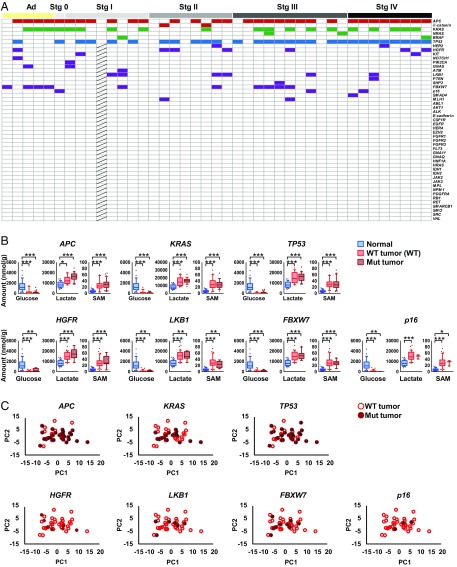
CRC progression is associated with mutations in oncogenes and tumor suppressor genes such as APC, KRAS, and TP53 (12). We applied next-generation and Sanger sequencing technologies to detect somatic mutations in cancer-related genes in the tumor tissue. The mutation frequencies in APC, TP53, and KRAS were 76, 68, and 46%, respectively (Fig. 2A), which are comparable to those in previous reports (13–15). Other mutations were found throughout the cancer stages, but these major mutations were not associated with metabolite levels in the CRC tissue (Fig. 2 B and C).
Fig. 2.
Colorectal cancer metabolic reprogramming occurs in a manner not associated with specific gene mutations involved in colorectal carcinogenesis. (A) Mutations in oncogenes and tumor suppressor genes (adenoma, n = 5; stage 0, n = 1; stage I, n = 8; stage II, n = 8; stage III, n = 11; and stage IV, n = 8). Mutated tissues are indicated as colored boxes. Hatched boxes indicate genes not determined. (B) The effect of major mutations on the levels of representative metabolites, namely glucose, lactate, and SAM. Although the levels of glucose, lactate, and SAM in normal and tumor tissues (n = 41) were significantly different, there were no significant differences between wild-type tumor tissue (red) and mutated tumor tissue (brick). (C) PCA of wild-type tumor tissue (open circles) and mutated tumor tissue (filled circles) based on metabolome data. Kruskal–Wallis and Dunn’s posttest (B). ***P < 0.001, **P < 0.01, and *P < 0.05.
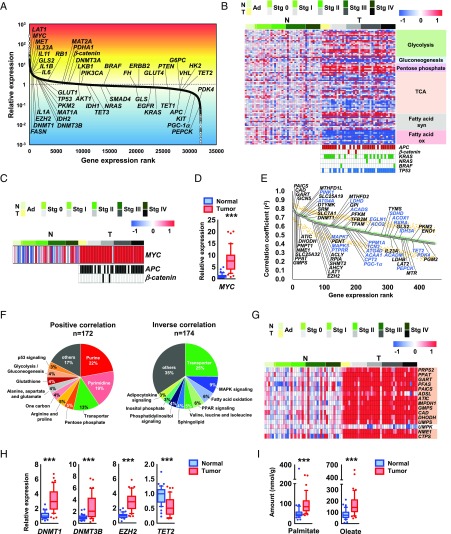
Next, we applied transcriptomic analysis to paired normal and tumor tissues and observed overexpression of LAT1, the protooncogene MYC, and inflammatory cytokine genes in CRC tissue (Fig. 3A). Similar to the metabolome data (Fig. 1A), the expression levels of metabolic genes were constant throughout the stages (Fig. 3B). Taken together with the results of our metabolomic and transcriptomic analysis, we propose that the metabolic shift occurs at the adenoma stage of CRC, although further validation on an independent and larger cohort of normal/CRC samples particularly at this earliest stage is necessary.
Fig. 3.
MYC regulates global metabolic reprogramming of colorectal cancer. (A) Ranking of genes expressed in colorectal tumor tissue compared with paired normal tissue. (B) Heat map of gene expression levels in metabolic pathways obtained from 41 paired normal and tumor colorectal tissues (Top) and mutations in APC, β-catenin, KRAS, NRAS, BRAF, and TP53 (Bottom Right). Mutated tissue samples are indicated as colored boxes. These samples were collected from 39 patients; of these, 2 patients provided one normal and two tumor samples at different disease stages. (C and D) Gene expression levels of MYC in normal and tumor colorectal tissues obtained by DNA microarray and the mutation status of APC and β-catenin at each cancer stage. Samples with mutations are depicted as filled boxes. (E) Ranking of metabolism-related genes that were positively (black) or inversely (blue) correlated with MYC expression (Spearman rank-order correlation coefficient: r2 > 0.4). Ranking (green) and median and 95% confidence intervals of bootstrap analyses of each rank (black and orange) are shown. (F) Genes involved in major metabolism in E were grouped into pathway categories based on the Kyoto Encyclopedia of Genes and Genomes (KEGG) database. (F, Left) A total of 172 metabolic reactions are regulated by 116 unique metabolic genes showing a positive correlation with MYC expression. (F, Right) A total of 174 metabolic reactions are regulated by 119 unique metabolic genes showing an inverse correlation with MYC. (G) Heat map of expression levels of metabolic genes involved in purine and pyrimidine biosynthesis pathways in normal and tumor colorectal tissue. Genes highlighted in orange have correlation coefficients (r2) greater than 0.4 for MYC. (H) DNA microarray analysis of the expression levels of genes involved in DNA methylation in normal and tumor colorectal tissue. (I) LC-MS/MS analysis of palmitate and oleate levels in normal (blue) and tumor (red) colorectal tissue (n = 44 each). The heat map data are presented as log2 value of the relative expression level (B, C, and G). The Wilcoxon signed-rank test was used to determine statistical significance (D, H, and I). ***P < 0.001.
Analyses of Tissue from Apc Mutant Mice.
Because human clinical samples are heterogeneous entities, we performed metabolome and DNA microarray analyses on normal and adenomatous tissue obtained from the large intestines of Apc+/Δ716 mice, a genetically engineered mouse model of familial adenomatous polyposis that develops benign adenomas in the intestines (16), and on normal tissue from wild-type C57BL/6N mice. Considerable differences were observed in metabolite levels (SI Appendix, Fig. S2 A and B) that correlated with those found in the CRC tissue (SI Appendix, Fig. S2C). The transcriptome data were also similar to the clinical samples, demonstrating abnormal expression of Myc and inflammatory cytokine genes in adenoma tissue (SI Appendix, Fig. S3).
Aberrant MYC Expression Correlates with Metabolic Reprogramming.
MYC is one of the most frequently deregulated oncogenes and is estimated to regulate the expression of 15% of all genes (17, 18), including various metabolic genes (19, 20). In cancerous cells, deregulation of MYC expression occurs via many mechanisms (19, 21). We found that MYC expression was up-regulated in all cancer stages, including adenomas, irrespective of the presence or absence of APC mutations (Fig. 3 C and D). We then explored metabolic genes that were correlatively expressed with MYC (Spearman rank-order correlation coefficient: r2 > 0.4) (Fig. 3E) and identified 231 unique metabolic genes (SI Appendix, Table S3). Consistently, partial correlation analysis showed no significant direct relationship between MYC and a specific metabolic gene (SI Appendix, Table S3). The results indicate that MYC expression is a highly correlated expression of a variety of metabolic genes.
The 231 genes were involved in a total of 346 metabolic reactions and included transporters in major metabolic pathways, including purine/pyrimidine synthesis, the pentose phosphate pathway, MAPK signaling pathway, and fatty acid oxidation pathway (Fig. 3F and SI Appendix, Table S3). Among them, almost all metabolic genes of the de novo purine/pyrimidine synthesis pathway were up-regulated, correlating with MYC expression (Fig. 3G and SI Appendix, Fig. S4 A and B). Several genes in the glycolysis and pentose phosphate pathways were up-regulated, whereas those in the TCA cycle were down-regulated with aberrant MYC expression (SI Appendix, Fig. S4C). Many genes involved in fatty acid synthesis were also up-regulated, while those participating in fatty acid oxidation were down-regulated in CRC tissue (SI Appendix, Fig. S4C).
One-carbon metabolism involving the folate and methionine cycles has attracted attention as a driver of oncogenesis (22). Nine one-carbon metabolism genes and three genes related to one-carbon transport, including SLC25A32 (mitochondrial folate transporter; MFT), SLC7A5 (LAT1), and SLC7A8 (LAT2), were highly expressed in conjunction with MYC expression (SI Appendix, Fig. S4C). In addition, MYC expression is likely to be associated with DNA and histone methylation activity through increases in one carbon-related metabolites and genes [i.e., SAM (Fig. 1A), DNMT1, DNMT3B (correlation coefficient with MYC: r2 = 0.309)] and histone-lysine N-methyltransferase enzyme (EZH2) and a decrease in TET2 DNA demethylase (Fig. 3H). Various genes involved in amino acid metabolism were also up- or down-regulated together with aberrant MYC expression (SI Appendix, Fig. S4C).
Consistent with the transcriptome data, we observed increased levels of lactate, the final product of glycolysis, and many metabolic intermediates in de novo purine and pyrimidine synthesis in the tumor tissues. In addition, most of the metabolites in one-carbon metabolism-related pathways, including serine, one-carbon and transsulfuration metabolism (SI Appendix, Fig. S1), and the products of fatty acid synthesis (i.e., palmitate and oleate) were significantly increased (Fig. 3I).
Aberrant MYC Expression Reduces Mitochondrial Homeostasis.
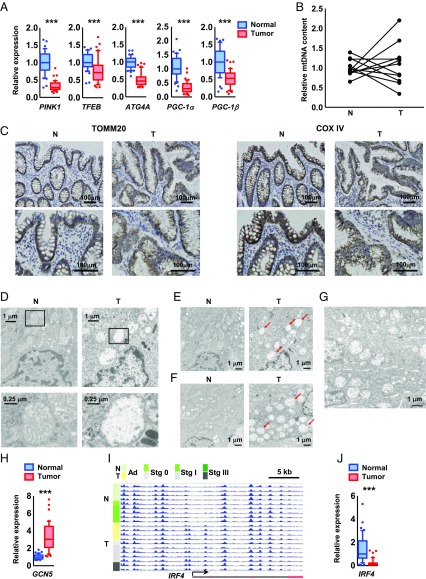
PINK1, a central regulator gene for mitochondrial maintenance, and a master autophagy regulator gene, TFEB (correlation coefficient with MYC: r2 = 0.367), demonstrated the highest inverse correlation with MYC (Figs. 3E and 4A), implying inhibition of mitophagy in tumor tissue. The expression of PGC-1α, a master regulator of mitochondrial biogenesis (23, 24), was also inversely correlated with MYC (Fig. 3E), and the expression levels of these genes were markedly reduced in tumor tissues (Fig. 4A).
Fig. 4.
MYC is involved in the transcriptional regulation of mitochondrial biosynthesis and maintenance. (A) DNA microarray analysis of the expression levels of PINK1, ATG4A, and PGC-1α and PGC-1β in normal (blue) and tumor (red) colorectal tissue. (B) The ratio of mitochondrial DNA (mtDNA) to nuclear DNA determined by qRT-PCR analysis of paired normal and tumor tissues obtained from 11 patients with CRC (adenoma, n = 2; stage I, n = 3; stage II, n = 2; stage III, n = 2; and stage IV, n = 2). (C) Immunohistochemistry for TOMM20 (a mitochondrial outer-membrane marker) and COX IV (a mitochondrial inner-membrane marker) of normal and tumor tissue samples obtained from a CRC patient in stage II. Sections were counterstained with hematoxylin. (Scale bars, 100 μm.) (D–G) TEM images of paired normal and tumor tissues obtained from a colorectal cancer patient at stage IIIb (D and E), stage II (F), and adenoma stage (G). (D, Lower) Higher magnification of boxed areas (Upper). Arrows indicate abnormal mitochondria. (H and J) DNA microarray analysis of the expression levels of GCN5 (H) and IRF4 (J) in normal and tumor colorectal tissues. (I) MeDIP-seq of the promoter region of the IRF4 gene, a transcription factor for PGC-1α in normal (n = 9) and tumor (n = 11) colorectal tissues. The promoter region of IRF4 was hypermethylated through the adenoma stage. The arrow, red boxes, and black lines indicate the transcription start site, exons, and introns, respectively. The Wilcoxon signed-rank test was used to assess statistical significance (A, H, and J). ***P < 0.001.
Although mitochondrial content was little altered (Fig. 4 B and C), transmission electron microscopy (TEM) revealed an accumulation of abnormal mitochondria in cancerous (Fig. 4 D–F) and adenomatous tissues (Fig. 4G), with severe mitochondrial swelling, disappearance of cristae, and matrix clearing. We found that the GCN5 acetyltransferase gene, a repressor of PGC-1α–regulated transcription (25), was highly expressed in tumor tissue (Fig. 4H). Alongside this the promoter region of the IRF4 gene (26), one of the transcription factors for PGC-1α, was hypermethylated (Fig. 4I) and thus had a decreased expression level (Fig. 4J), resulting in suppression of PGC-1α expression (Fig. 4A).
MYC Knockdown Resets Metabolism and Suppresses Cell Growth.
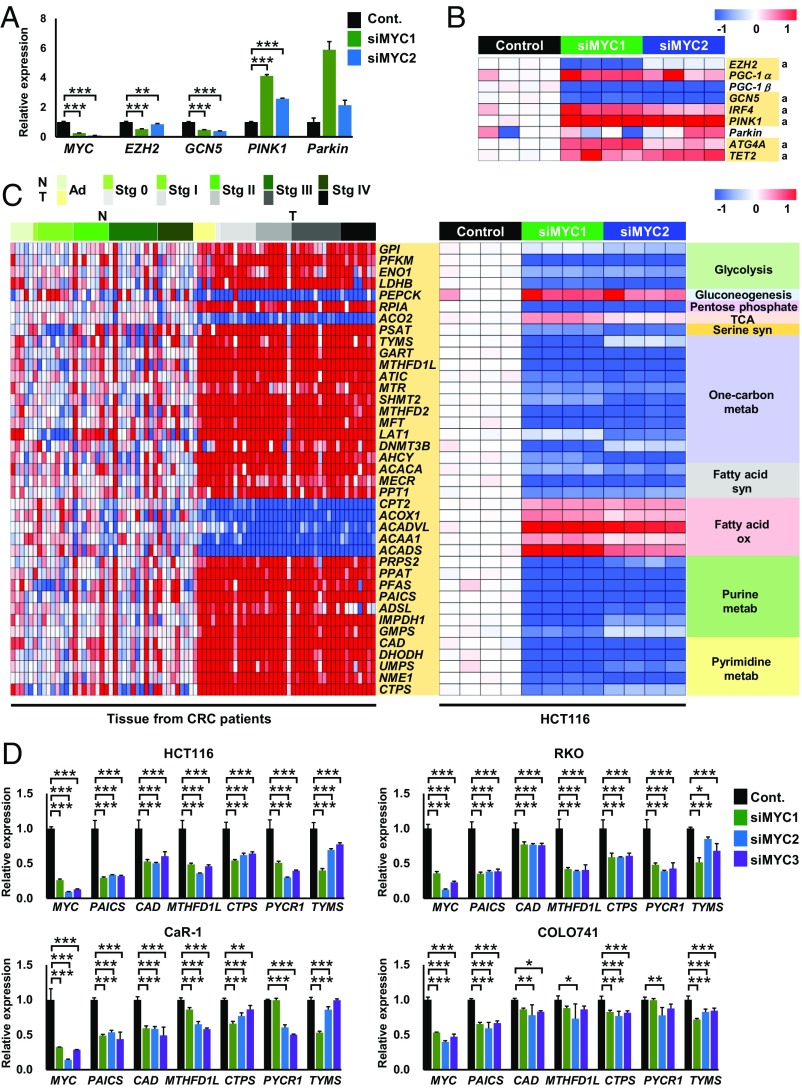
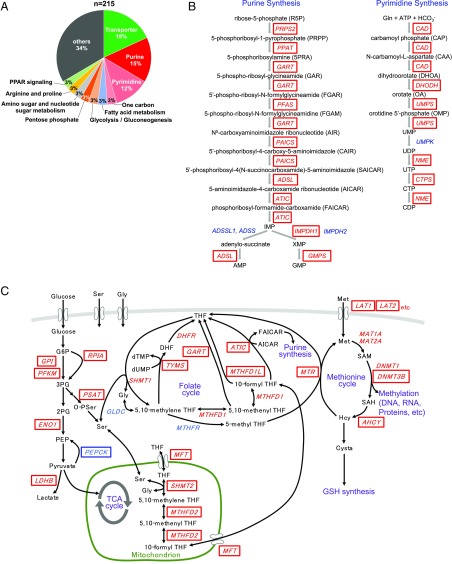
To further establish the role of MYC in metabolic reprogramming, we suppressed MYC expression by siRNA in the human colorectal cancer cell line (Fig. 5A). MYC knockdown dramatically changed the expression signatures of genes involved in major metabolic pathways, transporters, and mitochondrial biogenesis/maintenance, as well as those related to DNA and histone methylation (Fig. 5 and SI Appendix, Figs. S5 and S6). The levels of LAT1, LAT2, DNMT3B, and EZH2 decreased, while the level of TET2 was elevated in MYC-knockdown cells (Fig. 5 A and B and SI Appendix, Fig. S5B). The expression levels of most metabolic genes highly correlated with MYC in CRC tissue were reversed when MYC was inhibited by siRNAs in HCT116 human colorectal carcinoma cells (Fig. 5C and SI Appendix, Figs. S5A and S6), which indicates that almost all of these gene expressions are regulated by MYC. Overall, we found that MYC regulated at least 215 metabolic reactions in major metabolic pathways, including de novo purine/pyrimidine synthesis and one-carbon metabolism, controlling 121 metabolic genes and 39 transporters (Fig. 6 and SI Appendix, Table S3). Regarding glucose metabolism, aberrant MYC expression activated glycolysis through up-regulation of GPI, PFKM, ENO1, and LDHB (Figs. 5C and 6C and SI Appendix, Fig. S5A) and down-regulation of PEPCK expression (Figs. 5C and 6C and SI Appendix, Fig. S5A), the rate-limiting enzyme in gluconeogenesis, suggesting that MYC expression induces the Warburg effect.
Fig. 5.
Knockdown of MYC resets metabolic gene expression. (A) qRT-PCR analysis of MYC and its target metabolic genes in HCT116 cells transfected with control siRNA (Cont.) (n = 4) or MYC siRNAs (siMYC1 and siMYC2) (n = 4 each). (B) DNA microarray analysis of genes related to mitochondrial and epigenetic functions in HCT116 cells transfected with control siRNA (n = 4) or MYC siRNAs (n = 4 each). The genes highlighted in yellow exhibited changes in expression upon MYC knockdown in HCT116 cells that are opposite those in tumor tissue compared with normal tissue in CRC samples. “a” indicates a significant difference (P < 0.05) between the control and both MYC siRNAs. (C) DNA microarray analysis of metabolic genes in 41 paired normal and tumor tissues obtained from CRC patients (Left) and HCT116 cells transfected with control siRNA (n = 4) or MYC siRNAs (n = 4 each) (Right). (D) qRT-PCR analysis of MYC and its target genes in HCT116, RKO, CaR-1, and COLO741 cells transfected with control siRNA (Cont.) (n = 4) or MYC siRNAs (siMYC1, siMYC2, and siMYC3) (n = 4 each). The heat map data are presented as log2 value of the relative expression level (B and C). ANOVA and a Dunnett post hoc test (A and D) were used to determine statistical significance. ***P < 0.001, **P < 0.01, and *P < 0.05.
Fig. 6.
Schematic overview of MYC-mediated metabolic pathways. (A) A total of 215 major metabolic reactions are regulated by MYC expression through 160 unique target metabolic genes. (B) Almost all metabolic genes (in red boxes) involved in de novo purine and pyrimidine synthesis are regulated by MYC. (C) Metabolic genes (enclosed in boxes) involved in glycolysis, the pentose phosphate pathway, gluconeogenesis, serine synthesis, and one-carbon metabolism, including the folate and methionine cycles, are regulated by MYC. Metabolic genes in red boxes were up-regulated, whereas PEPCK (in a blue box) was down-regulated by MYC expression.
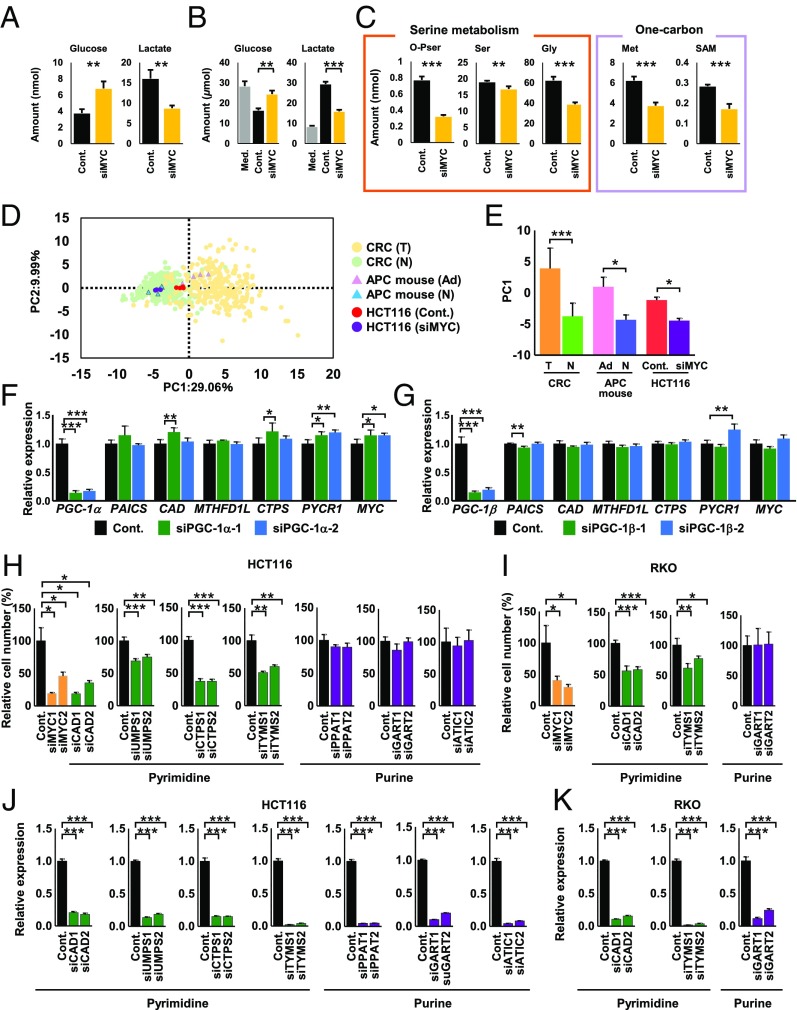
Subsequently, we analyzed changes in intra- and extracellular metabolite levels between control and MYC-knockdown HCT116 cells. When MYC was suppressed, intra- and extracellular glucose levels increased, while lactate levels decreased (Fig. 7 A and B); this pattern is known as the “reverse Warburg effect.” Additionally, the levels of many metabolic intermediates were consistently decreased in MYC-knockdown HCT116 cells, including those involved in serine synthesis, one-carbon metabolism (Fig. 7C), the start of de novo purine/pyrimidine metabolism, and amino acid metabolism (SI Appendix, Fig. S7). However, several metabolites, such as 3PG, citrate, Asp, Gln, and Pro, showed inconsistent patterns (SI Appendix, Figs. S1 and S7). A recent study demonstrated that bacterial communities were different between normal and CRC tissues (27). This different microbe composition might be associated with the inconsistent results of the metabolites. Principal component analysis (PCA) showed that the metabolic profiles of CRC tumor tissue, Apc+/Δ716 adenomatous tissue, and HCT116 cells were similarly shifted toward the positive PC1 direction (Fig. 7 D and E). Taken together, these results suggest an essential role for MYC in metabolic reprogramming through the regulation of important metabolic genes.
Fig. 7.
Knockdown of MYC resets altered metabolism and suppresses cell growth. (A) Amounts of glucose and lactate in HCT116 cells transfected with control siRNA (Cont.) or MYC siRNA (n = 4 each). (B) Amounts of extracellular glucose and lactate in medium without cells (Med.) and with HCT116 cells transfected with control siRNA or MYC siRNA (n = 4 each). (C) Metabolomic analysis of metabolic intermediates involved in serine- and one-carbon metabolism in HCT116 cells transfected with control siRNA or MYC siRNA (n = 4 each). (D) Score plots of PCA of the metabolome data from the indicated samples. CRC (T): CRC tumor tissue; CRC (N): CRC normal tissue; APC mouse (Ad): Apc+/Δ716 mouse adenoma tissue; APC mouse (N): Apc+/Δ716 mouse normal tissue; HCT116 (Cont.): HCT116 cells transfected with a control siRNA; and HCT116 (siMYC): HCT116 cells transfected with a MYC siRNA. (E) PC1 values for each sample. (F and G) qRT-PCR analysis of metabolic genes in CCD841 CoN cells transfected with control siRNA, PGC-1α siRNAs (siPGC-1α-1 and siPGC-1α-2) (F), or PGC-1β siRNAs (siPGC-1β-1 and siPGC-1β-2) (G) (n = 4 each). (H and I) Relative number of HCT116 (H) and RKO (I) cells transfected with control siRNA, MYC siRNAs, CAD siRNAs (siCAD1 and siCAD2), UMPS siRNAs (siUMPS1 and siUMPS2), TYMS siRNAs (siTYMS1 and siTYMS2), PPAT siRNAs (siPPAT1 and siPPAT2), GART siRNAs (siGART1 and siGART2), or ATIC siRNAs (siATIC1 and siATIC2) and grown for 3 d (n = 4 each). The data were normalized by dividing by the average cell number of the control. (J and K) qRT-PCR analysis was performed to assess knockdown efficiency of each gene in HCT116 (J) and RKO (K) cells transfected with the indicated siRNAs (n = 4 each). Student’s t test and Bonferroni correction (A–C and H–K) were used to determine statistical significance. Mann–Whitney test was used for mouse tissue and cultured cell data, and Wilcoxon signed-rank test was used for human tissue data (D and E). One-way analysis of variance and Dunnett (F and G). ***P < 0.001, **P < 0.01, and *P < 0.05.
As described above, PGC-1α (28) and PGC-1β (29), MYC target genes, have been proposed to be master regulators of cancer metabolism (24, 30). We therefore investigated the possible involvement of PGC-1α and PGC-1β in global regulation of colorectal cancer metabolism. However, knockdown of PGC-1α and PGC-1β caused little alteration in metabolic gene expression in a colorectal normal cell line (Fig. 7 F and G), leading us to conclude that MYC is the master regulator of colorectal metabolism. Knockdown of MYC considerably reduced growth of HCT116 and RKO human colon carcinoma cells (Fig. 7 H–K). Moreover, we investigated several MYC downstream metabolic genes (SI Appendix, Table S3) and observed that in addition to TYMS, a target enzyme of 5-fluorouracil (Fig. 6C), knockdown of pyrimidine synthesis genes such as CAD, the rate-limiting enzyme in de novo pyrimidine synthesis, UMPS, and CTPS (Fig. 6B) blocked HCT116 and RKO cell proliferation (Fig. 7 H–K). However, knockdown of purine synthesis genes such as PPAT, the rate-limiting enzyme in de novo purine synthesis, GART, and ATIC (Fig. 6B) had no significant effect on their proliferation (Fig. 7 H–K).
Discussion
Our multiomics analyses of paired normal and tumor tissues from patients with CRC and tissues from Apc mutant mice highlight the critical role of MYC in reprogramming CRC tissue metabolism. We obtained clear evidence that MYC regulates global metabolic reprogramming of colorectal tumor metabolism through the modulation of 215 major metabolic reactions, controlling 121 metabolic genes and 39 transporters (SI Appendix, Table S3), and facilitates production of cellular building blocks. MYC also reprograms several cellular processes, including those modulating mitophagy and DNA/histone methylation. Knockdown of MYC in colorectal cancer cells can reset the altered metabolism and suppress cell growth. MYC can drive cell proliferation, and our current data alone may not formally exclude the possibility that MYC indirectly regulates the metabolic genes through its effect on proliferation. However, MYC has been demonstrated to directly control transcription of various key metabolic genes, including LDH-A and CAD (31, 32). We thus propose that MYC is the master regulator of colorectal tumor metabolism and an attractive therapeutic target.
MYC is a target gene of the Wnt signaling pathway, and thus MYC overexpression was caused by APC or β-catenin mutations in most of the colorectal tumor tissues (Fig. 3C). However, interestingly, elevated MYC expression occurred even without these mutations (Fig. 3C). In addition to Wnt signaling, MYC deregulation in cancer has been as a consequence of several abnormalities, including gross genetic abnormalities and aberrant activity of transcriptional factors, PI3K/AKT/mTOR signaling pathways, receptor tyrosine kinases, hormones, and growth factors (19, 21). Therefore, we speculate that these factors may induce MYC expression, resulting in metabolic reprogramming of colorectal cancer metabolism.
Here we propose that a sufficient nutrient supply in the precancerous stage may be indispensable for cancer development and growth. These findings may have implications for future cancer prevention and therapeutic approaches targeting MYC-regulated metabolism. Unfortunately, however, finding small-molecule or biologic inhibitors of MYC has proved difficult because MYC is localized within the nucleus and does not have a deep surface-binding pocket (33). Therefore, MYC is not amenable to blockade by small molecules or accessible to neutralization by antibodies.
Here we have demonstrated that knockdown of MYC or MYC target pyrimidine synthesis genes such as CAD, UMPS, and CTPS, but not purine synthesis genes, can suppress colorectal cancer cell proliferation (Fig. 7 H–K). This provides the foundation for a potential anticancer strategy in which pyrimidine synthesis pathways downstream of MYC could be an alternative target for colorectal cancer therapy.
Materials and Methods
Clinical Samples.
We conducted all experiments according to a study protocol approved by the Institutional Ethics Committee of Kagawa University (Heisei 24-040) upon obtaining informed consent from all subjects. The tumor and surrounding grossly normal-appearing tissue were obtained from 275 colorectal cancer patients at the time of surgery. The normal tissues were obtained from colorectal mucosa. Regarding the tumor tissues, to minimize the effect of other cells, we excluded CRC tissues with excessive stroma or infiltrating lymphocytes using hematoxylin-eosin staining. Clinicopathological information is listed in SI Appendix, Table S1.
Mouse Strains.
Construction of an Apc+/Δ716 strain has been described previously (34). The strain was backcrossed to the C57BL/6N background for >20 generations. C57BL/6N mice were purchased from CLEA Japan. Mice were kept under a 12-hour light–dark cycle at ∼22 °C and fed ad libitum with a CLEA CE-2 chow diet. All animal experiments were conducted according to protocols approved by the Animal Care and Use Committee of the Aichi Cancer Center Research Institute.
Supplementary Material
Acknowledgments
We thank Kumi Suzuki for technical assistance, and Dr. Josephine Galipon for critical reading and English editing of the manuscript. This work was partially supported by AMED-CREST from the Japan Agency for Medical Research and Development (AMED) (S.Y., M.A., and T.S.), a research program of the Project for Development of Innovative Research on Cancer Therapeutics (P-Direct) and AMED (K.O. and T.S.), as well as research funds from the Yamagata prefectural government and the City of Tsuruoka.
Footnotes
The authors declare no conflict of interest.
This article is a PNAS Direct Submission.
Data deposition: The data reported in this paper have been deposited in the Gene Expression Omnibus (GEO) database, https://www.ncbi.nlm.nih.gov/geo (accession nos. GSE89076, GSE89077, and GSE87693).
This article contains supporting information online at www.pnas.org/lookup/suppl/doi:10.1073/pnas.1710366114/-/DCSupplemental.
References
- 1.Warburg O. On the origin of cancer cells. Science. 1956;123:309–314. doi: 10.1126/science.123.3191.309. [DOI] [PubMed] [Google Scholar]
- 2.Metallo CM, et al. Reductive glutamine metabolism by IDH1 mediates lipogenesis under hypoxia. Nature. 2011;481:380–384. doi: 10.1038/nature10602. [DOI] [PMC free article] [PubMed] [Google Scholar]
- 3.Gao P, et al. c-Myc suppression of miR-23a/b enhances mitochondrial glutaminase expression and glutamine metabolism. Nature. 2009;458:762–765. doi: 10.1038/nature07823. [DOI] [PMC free article] [PubMed] [Google Scholar]
- 4.Vander Heiden MG, Cantley LC, Thompson CB. Understanding the Warburg effect: The metabolic requirements of cell proliferation. Science. 2009;324:1029–1033. doi: 10.1126/science.1160809. [DOI] [PMC free article] [PubMed] [Google Scholar]
- 5.Hanahan D, Weinberg RA. Hallmarks of cancer: The next generation. Cell. 2011;144:646–674. doi: 10.1016/j.cell.2011.02.013. [DOI] [PubMed] [Google Scholar]
- 6.Bustamante E, Morris HP, Pedersen PL. Energy metabolism of tumor cells. Requirement for a form of hexokinase with a propensity for mitochondrial binding. J Biol Chem. 1981;256:8699–8704. [PubMed] [Google Scholar]
- 7.Dang CV, Hamaker M, Sun P, Le A, Gao P. Therapeutic targeting of cancer cell metabolism. J Mol Med (Berl) 2011;89:205–212. doi: 10.1007/s00109-011-0730-x. [DOI] [PMC free article] [PubMed] [Google Scholar]
- 8.Hsu PP, Sabatini DM. Cancer cell metabolism: Warburg and beyond. Cell. 2008;134:703–707. doi: 10.1016/j.cell.2008.08.021. [DOI] [PubMed] [Google Scholar]
- 9.Jessani N, et al. Carcinoma and stromal enzyme activity profiles associated with breast tumor growth in vivo. Proc Natl Acad Sci USA. 2004;101:13756–13761. doi: 10.1073/pnas.0404727101. [DOI] [PMC free article] [PubMed] [Google Scholar]
- 10.Soga T, et al. Quantitative metabolome analysis using capillary electrophoresis mass spectrometry. J Proteome Res. 2003;2:488–494. doi: 10.1021/pr034020m. [DOI] [PubMed] [Google Scholar]
- 11.Soga T, et al. Differential metabolomics reveals ophthalmic acid as an oxidative stress biomarker indicating hepatic glutathione consumption. J Biol Chem. 2006;281:16768–16776. doi: 10.1074/jbc.M601876200. [DOI] [PubMed] [Google Scholar]
- 12.Terzic J, Grivennikov S, Karin E, Karin M. Inflammation and colon cancer. Gastroenterology. 2010;138:2101–2114 .e5. doi: 10.1053/j.gastro.2010.01.058. [DOI] [PubMed] [Google Scholar]
- 13.Miyoshi Y, et al. Somatic mutations of the APC gene in colorectal tumors: Mutation cluster region in the APC gene. Hum Mol Genet. 1992;1:229–233. doi: 10.1093/hmg/1.4.229. [DOI] [PubMed] [Google Scholar]
- 14.Sahin IH, et al. Rare though not mutually exclusive: A report of three cases of concomitant KRAS and BRAF mutation and a review of the literature. J Cancer. 2013;4:320–322. doi: 10.7150/jca.3619. [DOI] [PMC free article] [PubMed] [Google Scholar]
- 15.Soong R, et al. Prognostic significance of TP53 gene mutation in 995 cases of colorectal carcinoma. Influence of tumour site, stage, adjuvant chemotherapy and type of mutation. Eur J Cancer. 2000;36:2053–2060. doi: 10.1016/s0959-8049(00)00285-9. [DOI] [PubMed] [Google Scholar]
- 16.Kitamura T, et al. SMAD4-deficient intestinal tumors recruit CCR1+ myeloid cells that promote invasion. Nat Genet. 2007;39:467–475. doi: 10.1038/ng1997. [DOI] [PubMed] [Google Scholar]
- 17.Walz S, et al. Activation and repression by oncogenic MYC shape tumour-specific gene expression profiles. Nature. 2014;511:483–487. doi: 10.1038/nature13473. [DOI] [PMC free article] [PubMed] [Google Scholar]
- 18.Dang CV. MYC on the path to cancer. Cell. 2012;149:22–35. doi: 10.1016/j.cell.2012.03.003. [DOI] [PMC free article] [PubMed] [Google Scholar]
- 19.Stine ZE, Walton ZE, Altman BJ, Hsieh AL, Dang CV. MYC, metabolism, and cancer. Cancer Discov. 2015;5:1024–1039. doi: 10.1158/2159-8290.CD-15-0507. [DOI] [PMC free article] [PubMed] [Google Scholar]
- 20.Liu YC, et al. Global regulation of nucleotide biosynthetic genes by c-Myc. PLoS One. 2008;3:e2722. doi: 10.1371/journal.pone.0002722. [DOI] [PMC free article] [PubMed] [Google Scholar]
- 21.Meyer N, Penn LZ. Reflecting on 25 years with MYC. Nat Rev Cancer. 2008;8:976–990. doi: 10.1038/nrc2231. [DOI] [PubMed] [Google Scholar]
- 22.Locasale JW. Serine, glycine and one-carbon units: Cancer metabolism in full circle. Nat Rev Cancer. 2013;13:572–583. doi: 10.1038/nrc3557. [DOI] [PMC free article] [PubMed] [Google Scholar]
- 23.Jäger S, Handschin C, St-Pierre J, Spiegelman BM. AMP-activated protein kinase (AMPK) action in skeletal muscle via direct phosphorylation of PGC-1alpha. Proc Natl Acad Sci USA. 2007;104:12017–12022. doi: 10.1073/pnas.0705070104. [DOI] [PMC free article] [PubMed] [Google Scholar]
- 24.LeBleu VS, et al. PGC-1alpha mediates mitochondrial biogenesis and oxidative phosphorylation in cancer cells to promote metastasis. Nat Cell Biol. 2014;16:992–1003. doi: 10.1038/ncb3039. [DOI] [PMC free article] [PubMed] [Google Scholar]
- 25.Lerin C, et al. GCN5 acetyltransferase complex controls glucose metabolism through transcriptional repression of PGC-1alpha. Cell Metab. 2006;3:429–438. doi: 10.1016/j.cmet.2006.04.013. [DOI] [PubMed] [Google Scholar]
- 26.Wang L, Yao ZQ, Moorman JP, Xu Y, Ning S. Gene expression profiling identifies IRF4-associated molecular signatures in hematological malignancies. PLoS One. 2014;9:e106788. doi: 10.1371/journal.pone.0106788. [DOI] [PMC free article] [PubMed] [Google Scholar]
- 27.Dejea CM, et al. Microbiota organization is a distinct feature of proximal colorectal cancers. Proc Natl Acad Sci USA. 2014;111:18321–18326. doi: 10.1073/pnas.1406199111. [DOI] [PMC free article] [PubMed] [Google Scholar]
- 28.Sancho P, et al. MYC/PGC-1α balance determines the metabolic phenotype and plasticity of pancreatic cancer stem cells. Cell Metab. 2015;22:590–605. doi: 10.1016/j.cmet.2015.08.015. [DOI] [PubMed] [Google Scholar]
- 29.Zhang H, et al. HIF-1 inhibits mitochondrial biogenesis and cellular respiration in VHL-deficient renal cell carcinoma by repression of C-MYC activity. Cancer Cell. 2007;11:407–420. doi: 10.1016/j.ccr.2007.04.001. [DOI] [PubMed] [Google Scholar]
- 30.D’Errico I, et al. Peroxisome proliferator-activated receptor-gamma coactivator 1-alpha (PGC1alpha) is a metabolic regulator of intestinal epithelial cell fate. Proc Natl Acad Sci USA. 2011;108:6603–6608. doi: 10.1073/pnas.1016354108. [DOI] [PMC free article] [PubMed] [Google Scholar]
- 31.Shim H, et al. c-Myc transactivation of LDH-A: Implications for tumor metabolism and growth. Proc Natl Acad Sci USA. 1997;94:6658–6663. doi: 10.1073/pnas.94.13.6658. [DOI] [PMC free article] [PubMed] [Google Scholar]
- 32.Miltenberger RJ, Sukow KA, Farnham PJ. An E-box-mediated increase in cad transcription at the G1/S-phase boundary is suppressed by inhibitory c-Myc mutants. Mol Cell Biol. 1995;15:2527–2535. doi: 10.1128/mcb.15.5.2527. [DOI] [PMC free article] [PubMed] [Google Scholar]
- 33.Gu L, et al. The mechanism by which MYCN amplification confers an enhanced sensitivity to a PCNA-derived cell permeable peptide in neuroblastoma cells. EBioMedicine. 2015;2:1923–1931. doi: 10.1016/j.ebiom.2015.11.016. [DOI] [PMC free article] [PubMed] [Google Scholar]
- 34.Oshima M, et al. Loss of Apc heterozygosity and abnormal tissue building in nascent intestinal polyps in mice carrying a truncated Apc gene. Proc Natl Acad Sci USA. 1995;92:4482–4486. doi: 10.1073/pnas.92.10.4482. [DOI] [PMC free article] [PubMed] [Google Scholar]
Associated Data
This section collects any data citations, data availability statements, or supplementary materials included in this article.


