Abstract
The process of protein folding is obviously driven by forces exerted on the atoms of the amino-acid chain. These forces arise from interactions with other parts of the protein itself (Direct forces), as well as from interactions with the solvent (Solvent-Induced forces). We present a statistical-mechanical formalism that describes both these Direct and indirect, Solvent-Induced thermodynamic forces on groups of the protein. We focus on two kinds of protein groups, commonly referred to as hydrophobic and hydrophilic. Analysis of this result leads to the conclusion that the forces on hydrophilic groups are in general stronger than on hydrophobic groups. This is then tested and verified by a series of molecular dynamics simulations, examining both hydrophobic alkanes of different sizes and hydrophilic moieties represented by polar-neutral hydroxyl groups. The magnitude of the force on assemblies of hydrophilic groups is dependent on their relative orientation: with two to four times larger forces on groups that are able to form one or more direct hydrogen bonds.
Keywords: Hydrophobic and hydrophilic forces and interactions, Protein folding
Graphical Abstract
Introduction
Ever since it was discovered that the denaturation of proteins could be reversed without auxiliary agents, the “Protein Folding Problem” became one of the major unsolved challenges in molecular biology.1–4 There are essentially three main problems associated with protein folding.4 The first is to understand why and how proteins can rapidly fold to their native 3D structures. The second is to understand the factors that confer thermodynamic stability to the native structure. And the third is to be able to predict the 3D structure of the protein from its amino acid sequence. For over 80 years these questions have challenged chemists, biochemists, and physicists, who have developed a variety of theories and models from an extensive range of both wet-lab and computer experiments.5–7 In this paper we focus only on the first question, which is related to the so-called “Levinthal paradox.”2,3,8 The second and third questions, as well as their answers, have been discussed in a recent article9 and in two monographs.4,10
Assuming that a protein chain “walks” randomly in configurational space, Levinthal2,3 quickly estimated that it would take eons to reach the native structure. Of course, this runs contrary to the experimental fact that proteins fold on the order of seconds. This contradiction is known as the Levinthal Paradox. However, Levinthal did not consider this a paradox. He correctly concluded that the very assumption of a random walk is not valid. He provided the plausible answer that: “we feel that protein folding is speeded and guided by the rapid formation of local interactions, which then determine the further folding of the peptide.”2 Thus, although Levinthal’s answer was essentially correct, it begged for details. He did not specify how the interactions “speeded” and “guided” the protein folding, nor did he specify what those “local interactions” are. Unfortunately, there exists some confusion regarding what is exactly meant by “interactions.” Certainly, it must be forces exerted on the various protein groups that “speed” and “guide” the folding to its unique 3D structure. These forces arise from the gradients of the Potential of Mean Force (PMF) or free energy, which is often what is meant by “interactions.” While these concepts are sometimes used interchangeably, the forces are what cause the folding of the protein, and the interactions are what maintain the stability of the native structure. Of course, one can have strong interactions giving rise to weak forces, and vice versa.9,10
Interestingly, the understanding of what these forces and interactions are, and the underlying physics, has changed considerably over the scientific history of protein structure.11 Early studies on the denaturation12,13 and structure14–17 of proteins concluded that hydrogen bonds, with an energy of 5–6 kcal/mol, are the dominant factors.18 However, this view came to be questioned by a new series of thermodynamic experiments with denaturants.19–21 It was reasoned that the strength of a hydrogen bond among a donor and acceptor in a protein is effectively weakened by the formation of competing hydrogen bonds with solvent water molecules, and thus does not contribute significantly to the “driving force.” This concept was eventually encapsulated as the HB-inventory argument,22,23 which counts the number of hydrogen bonds on each side of a stoichiometric equation. Having dispensed with hydrogen bonds, the concept of the hydrophobic effect applied to proteins21 became the new dominant factor. This was inferred from the large negative free energies observed for the transfer of non-polar solutes from water to organic solvent, and that in native protein structures the non-polar amino acid sidechains tend to be buried in the core, sequestered from the aqueous environment. This view holds strong today, having been enshrined in many textbooks. While the hydrophobic effect certainly exists, the conclusion of its dominancy became questioned by a careful analysis of the statistical thermodynamics of the functional groups of protein systems.24,25 First it was shown that the formalism of the HB-inventory argument does not accurately represent the physical system, and that rather than inconsequential, an intra-protein hydrogen bond is estimated to contribute up to 1.5 kcal/mol to the stability.26 Second, it was demonstrated that the burial of a non-polar amino acid sidechain into the core of a protein is not physically equivalent to the partition of hydrophobic solutes between water and organic solvent, and that the energetic contribution is estimated to be significantly smaller.27,28 What followed was a long, communal effort of thermodynamic studies employing multiple modalities, and often with contradictory conclusions, to establish the relative importance of hydrogen bonding and the hydrophobic effect to protein structure (see 29 for a recent review). There now seems to be ample experimental and computational evidence that hydrogen bonding, both intra-protein and with solvent water molecules, contributes at least as much as the hydrophobic effect to structural stability.30–35
It must be observed that what the thermodynamic experiments are ultimately measuring is the stability of some “folded” state of a protein relative to some “unfolded” state. In this context, the term “driving force” refers only to a favorable change in free energy (e.g. ΔG < 0). Unfortunately, thermodynamic experiments do not provide any direct information about the physical mechanisms at the atomic level that cause the change from one protein state to another. To understand protein folding it is crucial to know the forces on all the atoms throughout the process36. Of course, these forces arise from other atoms of the protein and from the solvent molecules. Rather than each atom separately, it is convenient to consider the hydrophobic and hydrophilic functional groups of the protein, which we designate HϕO and HϕI, respectively. Examples of HϕO groups would be any aliphatic sidechain, and of HϕI groups would be any formally charged of polar-neutral moiety (e.g. OH, CO and NH). Using the statistical mechanics formalism of Solvation Thermodynamics, it was concluded that HϕI forces are probably the most important factors in determining the speed of the protein folding process,27,28,37–39 as well as protein-protein association and molecular recognition.27,39 This has been supported, at least for the cases of the association of pairs of HϕO groups and HϕI groups orientated to form simultaneous hydrogen bonds to a bridging water molecule, by Molecular Dynamics simulations40–42. This current study is an extension of those earlier Molecular Dynamics ones, comparing pairs of HϕO groups of larger sizes, and larger assemblies of HϕI groups in configurations for both water bridges and direct hydrogen bonding.
Theoretical background
To investigate the forces exerted on each group of a protein we start with the fundamental relationship of the Helmholtz energy (A) and the statistical mechanical partition function (Q) in the canonical ensemble,25,43
| (1) |
where T is the temperature, V is the volume, NT is the total number of entities and kB is the Boltzmann constant. We now consider the general case of a protein in a box of water molecules. The protein is considered to be composed of M parts, which can be taken to be the individual atoms or functional groups (such as amides, methyls, hydroxyls, etc.). The conformation of the protein is denoted by RM, which is the collection of all the position vectors (R1, R2, R3, …, RM). The box is taken to be filled with N water molecules with configuration XN = (X1, X2, X3, …, XN), where Xi represents both a position and orientation of the ith water molecule. For any given fixed conformation of the protein the partition function of the entire system can be written as:
| (2) |
where β = (kBT)−1, and C is a factor that includes N! as well as the momentum partition functions of the water molecules. Finally, the term U(RM, XN) in (2) represents the potential, interaction energy among all atoms and/or molecules of the system (including both the protein and water molecules). Note that the integral is only over the different configurations of the water molecules (XN); the conformation of the protein is assumed to be fixed. Assuming pairwise additivity, the total interaction energy can be conveniently separated into the following terms:
| (3) |
where U(RM) is the interaction energy among all groups of the protein, U(XN) is the interaction among all the water molecules and B(RM−XN) is the binding energy of the protein to all the water molecules.
As in classical mechanics, where the force on a particle is defined by the gradient of its potential energy, the thermodynamic force on any part of the solvated protein can be calculated from the derivative of the thermodynamic energy of the system with respect to an infinitesimal change in conformation of that part (dRi). Thus, with the rest of the protein (RM−i) fixed, the thermodynamic force on any specific group Ri is defined by the following expression:25,43
| (4) |
where ∇i is the partial gradient operator for Ri, and all the factors included in C are assumed independent of Ri. Simplification of ∇iU(RM, XN) in the numerator of the last equality can be achieved by first separating out Ri in (3) as follows:
| (5) |
where U(Ri−RM−i) is the total interaction energy of Ri with the rest of the groups of the protein, U(RM−i) is the interaction energy of the rest of the protein, and B(Ri−XN) and B(RM−i −XN) are respectively the binding energies of Ri and RM−i to all the water molecules being at a specific configuration XN. Finally, substitution of (3) and (5) into (4) allows for greater simplification (note that this simplification is achieved because the gradient ∇i operates on Ri only. For more details on the derivation see References 25 and 43):
| (6) |
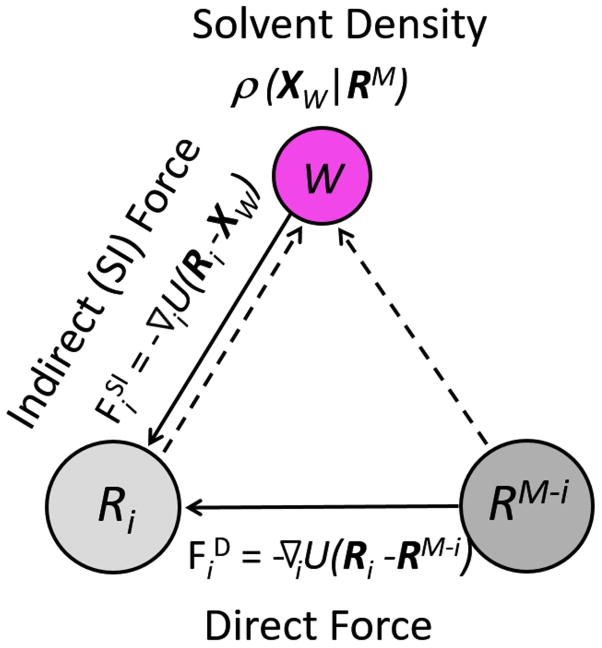
where P(XN|RM) is the normalized conditional probability of obtaining any particular configuration of the water molecules XN given the fixed protein conformation RM, and the angled brackets indicate the conditional average value of the enclosed function obtained by integrating over all water configurations XN. Thus, we see that the thermodynamic force on the ith group of the protein results from two separate effects: 1) the Direct force , which is due to all the other groups of the protein (in the absence of the solvent), and 2) the indirect, Solvent-Induced force , which is the conditional force exerted by the water molecules given a fixed conformation of the protein. Taking into account the indistinguishability of the water molecules, the solvent-induced force can be expressed in an alternate form that provides a clearer physical interpretation (see References 4, 25 & 43 for the derivation) (note: we use B for binding either a group or the whole protein to all water molecules, and U(Ri−Xw) for the pair interaction between group i at Ri and a water molecule at Xw):
| (7) |
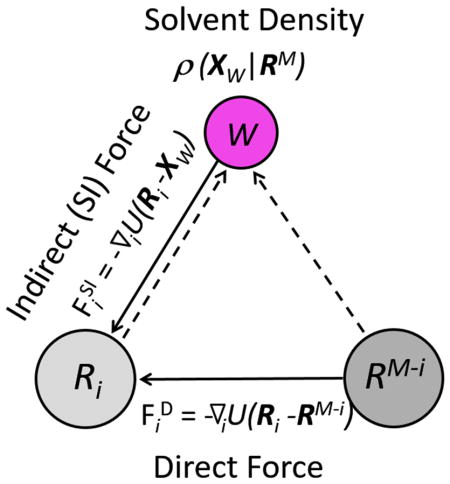
where −∇iU(Ri − Xw) is the force exerted on the group i of the protein by a water molecule at Xw, and ρ(Xw|RM) is the conditional density of water molecules given the presence of the protein at a specific conformation RM. The quantity ρ(Xw|RM)dXw may also be interpreted as the conditional probability of finding a water molecule within the element of “volume” dXw. As the integrand on the right-hand side of (7) is the product of two factors, the integration is effectively only over that region of space where both factors are non-negligible. These two factors of the force on group i of the protein are summarized in Figure 1, where Ri and RM−i are schematically represented as two similarly sized solutes.
Figure 1.
Forces on a protein group Ri. The Direct force ( ), due to the rest of the protein (RM−i), and the indirect, Solvent-Induced force ( ), due to a water molecule W are shown as solid arrows. The effect of the entire protein on the density of solvent at Xw is shown as dashed arrows.
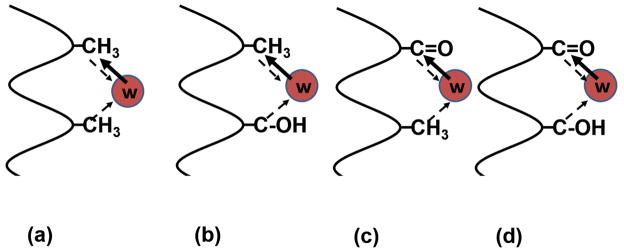
Since in this article we focus on the solvent-induced forces, we will examine a few simple cases of a segment of a protein having groups of two kinds: a methyl representing HϕO groups, and a hydroxyl or carbonyl to represent HϕI groups. This leads to the four possible combinations of pairwise interactions shown in Figure 2.
Figure 2.
The four possible pairs of functional groups: (a) HϕO - HϕO, (b) HϕO - HϕI, (c) HϕI - HϕO and (d) HϕI - HϕI.
We expect that the strength of the forces for these four cases to be as follows:
(a) The force on a HϕO group in a HϕO environment
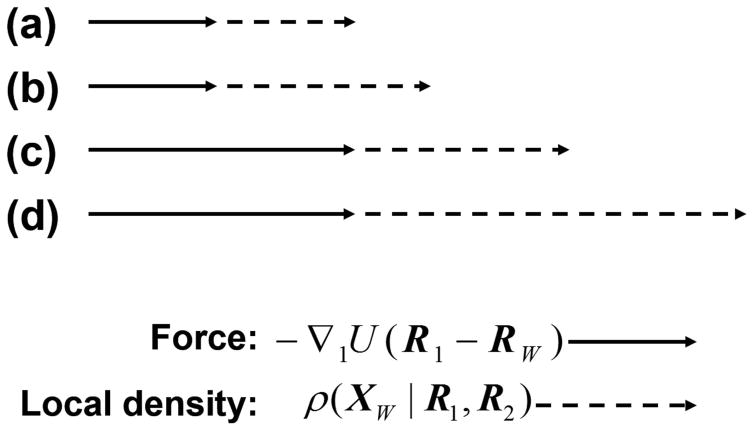
In this case, the first factor of the force, −∇1U(R1−Xw), is expected to be weak. This is because the interaction of a neutral HϕO group with water is limited to the van der Waals (VDW) interaction. Likewise, the second factor, ρ(Xw|RM), is not expected to be much larger than the bulk density of the solvent, ρw. This is again because the environmental HϕO group can only attract a water molecule by the relatively weak VDW effect. Since both factors are small, the solvent-induced force ( ) is expected to also be relatively weak.
(b) The force on a HϕO group in a HϕI environment
Again, the first factor involves the interaction of a HϕO group and a water molecule, which is relatively weak. However, since the environmental HϕI group will attract water molecules by forming relatively strong hydrogen bonds, the conditional solvent density around the first group will be significantly enhanced.20 Thus, although the interaction is weak, the increase of the density of water will cause a stronger solvent-induced force than in case (a).
(c) The force on a HϕI group in a HϕO environment
In this case, the first factor is expected to be considerably larger than in (a) and (b). This is because, as noted above, the HϕI group can form a hydrogen bond with a proximal water molecule, which is much stronger than the VDW attraction. However, due to the same combination of HϕI and HϕO groups, the conditional density of solvent will be the same as in case (b). Therefore, the enhanced magnitude of the first factor will result in a greater solvent-induced force.
(d) The force on a HϕI group in a HϕI environment
In this case, the first factor will be as large as in case (c). However, because of the presence of two HϕI groups, we might, under the right conditions, get a higher conditional density of solvent. In this context, the right condition is where a water molecule simultaneously hydrogen bonds to both HϕI groups.20 This occurs optimally when the two groups are separated by about 4.5 A, and a hydrogen bond acceptor or donor-arm from each group are orientated to cross at the tetrahedral angle of the water molecule. Thus, with both large interaction and density terms, the solvent-induced force will be even stronger than for case (c).
Figure 3 provides a schematic comparison of the relative magnitudes of the expected solvent-induced forces and its components for the four cases. While the above arguments were limited to systems of only two groups, clearly they can be extended for the presence of additional groups. The general conclusion is that the strongest solvent-induced force is expected to be exerted on a HϕI group when there are other HϕI groups in its immediate neighborhood.
Figure 3.
Schematic representation of the change of the force (full arrow) and of the local density (dashed arrow) in going from case (a) to (d) in Figure 2.
Methods and Computational Details
Molecular Dynamics computer simulations were used to calculate the forces acting on groupings of either hydrophobic or hydrophilic solutes in water. The systems consisted of the solutes kept static in a box of freely-moving solvent water molecules. The Total mean force on each solute was calculated as the average over the coordinate trajectory. Note that this was only necessary for obtaining the force due to the solvent, as the Direct interaction among the static solutes was of course constant. Keeping the same relative orientation, multiple simulations were done for each set of solutes over a range of fixed distances between them (using the X-axis for this variable). This enabled obtaining the mean force on the solutes as a function of separation. The steps were 0.2 Å from the shortest separation to 8.0 Å, 0.25 Å from 8.00 to 13.00 Å, and an additional simulation at 14.0 Å (at which solutes were effectively isolated from each other). The Potential of Mean Force (PMF) curves for each set of simulations were obtained by numerically integrating the Mean Force curves from the greatest to closest separations using the trapezoid-rule.
The Molecular Dynamics simulations were performed with the CHARMM (v.35b5) computer software,44 with the “all27” set of topologies and parameters. All systems utilized a rectangular box of 42.0 Å in the X-direction, and 28.0 Å in the Y and Z-directions. The longer X-dimension was to allow for sufficient solvent surrounding the solutes even at their maximum separation. The box was filled with water molecules to, after accounting for the volume of the solutes, make a solvent density of approximately 1 g/ml. This was typically around 1095 waters. The hydrophobic, aliphatic solutes were simply developed from analogous hydrocarbon entities of amino acid side chains in the force-field, and the TIPS3P model was used for both the hydrophilic solutes and the solvent waters. The atomic equilibrium well-depth (ε) and radii (Rmin/2) parameters for the Lennard-Jones equation to represent the VDW effect and the atomic charges (q) for the electrostatic equations are given in Table I. VDW and electrostatic energies and forces were calculated on a pair-wise atomic basis utilizing the vShift and fShift truncation methods, respectively, with a cutoff of 12.0 Å for both. This allowed for a cutoff of 14.0 Å to be used for generation of the non-bonded interaction lists. The dynamics was propagated with the combined LEAP LANGEVIN method, using a friction coefficient of 1 ps−1 and a target temperature of 300 ºK. The box was kept at constant volume, and was subjected to periodic boundary conditions with the CRYSTAL facility with a cutoff of 14.0 Å. Image centering was applied to the solvent. The non-bonded and image interaction lists were updated every 25 steps.
Table 1.
Atomic Parameters for VDW and Electrostatic Energy and Force Equations.
| well-depth ε (kcal/mol) |
radius Rmin/2 (Å) |
charge q (e) |
|
|---|---|---|---|
| Atom | |||
| Alkanes | |||
| C (1H) | −0.0200 | 2.2750 | 0.0 |
| C (2H’s) | −0.0550 | 2.1750 | 0.0 |
| C (3,4H’s) | −0.0800 | 2.0600 | 0.0 |
| H | −0.0220 | 1.3200 | 0.0 |
| TIPS3P | |||
| O | −0.1521 | 1.7682 | −0.834 |
| H | −0.0460 | 0.2245 | 0.417 |
The equilibrium well-depth and separations for a pair of atoms are obtained by the following rules: εi,j = (εi * εj)1/2; Rminij = (Rmin/2)i + (Rmin/2)j. The aliphatic carbon atoms are distinguished by the number of hydrogens bound to them.
The first step of the procedure was to energy-minimize the system to eliminate any solute-solvent overlap. This was done in two phases: first without and then with the SHAKE constraint applied to the TIPS3P waters. This was found useful to avoid occasional numerical instability resulting from large initial energies. The next steps were 5100 ps of dynamics for heating and equilibration of the system, and then 10 ns of production dynamics. An integration time step of 1.0 fs was used throughout. Snapshots of the production run were collected every 0.5 ps for analysis. This interval was previously found sufficient for producing independent samples.41 For symmetrical systems with equal force magnitudes along the X-axis, the results for each solute were combined to provide 40,000 samples.
Results and Discussion
First we shall describe the results for pairs of HϕO groups, and then for pairs of HϕI groups. The latter are divided first into forces due to an intervening solvent water molecule (i.e., a water-bridge), and then due to direct, inter-solute hydrogen bonding.
Hydrophobic Forces
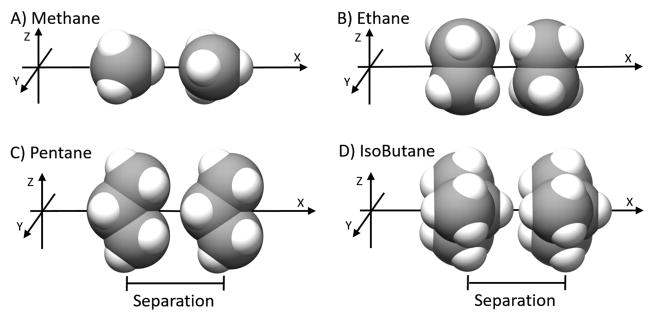
First we consider the forces and potentials that occur among non-polar, alkane solutes as they move from effective infinite separation to contact with each other in aqueous solvent. A range of solute pairs, i.e. methane, ethane, pentane and isobutane, was chosen to examine the effect of size. Figure 4 shows the relative orientations of the four pairs of solutes tested, and indicates the direction of the separation variable.
Figure 4.
Relative orientations of the pairs of A) Methane, B) Ethane, C) Pentane and D) Isobutane solutes. The only change within a set of simulations was the inter-solute separation, which was done along the X-axis. The solutes are shown as spheres, with carbons colored grey, and hydrogens white.
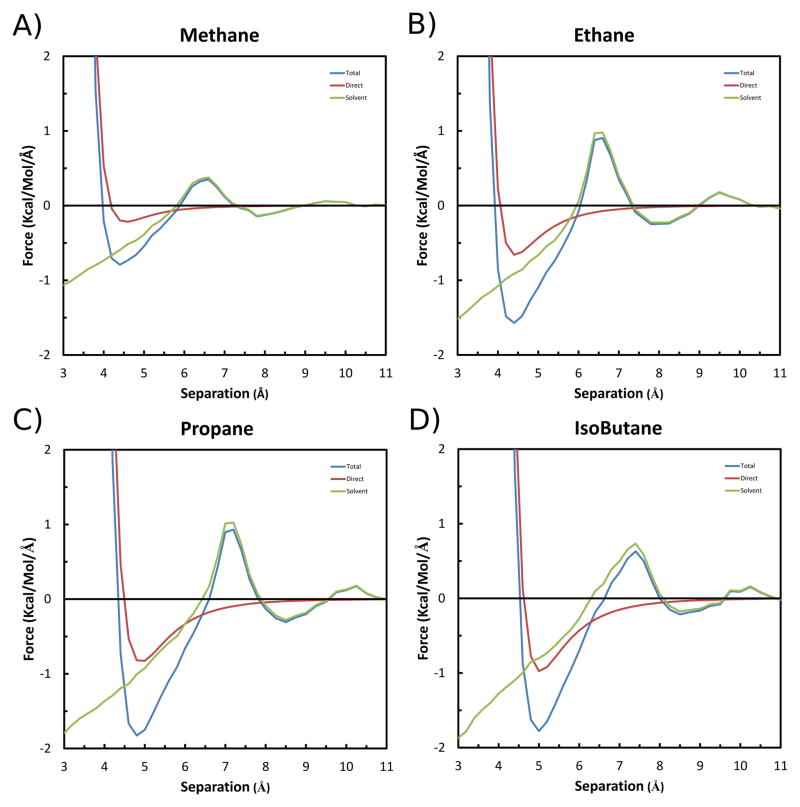
The calculated mean Force curves for the four pair of solutes as a function of separation are shown in Figure 5. It must be noted that the values are for that experienced by a single solute, and not for the pair as a whole. Of course, since the solutes are fixed in space during each simulation, there is no net force on the pair, and thus the average force on each solute must be of equal magnitude and opposite direction along the X axis. Thus, to avoid confusion about the direction of the force on each solute, negative magnitude is arbitrarily used to indicate attraction (a force toward the other solute), and positive magnitude indicates repulsion (a force away from the other solute). Finally, to indicate the physical bases of the effects, the Total force is also broken-down into its Direct ( : due to solute-solute interactions) and Solvent-Induced ( : due to solute-solvent interactions) components (Eq. 6).
Figure 5.
Forces along the X-axis experienced by each solute in the A) Methane, B) Ethane, C) Propane and D) Isobutane pairs as a function of separation. The Total is shown in blue, the Solvent-Induced component in green, and the Direct component in red. Negative magnitude indicates an attraction, and positive indicates repulsion.
As seen in Figure 5, the force curves for the four pairs of solutes are qualitatively similar, with only minor variations that reflect the different morphologies. Using the results for methane as a prototype, the pattern of attractions and repulsions are explained by the following: At the greatest separation each solute is effectively isolated, with no net force acting on them. However, as the solutes move closer together, they first experience a minor repulsion centered at 9.5 Å (0.06 kcal/mol/Å), and then a greater magnitude attraction centered at 7.8 Å (−0.14 kcal/mol/Å). These are effectively due solely to the Solvent-Induced forces ( ). Since the solute atoms are treated as electrically neutral, the Direct ( ) forces are limited to the VDW effect, which is negligible at these distances. This initial repulsion is due to the steric disruption of the two, individual shells of stabilized water molecules around each isolated solute. The subsequent attraction is due to the solutes being pulled into a new, stabilized water structure, in which the two shells are merged, sharing an approximate single layer of water molecules between the solutes. Closer movement of the solutes causes a disruption of this intervening solvent layer, resulting in a repulsion centered at 6.6 Å (0.35 kcal/mol/Å). Moving past this barrier, the solutes again experience an attraction, which results from being pulled into a new stabilized solvent shell devoid of intervening water molecules. This results in a global Total attraction centered at 4.4 Å (−0.79 kcal/mol/Å). Of course, as the solutes move closer together, the Direct VDW component rapidly becomes extremely repulsive, preventing atomic overlap. The corresponding maximum attractions for the ethane, propane and isobutane solutes are −1.57, −1.83 and −1.78 kcal/mol/Å, respectively. The Potential of Mean Force (PMF) curves obtained from integrating the Forces are given in Figure S1 of the Supplemental Information.
Hydrophilic Forces
Next we consider the strength of forces acting among two or more hydrophilic solutes. As a first step, the analysis here is limited to polar-neutral as opposed to formally charged groups. Such groups in proteins include hydroxyls, carbonyls and amines, which typically participate in hydrogen bonding. This study focuses on hydroxyl groups as solutes, which are represented by one arm of the TIPS3P water model. These “solute-waters” are the same as the “solvent-water” molecules, except that they are fixed in a specific relative orientation to each other throughout each simulation.
Solvent Water-Bridges
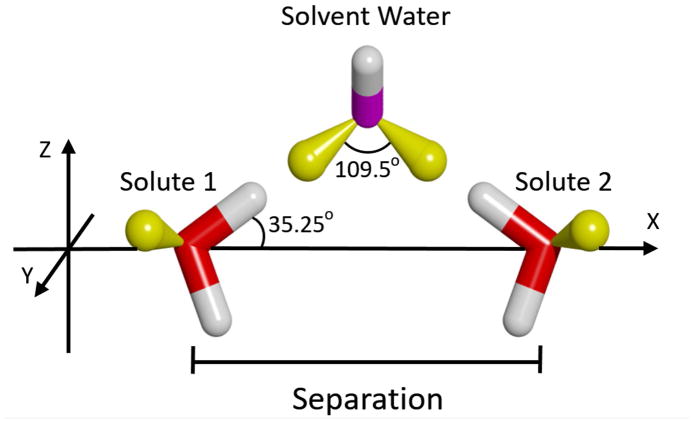
As shown in Figure 6, the simplest, solvent-mediated interaction occurs between two water solutes. Except for an altered configuration, this is the same scenario we studied in an earlier publication.41 In this case, the two solutes lie fully in the X-Z plane, and are mirror-image orientated such that the bond vectors of the upper hydroxyl groups form acute angles of 35.25º with respect to the X-axis. This is so the extensions of these two vectors cross at the ideal tetrahedral angle of 109.5º. As this closely corresponds to the angle between lone-pair orbitals of a water molecule, this configuration favors the formation of simultaneous hydrogen bonds with a single solvent water molecule when the solutes are at 4.5 Å apart (depicted in the figure).
Figure 6.
Relative orientation of the two solutes used to form simultaneous hydrogen bonds with a solvent water-bridge. The solutes are shown as sticks, with oxygens colored red, hydrogens colored white, and the lonepair orbitals colored yellow. Note that lonepair orbitals were not explicitly included in the model of the water molecules, but are shown here to aid in understanding the hydrogen bonding geometry. A solvent water, distinguished by a magenta-colored oxygen, is also shown to indicate the concept of the intervening bridge when the solutes are at an appropriate separation. However, all solvent waters were allowed to move freely in the simulations.
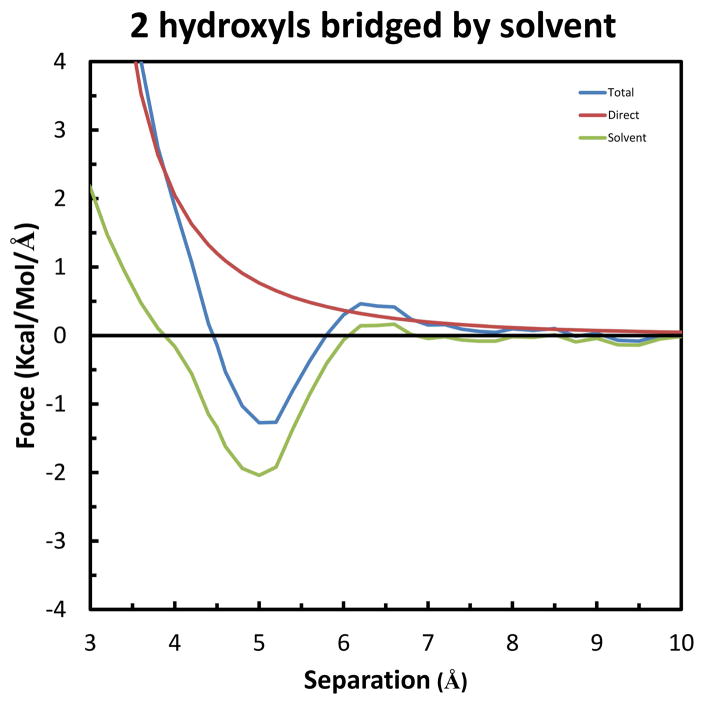
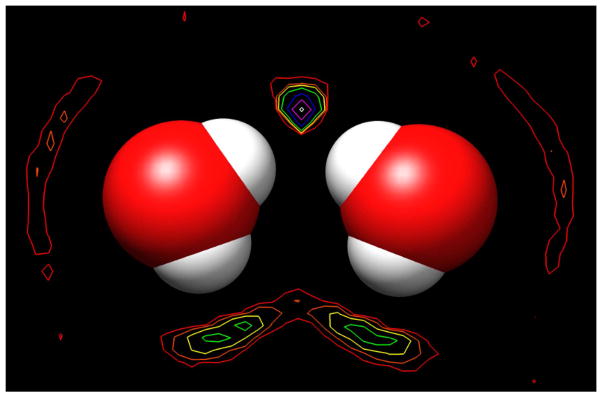
The resultant forces for this system are shown in Figure 7. As the solutes move together along the X-axis, the first significant effect is a repulsion in the Total force, with a maximum value of 0.42 kcal/mol/Å at 6.6 Å. Unlike for the electrically neutral, alkane solutes described above, this effect is due to both the Direct and Solvent-Induced components, in approximately equal measure. The former is from the electrostatic repulsion of the mirror-image solutes, and the latter is again due to disruption of the intervening layer of solvent molecules. Moving closer, the solutes experience a relatively large Solvent-Induced attraction, with a maximum of −2.04 kcal/mol/Å at 5.0 Å. This is due to both solutes being pulled into simultaneous hydrogen bonds with the intervening solvent water, as shown in Figure 6. However, the Total force acting on each solute at this separation is reduced to −1.27 kcal/mol/Å due to the counteracting, electrostatic repulsion of the Direct interaction. Still, this is nearly 50% greater than the maximum attraction of the pair of methane solutes, which are of approximately the same size. Integration of these curves produces the PMF’s shown in Figure S2 of the Supplemental Information, which confirms that the solutes are most stable at a separation of 4.5 Å (−0.51 kcal/mol). The presence of the solvent water bridge in this configuration is seen in the contour map of the average solvent density presented in Figure 8. (This was obtained simply by calculating the average number of times the centroid of a solvent water molecule occurs in each 1.0 Å3 grid box). In particular, the density at the vertex of the two upper hydroxyl bond vectors is found to be greater than 128-times the density of the bulk, pure water solvent. The importance of the geometry to this effect is indicated by the significantly smaller enhancement in density (only approximately 4 times bulk) that occurs between the two lower hydroxyl groups, which are at greater acute angles to the X-axis. In this case the bond vectors intersect too far to form simultaneous ideal hydrogen bonds with a single solvent water molecule. However, the fact that there is some enhanced solvent density at the lower position indicates that these groups provide a minor contribution to the Total solute attraction.
Figure 7.
Forces along the X-axis on each of the solutes in the system of two hydrogen bonds to a single solvent water-bridge. The Total force is shown in blue, the Solvent-Induced component in green, and the Direct component in red. Negative magnitude indicates an attraction, and positive indicates repulsion.
Figure 8.
Contour map of the time-averaged density of solvent water around the solutes fixed at the most stable separation of 4.5 Å. The contours are drawn at power-of-2 times the density of pure water at 1.0 g/ml: red indicates 2 times, orange – 4x, yellow – 8x, green – 16x, blue -32x, magenta – 64x, and white – 128x.
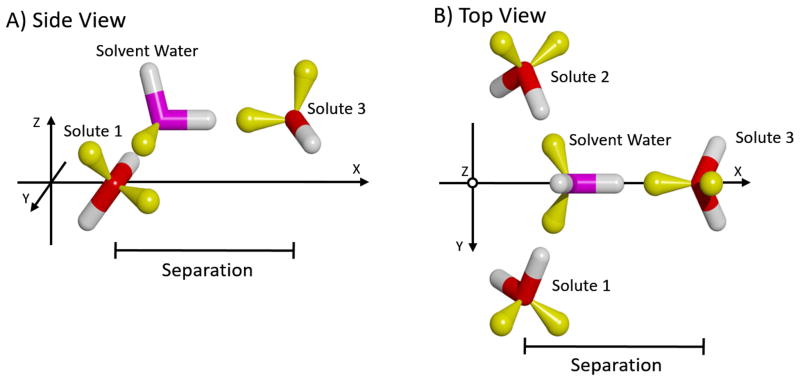
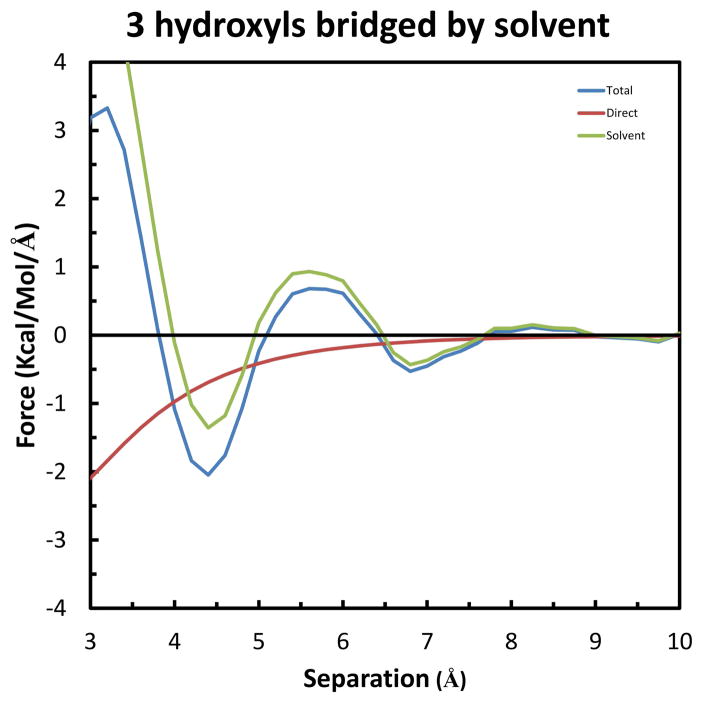
Next, we consider the case of a third solute molecule approaching the previous two in such a way as to form a hydrogen bond with the same solvent-water bridge. As shown in Figure 9, Solutes 1 & 2 were kept fixed in the relative orientation of greatest stabilization identified in the previous experiment: with a separation of 4.5 Å (Figure 6). These two were rotated 90º around the Z-axis through their center, and then 37.74º around the Y-axis, to again have the solute movement be along the X-axis. The separation was measured as the difference in X-coordinates of the oxygen atoms of Solute 3 and Solutes 1 and 2 (which are the same). The resulting force curves are displayed in Figure 10, which show greater repulsion and attraction than the previous case. Specifically, the long-range repulsion in the Total force increases to 0.68 kcal/mol/Å at 5.6 Å, and the maximum Total attraction increases to −2.05 kcal/mol/Å at 4.4 Å. Another difference is that in this system the Direct component has switched from repulsive to attractive throughout the separation range. This is because in the previous case the closest atoms of the two solutes were the similarly charged protons of the upper hydroxyl groups; whereas, in this case these protons are closest to the oppositely charged oxygen atom of Solute 3. Review of the associated PMF curves in Figure S3 of Supplemental Information indicates a similar increase in the stabilization, to −1.33 kcal/mol at 3.8 Å.
Figure 9.
A) Side and B) top views of the three solutes used to form simultaneous hydrogen bonds with a solvent water-bridge. The color-code is the same as in Figure 6. Solutes 1 & 2 were held fixed relative to each other, and only the position of Solute 3 along the X-axis was varied. A solvent water is also shown to indicate the position of the intervening bridge when the solutes are at the most stabilized configuration.
Figure 10.
Forces along the X-axis on Solute 3 in the system of three hydrogen bonds to a solvent water-bridge. The color code is the same as in Figure 7.
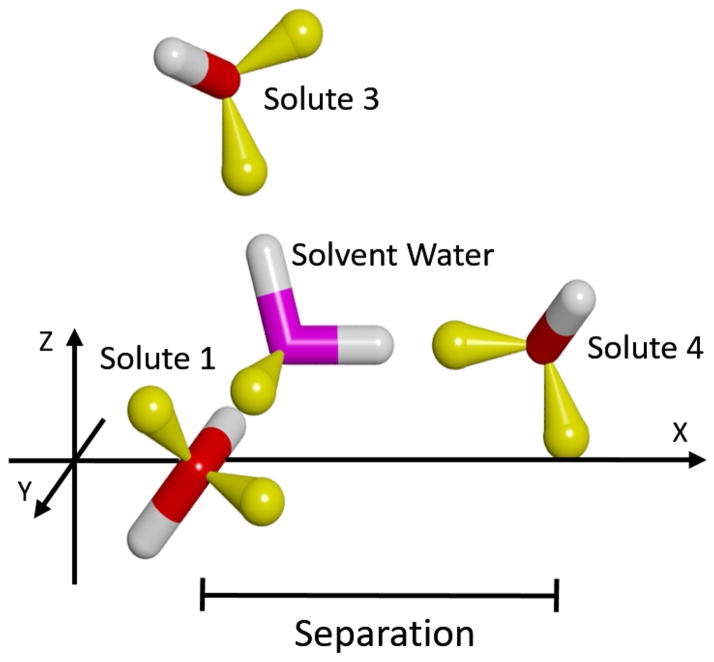
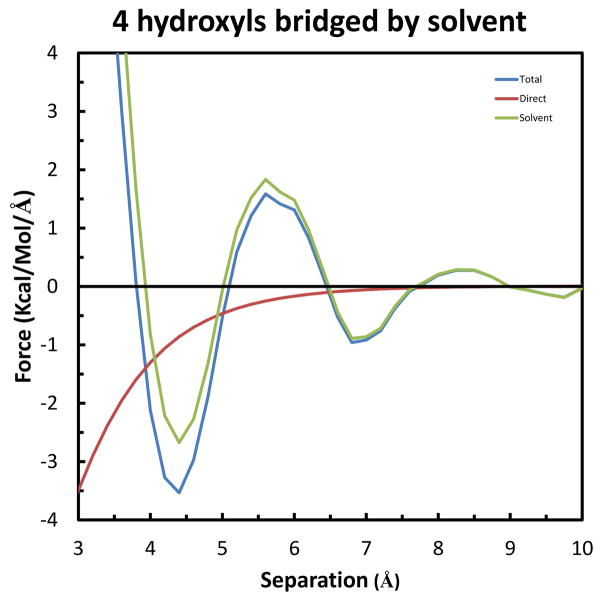
Finally, we consider the case of a fourth solute hydrogen bonding to the same solvent water-bridge. This setup is shown in Figure 11, in which Solutes 1, 2 & 3 are kept in the configuration of greatest stabilization, and rotated to have Solute 4 move along the X-axis and form a hydrogen bond with the remaining hydroxyl group of the solvent water-bridge. Similarly, the separation is taken as the difference in X-coordinates of the oxygens of Solute 4 and Solutes 1 & 2. As shown in Figure 12, this results in the greatest forces determined so far. Specifically, the long-range Total repulsion increases to 1.59 kcal/mol/Å at 5.6 Å, and the maximum Total attraction increases to −3.54 kcal/mol/Å at 4.4 Å. Again from integration of the curves, Figure S4 in Supplemental Information shows that the maximum Total stabilization is −2.02 kcal/mol at 3.8 Å.
Figure 11.
Relative orientation of the four solutes used to form simultaneous hydrogen bonds with a solvent water bridge. Although not seen, Solute 2 is in the mirror-image position of Solute 1 behind the X-Z plane. The color-code is the same as in Figure 6. A solvent water is also shown to indicate the position of the intervening bridge when the solutes are at an appropriate configuration.
Figure 12.
Forces along the X-axis on Solute 4 in the system of four hydrogen bonds to a single solvent water-bridge. The color-code is the same as in Figure 7.
The last two systems are best suited for understanding the physical basis of the effects at the atomic level. This is because, as seen by comparison of the configurations in Figures 9 and 11, the only difference is the presence of an extra fixed solute in the latter (i.e., Solute 3 in Figure 11). As indicated above, the maximum Total attraction for both systems occurs at 4.4 Å, but increases over 85% from −1.91 to −3.56 kcal/mol/Å. A small part of the change, approximately 10% is due to the Direct component, which increases from −0.67 to −0.83 kcal/mol/Å. But the remaining 90% is due to the increase in the Solvent-Induced component, from −1.24 to −2.73 kcal/mol/Å. As described by equation (7) in Theoretical background, a change in Solvent-Induced force results from a change in one or both of two independent factors: the gradient of the interaction (−∇1U(R1−Xw)) and the conditional density (ρ(Xw|RM)) of the solvent water molecules. As the geometry of interaction is the same for Solute 3 in the former system and Solute 4 in the latter, the explanation for the increase in attraction is a change in solvent density. Indeed, this is confirmed by an increase in density at the position of the solvent water bridge (not shown). Specifically, at the separation of maximum attraction (4.4 Å), the time-averaged density changes from 1.91 to 4.96 waters/Å3. This extra density is due to the solvent water bridge making 3 instead of only 2 hydrogen bonds with the fixed solutes in the latter system compared to the former.
Solute-Solute Hydrogen Bonding
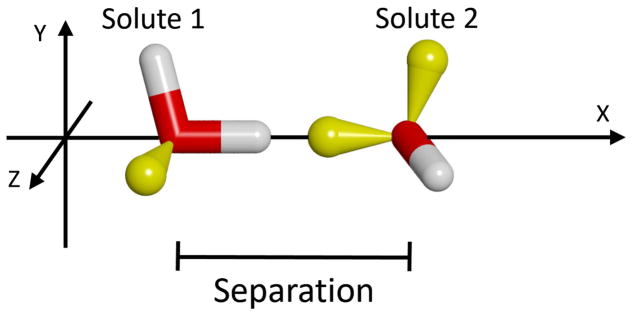
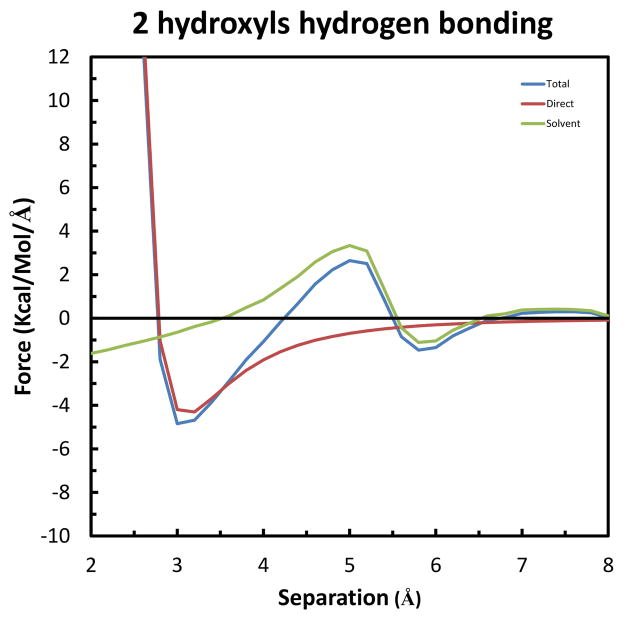
The first, simplest system studied was a single hydrogen bond between two solutes. As shown in Figure 13, the solutes were arranged in the ideal geometry along the X-axis. The resultant forces are shown in Figure 14. As the solutes move together, they first experience a Total attraction of −1.47 kcal/mol/Å at 5.8 Å. This is primarily a Solvent-Induced effect, due to being pulled into hydrogen bonding with the intervening layer of solvent, with a minor contribution of the Direct, mainly electrostatic, component. As the solutes move closer, steric clashes force the intervening, hydrogen bonded solvent waters to be stripped away, causing a maximum Solvent-Induced repulsion of 2.65 kcal/mol/Å at 5.0 Å. As the solutes move closer, the Solvent-Induced component decreases, and the solutes are primarily pulled into forming a Direct hydrogen bond with each other. This results in a maximum Total attraction of −4.84 kcal/mol/Å at 3.0 Å, which is the largest of the forces calculated here so far. Likewise, the calculated PMF curves in Figure S5 show the greatest value for the Total stabilization obtained so far: −2.88 kcal/mol at 2.8 Å. As described in the Introduction, this is significant in that it is contrary to earlier ideas that hydrogen bonding does not contribute significantly to the stability of protein folding in aqueous solution.21,22,23 In fact, these computer simulation results confirm predictions made by Ben-Naim on the energetics of hydrogen bonding from a statistical thermodynamic perspective.26 In that work it was shown that the free energy change for a hydrogen bond is equal to the Direct interaction minus the Conditional Solvation Free Energy of the functional groups that is lost due to desolvation. This is exactly what is seen in the plot of the PMF (Figure S5), where at the equilibrium separation the negative Total Helmholtz free energy results from the difference of a large negative Direct interaction of −5.95 kcal/mol and a lesser, positive Solvent-Induced interaction of 3.07 kcal/mol due to solvent water being stripped away from that “arm” of the solute that forms the hydrogen bond with the other solute.
Figure 13.
Relative orientation of the two solutes used to form an ideal hydrogen bond with each other. The color code is the same as in Figure 6. The only change between simulations was the fixed separation along the X-axis, which was taken as the coordinate difference of the two oxygen atoms.
Figure 14.
Forces along the X-axis on each of the solutes in the system of a single, ideal hydrogen bond. The color code is the same as in Figure 7.
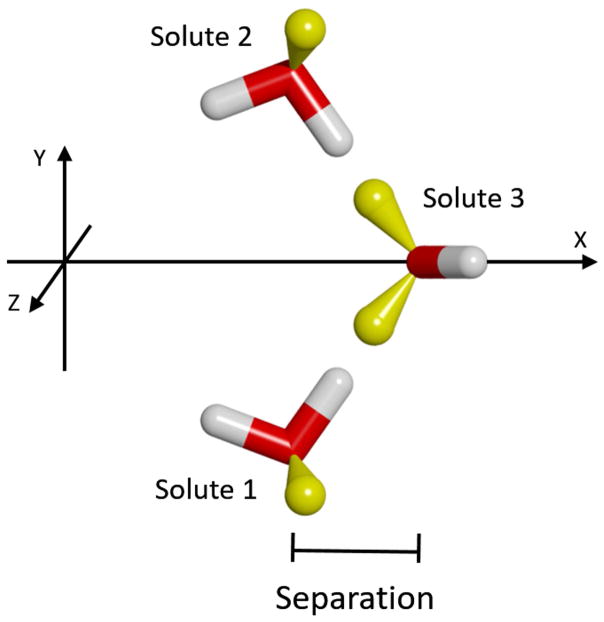
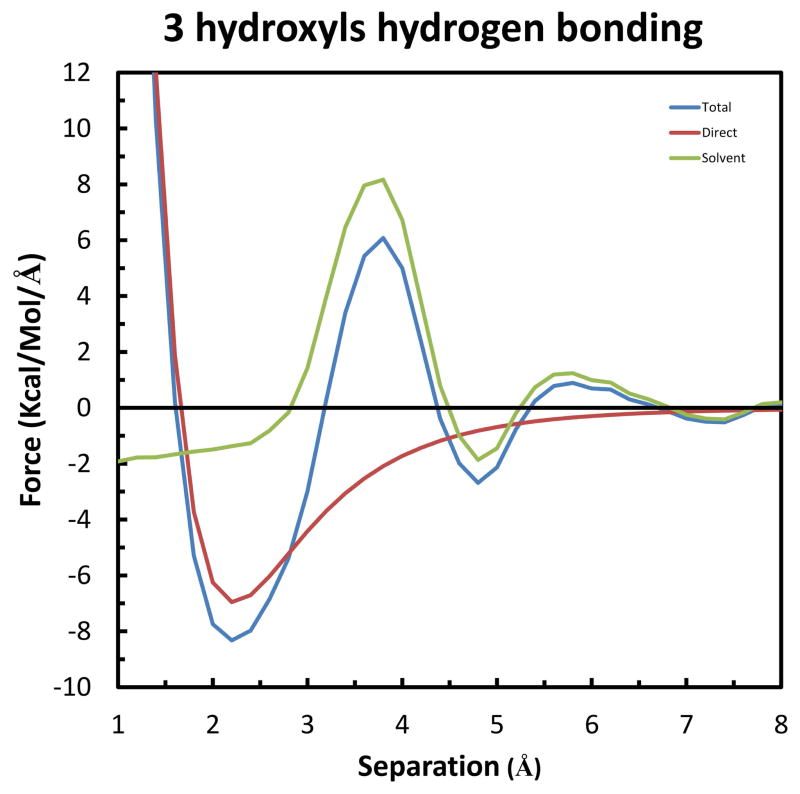
Next we consider the forces on a solute forming two simultaneous hydrogen bonds with other solutes. As seen in Figure 15, the setup is similar to the case of two solutes forming simultaneous hydrogen bonds with a solvent water-bridge (Figure 9). However, in this case Solute 3 takes the place of the solvent bridge. Thus, this system can be thought of as the limit when the bridging water is always present. As seen in Figure 16, the X-axis forces on Solute 3 are qualitatively similar to the previous, single hydrogen bond case, except with greater magnitudes and shifted separations. Specifically, the two largest effects on the Total force are a repulsion of 6.08 kcal/mol/Å at 3.8 Å, and a maximum attraction of −8.33 kcal/mol/Å at 2.2 Å. As seen in Figure S6 of the Supplemental Information, the maximum Total stabilization is −5.55 kcal/mol/Å at 1.6 Å.
Figure 15.
System of three solutes used to form two simultaneous hydrogen bonds. The color code is the same as in Figure 6. The only change between simulations was the separation of Solute 3 along the X-axis. The separation was measured as the difference in X-coordinates of Solute 3 and Solutes 1 & 2 (which are the same).
Figure 16.
X-component of the forces on Solute 3 in the system of two simultaneous hydrogen bonds. The color code is the same as in Figure 7.
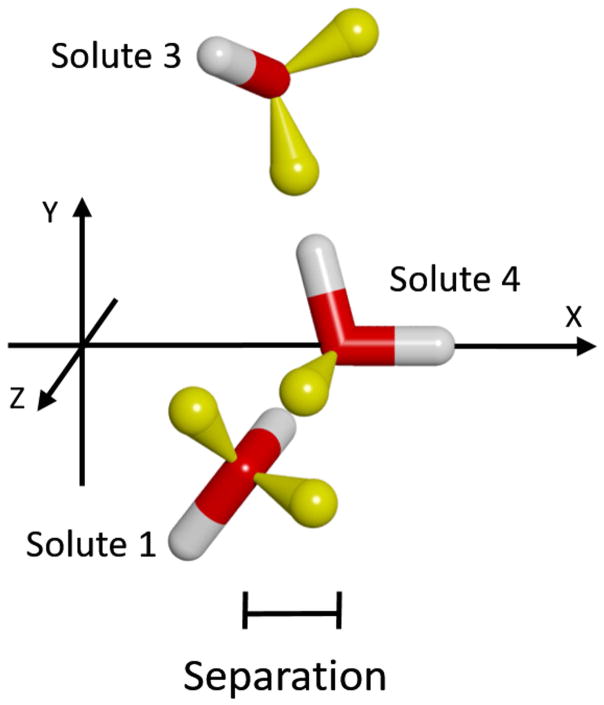
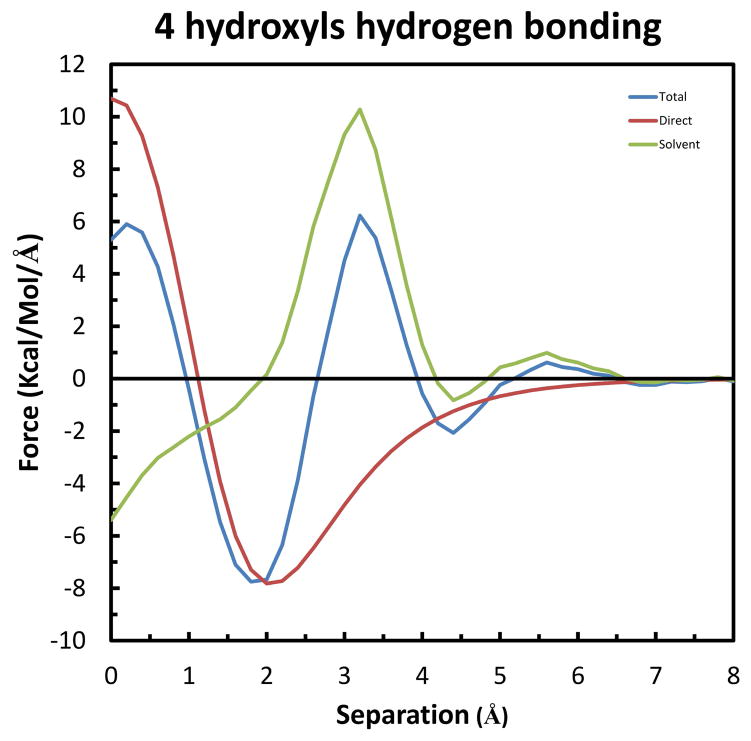
Finally, we considered the extension of a solute forming three simultaneous hydrogen bonds. As seen in Figure 17, the configuration for Solutes 1,2 & 3 was fixed in the same configuration as for the study of a water-bridge hydrogen bonding to four solutes (Figure 11). However, in this case Solute 4 takes the place of the water-bridge, which again moves along the X-axis. As in the previous case, this represents the limit of a water bridge being present in the same position throughout the simulation. As seen in Figure 18, the results are also similar to the previous case, except for minor variations in the positions and magnitudes of the peaks. Interestingly, contrary to what has been observed so far, that increasing the number of hydrogen bonds leads to greater effects, the maximum Total attraction is slightly reduced, to only −7.75 kcal/mol/Å at 1.8 Å. This is because, unlike in the previous case, where the attraction vectors of the hydroxyl groups of Solutes 1 & 2 on Solute 3 were only in the X-Y plane, in this case they have components in all three directions. As seen in Figure S7 of the Supplemental Information, the maximum Total stabilization is −5.13 kcal/mol/Å at 1.0 Å.
Figure 17.
Relative orientation of solutes used to form 3 simultaneous hydrogen bonds. Although not seen, Solute 2 is in the mirror-image position of Solute 1 behind the X-Y plane. The color-code is the same as in Figure 6. Solutes 1, 2 & 3 were held fixed relative to each other, and only the position of Solute 4 along the X-axis was varied. The separation was measured as the difference in X-coordinates of Solute 4 and Solutes 1 & 2 (which are the same).
Figure 18.
X-component of the forces on Solute 4 in the system of three simultaneous hydrogen bonds. The color code is the same as in Figure 7.
Concluding Remarks and Relevance to Protein Folding
Table 2 summarizes the maximum forces and stabilizing energies (PMF’s) obtained from all the simulations described above. For the hydrophobic groups the maximum attraction and PMF approximately double in response to the increase in solute size from methane to ethane, but then they level off for the larger solutes. Among the hydrophilic groups (hydroxyls), the weakest maximum attraction and PMF is for two solutes bridged by a solvent water molecule. However, the magnitude of this force is greater than that of the similarly sized methane solutes, and closer to that of the case of ethane solutes. Increasing the number of hydrophilic solutes that can be simultaneously bridged by a single solvent water molecule results in increasingly greater attraction and stabilization. This supersedes those of all the hydrophobic groups, with greater attraction among three hydrophilic groups, and greater stabilization with four hydrophilic groups. However, by far the greatest attraction and stabilization occurs for the hydrophilic groups that can form hydrogen bonds among themselves. For example, the maximum attraction for a single hydrogen bond is more than 2.5 times greater than the strongest result for all the hydrophobic solutes, and the maximum stabilization is nearly 1.5 times greater.
Table 2.
Comparison of Maximum Forces and Stabilities.
| Hydrophobic Groups | Max. Attraction (kcal/mol/Å) | Max. Stabilization (kcal/mol) |
|---|---|---|
| Methane | −0.79 | −0.71 |
| Ethane | −1.57 | −1.53 |
| Propane | −1.83 | −1.96 |
| Isobutane | −1.78 | −1.74 |
| Hydrophilic Groups | ||
| Water-Bridges | ||
| 2 groups | −1.27 | −0.51 |
| 3 groups | −2.05 | −1.33 |
| 4 groups | −3.54 | −2.02 |
| Directly H-bonded | ||
| 2 groups | −4.84 | −2.88 |
| 3 groups | −8.33 | −5.55 |
| 4 groups | −7.75 | −5.13 |
Based on these results, we envisage the process of protein folding to be as follows: Starting from an arbitrary conformation of the protein chain, there will be forces acting on each of the groups of the protein. As we have seen, the forces exerted on the HϕI groups are significantly stronger than the forces on the HϕO groups. Add to this that on average each protein has many more HϕI than HϕO groups, we can safely conclude that the forces on all the HϕI groups will dominate the speed of the folding. If the protein is initially in an extended conformation, we expect each HϕI group to have on average another, single HϕI group in its vicinity. In this case the forces on these groups will be similar to the results for two hydrophilic solutes shown in Table 2. However, as the protein becomes more compact, each HϕI group is expected to be surrounded by a larger number of HϕI groups, which will result in even greater forces and stabilization. Hence, we expect that the folding process will be accelerated as the protein conformation becomes more and more compact. This scenario is very different from the so-called “hydrophobic collapse,” where the tendency of the HϕO groups to aggregate is presumed to be the main “driving force” for the folding process.2,3 As for the “guidance” of the folding process, once we recognize the importance of the HϕI forces, we can conclude that the specific pattern of amino acids in the chain provides a pattern of strong forces, hence also a preferable pathway for the folding. In this sense, the HϕI force answers the two questions raised by Levinthal regarding the speed and guidance of the folding process.
To better understand the protein folding process it will be necessary to extend these simulations beyond small model solutes to more realistic representations of protein chains. A next step would be to test the forces on solutes composed of small peptides with different hydrophilic and hydrophobic sidechains. As with the hydrophilic solutes in this study, it will be useful to examine both pairs and larger clusters to model the range of protein folding from extended to compact. As described for the four cases in the Theoretical background, these studies will get at the effects that the protein environment have on the magnitudes of the forces on the functional groups.
Supplementary Material
Acknowledgments
This study utilized the high-performance computational capabilities of the Biowulf Linux cluster at the National Institutes of Health, Bethesda, Md. (http://biowulf.nih.gov).
This work was supported by the Intramural Research Program of the NIH, National Cancer Institute, Center for Cancer Research.
Footnotes
Plots of the PMFs for each of the simulations are given in the Supplemental Information.
Reference List
- 1.Anfinsen CB. Principles that govern the folding of protein chains. Science. 1973;181(4096):223–230. doi: 10.1126/science.181.4096.223. [DOI] [PubMed] [Google Scholar]
- 2.Levinthal C. How to Fold Graciously. In: De Brunner JTP, Munck E, editors. Mossbauer Spectroscopy in Biological Systems: Proceeding of a meeting held at Allerton House, Monticello, Illinois. 1969. pp. 22–24. [Google Scholar]
- 3.Levinthal C. Are There Pathways for Protein Folding. Journal de Chimie Physique. 1968;65(1):44–45. [Google Scholar]
- 4.Ben-Naim A. The Protein Folding Problem and its Solutions; World Scientific; Singapore: 2013. [Google Scholar]
- 5.Dill KA, Ozkan SB, Shell MS, Weikl TR. The protein folding problem. Annu Rev Biophys. 2008;37:289–316. doi: 10.1146/annurev.biophys.37.092707.153558. [DOI] [PMC free article] [PubMed] [Google Scholar]
- 6.Dill KA, MacCallum JL. The protein-folding problem, 50 years on. Science. 2012;338(6110):1042–1046. doi: 10.1126/science.1219021. [DOI] [PubMed] [Google Scholar]
- 7.Szilágyi A, Kardos J, Osváth S, Barna L, Závodszky P. Handbook of Neurochemistry and Molecular Neurobiology-Neural Protein Metabolism and Function. Chapter 10. Springer-Verlag; Berlin Heidelberg: 2007. Protein Folding; pp. 303–343. [Google Scholar]
- 8.Ben-Naim A. Levinthal’s question revisited, and answered. J Biomol Struct Dyn. 2012;30(1):113–124. doi: 10.1080/07391102.2012.674286. [DOI] [PubMed] [Google Scholar]
- 9.Ben-Naim A. Some aspects of the protein folding problem examined in one-dimensional systems. J Chem Phys. 2011;135(8):085104. doi: 10.1063/1.3626859. [DOI] [PubMed] [Google Scholar]
- 10.Ben-Naim A. Myths and Verities in Protein Folding Theories. World Scientific; Singapore: 2016. [DOI] [PubMed] [Google Scholar]
- 11.Ben-Naim A. The Rise and Fall of the Hydrophobic Effect in Protein Folding and Protein-Protein Association and Molecular Recognition. Open Journal of Biophysics. 1:1–7. 201. [Google Scholar]
- 12.Anson ML, Mirsky AE. The Equilibria between Native and Denatured Hemoglobin in Salicylate Solutions and the Theoretical Consequences of the Equilibrium between Native and Denatured Protein. Journal General Physiology. 1934;17(3):393–408. doi: 10.1085/jgp.17.3.399. [DOI] [PMC free article] [PubMed] [Google Scholar]
- 13.Mirsky AE, Pauling L. On the Structure of Native, Denatured and Coagulated Proteins. Proceedings of the National Academy Science of the USA. 1936;22(7):439–447. doi: 10.1073/pnas.22.7.439. [DOI] [PMC free article] [PubMed] [Google Scholar]
- 14.Pauling L, Corey RB. Atomic Coordinates and Structure Factors for Two Helical Configurations of Polypeptide Chains. Proceedings of the National Academy Science of the USA. 1951;37(5):235–248. doi: 10.1073/pnas.37.5.235. [DOI] [PMC free article] [PubMed] [Google Scholar]
- 15.Pauling L, Corey RB. The Pleated Sheet, A New Layer Configuration of Polypeptide Chains. Proceedings of the National Academy Science USA. 1951;37(5):251–256. doi: 10.1073/pnas.37.5.251. [DOI] [PMC free article] [PubMed] [Google Scholar]
- 16.Pauling L, Corey RB. The Structure of Fibrous Proteins of the Collagen-Gelatin Group. Proceedings of the National Academy Science of the USA. 1951;37(5):272–281. doi: 10.1073/pnas.37.5.272. [DOI] [PMC free article] [PubMed] [Google Scholar]
- 17.Pauling L, Corey RB. Configurations of Peptide Chains with Favored Orientations around Single Bonds: Two New Pleated Sheets. Proceedings of the National Academy Science of the USA. 1951;37(5):729–740. doi: 10.1073/pnas.37.11.729. [DOI] [PMC free article] [PubMed] [Google Scholar]
- 18.Tanford C, Reynold J. Nature’s Robots, A History of Proteins. Oxford University Press; Oxford: 2003. [Google Scholar]
- 19.Schellmann JA. The Thermodynamics of Urea Solutions and the Heat of Formation of the Peptide Hydrogen Bond. Comptes Rendus des Travaux du Laboratoire Carlsberg, Serie Chimique. 1955;29(14–15):223–230. [PubMed] [Google Scholar]
- 20.Schellmann JA. The Stability of Hydrogen-Bonded Peptide Structures in Aqueous. Solution. Comptes Ren-dus des Travaux du Laboratoire Carlsberg, Serie Chimique. 1955;29(14–15):230–259. [PubMed] [Google Scholar]
- 21.Kauzmann W. Some factors in the interpretation of protein denaturation. Adv Protein Chem. 1959;14:1–63. doi: 10.1016/s0065-3233(08)60608-7. [DOI] [PubMed] [Google Scholar]
- 22.Fersht AR. The Hydrogen-Bond in Molecular Recognition. Trends in Biochemical Sciences. 1987;12(8):301–304. [Google Scholar]
- 23.Fersht A. Structure and Mechanism in Protein Science. W. H. Freeman and Company; New York: 1999. [Google Scholar]
- 24.Ben-Naim A. Hydrophobic Interactions. Plenum Press; New York: 1980. [Google Scholar]
- 25.Ben-Naim A. Statistical Thermodynamics for Chemists and Biochemists; Plenum Press; New York, U.S.A: 1992. [Google Scholar]
- 26.Ben-Naim A. The Role of Hydrogen-Bonds in Protein Folding and Protein Association. Journal of Physical Chemistry. 1991;95(3):1437–1444. [Google Scholar]
- 27.Ben-Naim A. Solvent effects on protein association and protein folding. Biopolymers. 1990;29(3):567–596. doi: 10.1002/bip.360290312. [DOI] [PubMed] [Google Scholar]
- 28.Ben-Naim A. Solvent-Induced Forces in Protein Folding. Journal of Physical Chemistry. 1990;94(17):6893–6895. [Google Scholar]
- 29.Pace CN, Scholtz JM, Grimsley GR. Forces stabilizing proteins. FEBS Letters. 2014;588:2177–2184. doi: 10.1016/j.febslet.2014.05.006. [DOI] [PMC free article] [PubMed] [Google Scholar]
- 30.Petukhov M, Cregut D, Soares CM, Serrano L. Local water bridges and protein conformational stability. Protein Science. 1999;8:1982–1989. doi: 10.1110/ps.8.10.1982. [DOI] [PMC free article] [PubMed] [Google Scholar]
- 31.Karvounis G, Nerukh D, Glen RC. Water network dynamics at the critical moment of a peptide’s β-turn formation: A molecular dynamics study. Journal of Chemical Physics. 2004;121(10):4925–4935. doi: 10.1063/1.1780152. [DOI] [PubMed] [Google Scholar]
- 32.Daidone I, Neuweiler H, Doose S, Sauer M, Smith JC. Hydrogen-Bond Driven Loop-Closure Kinetics in Unfolded Polypeptide Chains. PLoS Comput Biol. 2010;6(1):e1000645. doi: 10.1371/journal.pcbi.1000645. [DOI] [PMC free article] [PubMed] [Google Scholar]
- 33.Busch S, Chrystal D, Bruce CD, Redfield C, Lorenz CD, McLain SE. Water Mediation Is Essential to Nucleation of β-Turn Formation in Peptide Folding Motifs. Angew Chem. 2013;125:13329–13333. doi: 10.1002/anie.201307657. [DOI] [PMC free article] [PubMed] [Google Scholar]
- 34.Pace CN, Fu H, Lee FK, Landua J, Trevino SR, Schell D, Thurlkill RL, Imura S, Scholtz JM, Gajiwala K, Sevcik J, Urbanikova L, Myers JK, Takano K, Hebert EJ, Shirley BA, Grimsley GR. Contribution of hydrogen bonds to protein stability. Protein Sci. 2014;23(5):652–661. doi: 10.1002/pro.2449. [DOI] [PMC free article] [PubMed] [Google Scholar]
- 35.Huggins DJ. Studying the role of cooperative hydration in stabilizing folded protein states. Journal of Structural Biology. 2016;196:394–406. doi: 10.1016/j.jsb.2016.09.003. [DOI] [PMC free article] [PubMed] [Google Scholar]
- 36.Kessel A, Ben-Tal N. Introduction to Proteins: Structure, Function, and Motion. CRC Press, Taylor and Francis; New York: 2010. [Google Scholar]
- 37.Ben-Naim A. Strong Forces Between Hydrophilic Macromolecules - Implications in Biological-Systems. Journal of Chemical Physics. 1990;93(11):8196–8210. [Google Scholar]
- 38.Ben-Naim A. Solvent-Induced Interactions - Hydrophobic and Hydrophilic Phenomena. Journal of Chemical Physics. 1989;90(12):7412–7425. [Google Scholar]
- 39.Ben-Naim A. Molecular Theory of Water and Aqueous Solutions: Part II: The Role of Water in Protein Folding Self Assembly and Molecular Recognition; World Scientific; Singapore: 2011. [Google Scholar]
- 40.Mezei M, Ben-Naim A. Calculation of the Solvent Contribution to the Potential of Mean Force Between Water-Molecules in Fixed Relative Orientation in Liquid Water. Journal of Chemical Physics. 1990;92(2):1359–1361. [Google Scholar]
- 41.Durell SR, Brooks BR, Ben-Naim A. Solvent-Induced Forces Between 2 Hydrophilic Groups. Journal of Physical Chemistry. 1994;98(8):2198–2202. [Google Scholar]
- 42.Brugè F, Fornili SL, Palma-Vittorelli MB. Solvent-induced forces between solutes: A time- and space-resolved molecular dynamics study. J Chem Phys. 1994;101(3):2407–2420. [Google Scholar]
- 43.Ben-Naim A. Molecular Theory of Water and Aqueous Solutions, Part I: Understanding Water. World Scientific; Singapore: 2009. [Google Scholar]
- 44.Brooks BR, Brooks CL, III, Mackerell AD, Jr, Nilsson L, Petrella RJ, Roux B, Won Y, Archontis G, Bartels C, Boresch S, Caflisch A, Caves L, Cui Q, Dinner AR, Feig M, Fischer S, Gao J, Hodoscek M, Im W, Kuczera K, Lazaridis T, Ma J, Ovchinnikov V, Paci E, Pastor RW, Post CB, Pu JZ, Schaefer M, Tidor B, Venable RM, Woodcock HL, Wu X, Yang W, York DM, Karplus M. CHARMM: the biomolecular simulation program. J Comput Chem. 2009;30(10):1545–1614. doi: 10.1002/jcc.21287. [DOI] [PMC free article] [PubMed] [Google Scholar]
Associated Data
This section collects any data citations, data availability statements, or supplementary materials included in this article.


