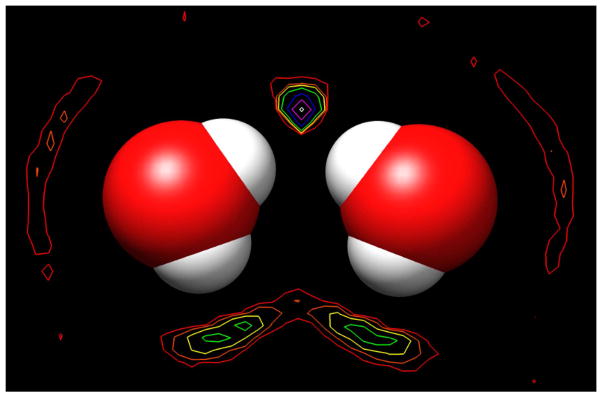
Figure 8.
Contour map of the time-averaged density of solvent water around the solutes fixed at the most stable separation of 4.5 Å. The contours are drawn at power-of-2 times the density of pure water at 1.0 g/ml: red indicates 2 times, orange – 4x, yellow – 8x, green – 16x, blue -32x, magenta – 64x, and white – 128x.

