Abstract
Dyslipidemia is one of the most important factors for coronary artery disease (CAD). The atherogenic index of plasma (AIP), a new comprehensive lipid index, might be a strong marker for predicting the risk of CAD.
A hospital-based case–control study including 2936 CAD patients and 2451 controls was conducted in a Chinese population. Traditional lipid parameters were detected, and nontraditional lipid comprehensive indexes were calculated.
Compared with controls, CAD patients had higher levels of total cholesterol (TC), triglyceride (TG), and low-density lipoprotein cholesterol (LDL-C). By contrast, the level of high-density lipoprotein cholesterol (HDL-C) was lower in CAD patients. The values of nontraditional lipid profiles, including non-HDL-C, TC/HDL-C, LDL-C/HDL-C, non-HDL-C/HDL-C (atherogenic index, AI), TC∗TG∗LDL/HDL-C (lipoprotein combine index, LCI), and lg (TG/HDL-C) (AIP), were all significantly higher in the cases than in the controls. The results of Pearson correlation analyses indicated that AIP was positively and significantly correlated with TC (r = 0.125, P < .001), TG (r = 0.810, P < .001), LDL-C (r = 0.035, P < .001), non-HDL-C (r = 0.322, P < .001), TC/HDL-C (r = 0.669, P < .001), LDL-C/HDL-C (r = 0.447, P < .001), AI (r = 0.669, P < .001), and LCI (r = 0.688, P < .001) and was negatively correlated with age (r = −0.122, P < .001) and HDL-C (r = −0.632, P < .001). In the univariate logistic regression analysis, AIP was the lipid parameter that was most strongly associated with CAD, with an unadjusted odds ratio of 1.782 (95% confidence interval: 1.490–2.131, P < .001), for an increase of 1-SD. Multivariate logistic regression analyses revealed that AIP was an independent risk factor for CAD.
AIP might be a strong and independent predictor for CAD in the Chinese Han population.
Keywords: atherogenic index of plasma, coronary artery disease, lipids
1. Introduction
Coronary artery disease (CAD) is the leading cause of mortality and morbidity worldwide, a fact that has been widely accepted.[1] According to a report on cardiovascular diseases in China, the prevalence of CAD is continuously increasing; about 1 in 5 Chinese adults is afflicted by CAD.[2] CAD is recognized as a multifactorial disease that is influenced by environmental and genetic factors.[3] Dyslipidemia is one of the most important factors for CAD. A growing body of evidence indicates that decreases in high-density lipoprotein cholesterol (HDL-C) and increases in total cholesterol (TC), low-density lipoprotein cholesterol (LDL-C), and triglyceride (TG) may contribute to the progression of atherosclerosis.[4,5] Among them, LDL-C is considered to be the primary target for therapy. However, after reducing LDL-C to the recommended levels, an ∼50% remnant cardiovascular risk remains, thus encouraging researchers to find new CAD predictors.[6] Compared with single lipid parameters, the comprehensive lipid indexes, such as non-HDL-C (TC minus HDL-C), TC/HDL-C, LDL-C/HDL-C, non-HLD-C/HDL-C (atherogenic index, AI), and TC∗TG∗LDL/HDL-C (lipoprotein combine index, LCI), are considered to be better predictors for CAD.[7,8]
In recent years, researchers have focused on a new comprehensive lipid index, the atherogenic index of plasma (AIP), which might comprehensively reflect the balance between atherogenic and anti-atherogenic factors. Recently, AIP has been shown to be a strong marker for predicting the risk of CAD.[9–11] In a cross-sectional study conducted in Iran, the value of AIP was positively associated with waist circumference and body mass index and was inversely associated with physical activity.[9] In another prospective study, AIP predicted CAD independently in a Turkish population. However, the results were inconsistent. Nansseu et al[12] revealed that AIP was not an independent factor determining the impact of the risk of cardiovascular disease in Cameroonian postmenopausal women. In a prospective cohort study, Hartopo et al[13] investigated the relationship between the AIP value and major adverse cardiovascular events during intensive hospitalization in patients with acute myocardial infarction (AMI). According to the value of AIP, patients were divided into a low AIP group (AIP <0.24) and high AIP group (AIP ≥ 0.24). They found that a low AIP value, in contrast with a high AIP value, was an independent predictor for all-cause mortality in patients with AMI who were undergoing intensive hospitalization.
Whether the AIP level is related to the risk of CAD in the Chinese Han population remains unknown. Therefore, the purpose of this study was to evaluate the relationship between AIP and the risk of CAD in a Chinese population undergoing coronary angiography (CAG).
2. Methods
2.1. Study population
A total of 5387 consecutive unrelated adult patients undergoing CAG for suspected CAD in Wujin Hospital affiliated with Jiangsu University were enrolled in this study between January 2006 and December 2015.
The exclusion criteria were the following: patients who did not undergo a CAG examination or had repeated CAG examinations; incomplete data for traditional lipid profiles; patients who were taking lipid-lowering medication for more than 6 months; and patients with hypothyroidism or nephrotic syndrome.
The study protocol was approved by the Ethics Committee of our hospital. Because this retrospective case–control study was based on data from patient medical records, written informed consent was not obtained from the participants.
2.2. Diagnostic criteria
CAD was defined in accordance with the 1979 WHO diagnostic criteria, [14] and all of the patients underwent a CAG examination. The CAG examinations were performed using Judkin technique via the radial or femoral artery. Angiograms were analyzed by 2 experienced doctors who were blinded to this study. Control subjects were defined as those lacking typical angina pectoris symptoms and those in whom stenosis of the major coronary arteries was less than 50%. Essential hypertension (EH) and diabetes mellitus (DM) were defined according to features described in our previous report.[15] Briefly, EH was defined as systolic pressure ≥140 mm Hg and/or diastolic pressure ≥90 mm Hg and/or use of anti-hypertensive drugs. DM was defined as fasting glucose levels ≥7.0 mmol/L and/or use of antidiabetic drugs. Smoking was defined as daily cigarette smoking.
2.3. Statistical analysis
Continuous variables are presented as the mean ± standard deviation (SD) and were compared using an independent samples t test. Categorical variables are expressed as frequencies and percentages and were compared using a Chi-square test. The correlation between the AIP value and other variables was calculated by a Pearson correlation analysis. Both univariate and multivariate logistic regression analyses were performed to explore the relationship between the lipid parameters and risk of CAD. The adjusted odds ratio (OR) per 1 SD increase in the corresponding lipid variable and 95% confidence intervals (95% CIs) were calculated. All statistical analyses were performed with the Statistical Package for the Social Sciences (SPSS Inc., Chicago, IL) 17.0. A value of P < .05 in a 2-sided test was considered significant.
3. Results
3.1. Baseline characteristics of CAD patients and controls
Table 1 lists the baseline characteristics of the population. A total of 5387 subjects were included in our study, including 2935 (54.50%) CAD patients and 2452 (45.50%) controls. The mean age of patients was 62.16 ± 9.28 (age range: 34–39) years; 60.18% (3, 242) of them were male. The patients in the CAD group were older than those in the control group. The rate of smoking as well as histories of EH and DM were significantly higher in the CAD group.
Table 1.
Baseline characteristics of the involved population.
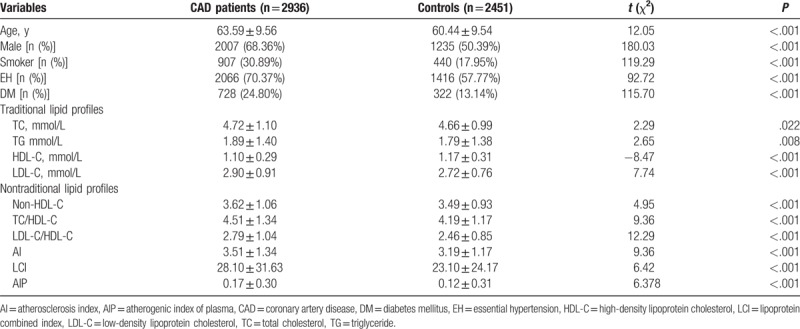
Compared with the controls, CAD patients had higher levels of TC, TG, and LDL-C. By contrast, the level of HDL-C was lower in CAD patients. The values of nontraditional lipid profiles, including non-HDL-C, TC/HDL-C, LDL-C/HDL-C, AI, LCI, and AIP, were all significantly higher in the CAD group than in the control group. In subgroup analyses that were stratified by gender, we found that all of the lipid profiles were associated with CAD risk in both males and females except for TG (Fig. 1).
Figure 1.
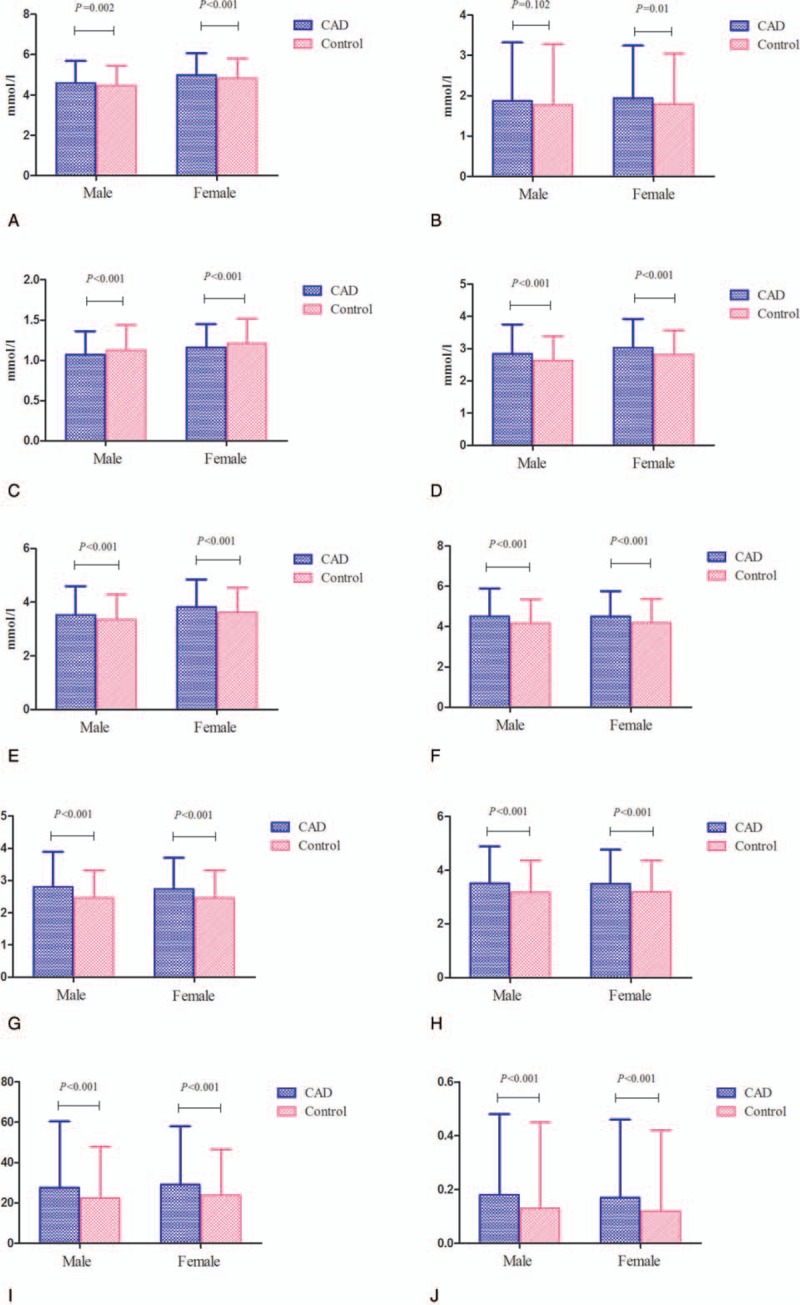
Associations between lipid parameters and CAD risk by gender (A: TC; B: TG; C: HDL-C; D: LDL-C; E: non-HDL-C; F: TC/HDL-C: G: LDL-C/HDL-C; H: AI; I: LCI; J: AIP).
3.2. Correlation analysis of AIP with other variables
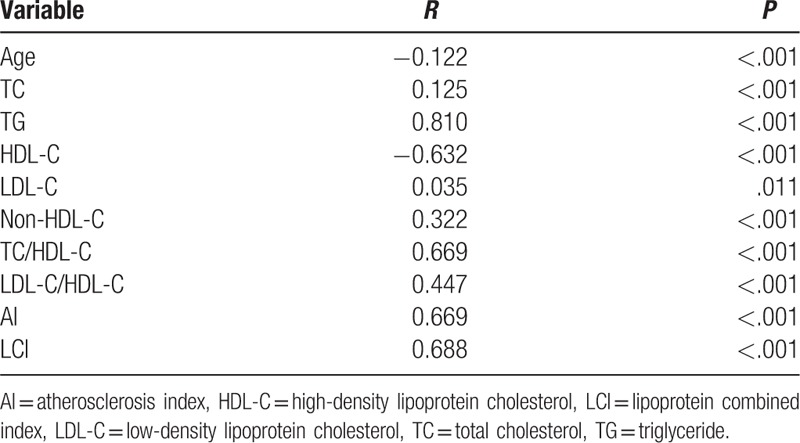
Pearson correlation analysis was performed to investigate the correlation of AIP with other continuous variables. As summarized in Table 2, AIP was positively and significantly correlated with TC (r = 0.125, P < .001), TG (r = 0.810, P < .001), LDL-C (r = 0.035, P < .001), non-HDL-C (r = 0.322, P < .001), TC/HDL-C (r = 0.669, P < .001), LDL-C/HDL-C (r = 0.447, P < .001), AI (r = 0.669, P < .001), and LCI (r = 0.688, P < .001) and was negatively correlated with age (r = −0.122, P < .001) and HDL-C (r = −0.632, P < .001).
Table 2.
Correlation between AIP and other variables.
3.3. Logistic regression analyses for AIP with CAD risk
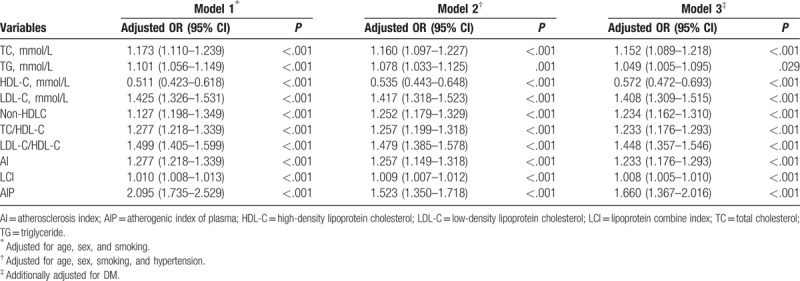
In the univariate logistic regression analysis, AIP was the lipid parameter that was most strongly associated with CAD with an unadjusted OR of 1.782 (95% CI: 1.490–2.131, P < .001) for an increase of 1-SD (Table 3). This association persisted after adjustments for some CAD risk factors (age, sex, smoking, EH, and DM) (Table 4).
Table 3.
Univariate logistic regression analyses for lipid parameters with CAD risk.
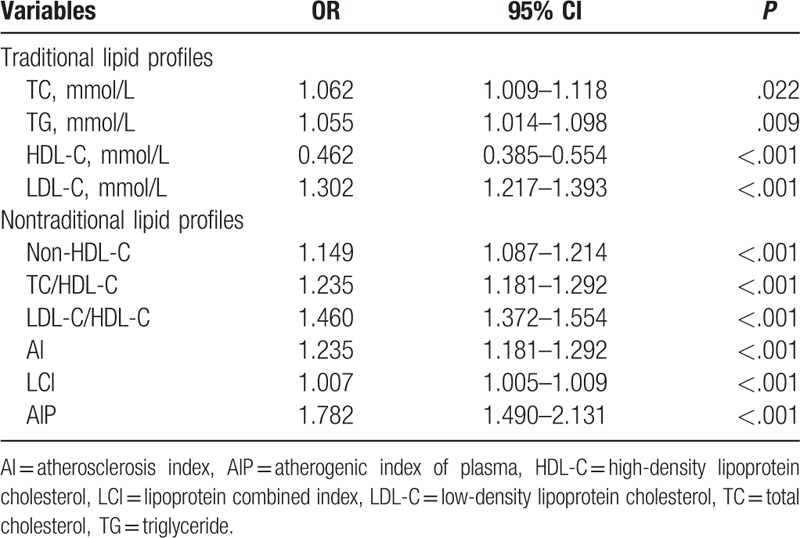
Table 4.
Multivariate logistic regression analyses for lipid parameters with CAD risk.
4. Discussion
The present study explored the relationship between AIP and CAD risk in the Chinese Han population. Our results revealed that AIP was a significant and independent predictor for CAD risk and might be better than traditional lipid parameters and other lipid ratios.
Studies have shown that dyslipidemia is one of the known risk factors for CAD.[4] The association between traditional lipid measures, including TC, LDL-C, and TG, has been well documented in their association with the incidence of CAD. In addition, lipid ratios, such as TC/HDL-C, LDL-C/HDL-C, AI and LCI, were also considered to be predictors for CAD. Because of the small particle size, small density LDL (sdLDL) more easily invades and deposits on the arterial wall compared with LDL and is easily oxidized to oxLDL. When oxLDL is phagocytized by macrophages, macrophages are converted to foam cells, further causing arteriosclerosis and cardiovascular disease. In recent years, several studies have found that sdLDL is an important marker for predicting arteriosclerosis, and its clinical use was recommended.[16] However, because of the complicated detection method and expensive costs, the detection of sdLDL is limited in clinical applications.
AIP, the logarithm of the molar ratio of TG to HDL-C, was first described by Dobiášová and Frohlich[17] in 2001; AIP has a stronger sensitivity that reflects the interaction between atherogenic and protective lipoprotein. A previous study showed that the value of AIP was inversely associated with the diameter of LDL-C particles and indicated the sdLDL particle size.[18] Therefore, AIP could be considered to be an economic and reliable indicator of CAD. There are some advantages in using AIP in clinical applications. First, after logarithmical transformation, AIP can correct for the lack of a normal distribution. Second, the value of AIP can be obtained by direct calculation and requires no extra cost. Third, AIP may indirectly serve as a surrogate of the particle size of LDL.
Several studies have demonstrated that AIP is associated with metabolic syndrome and increased with body weight.[19,20] In 2015, Zhu et al[21] conducted a meta-analysis to explore the relationship between lipid parameters and DM risk. They demonstrated that AIP was positively associated with DM and that the standardized mean difference was 1.78 (95% CI: 1.04–2.52); this was higher than traditional lipid parameters.[21] Other studies revealed that AIP was positively associated with blood uric acid and C-reaction protein and was strongly associated with oxidative stress.[22,23] In recent years, a growing body of evidence has indicated that AIP is a strong marker to predict the risk of CAD.
The value of AIP varies greatly in different ethnic populations.[24] In our study, the mean AIP level was 0.15 ± 0.34 (−1.7 to 1.55) in the overall population; this level was higher than that in a 40-year-old Slovak population (0.064 ± 0.310 in males and −0.150 ± 0.306 in females). Even in the same ethnic population, AIP also varied greatly. In another study conducted in a middle-aged Chinese population, the value of AIP was 0.092 ± 0.325 in the total population; this value was lower than our results.[20]
Our study found that AIP was inversely correlated with age, which was in agreement the results described by Hartopo et al.[13] Interestingly, a previous study conducted in a normal Chinese population suggested that AIP was associated with gender and increased with age.[25] Nansseu et al[12] also concluded that AIP was not associated with age. This discrepancy might partly be the result of the different selected populations. In our study, all participants were hospitalized and underwent a CAG examination. The average age was 62.16 ± 9.28 years in our study, different from the previous study. In China, older people pay more attention to lifestyle changes and actively control the intake of cholesterol; this may be another reason for the difference.
In 2016, Zhan et al[11] found that AIP was higher in Chinese patients with acute coronary syndrome than in controls, reflecting the lipid-driven inflammatory state in acute coronary syndrome. Compared with the study by Zhan et al,[11] our study has several advantages. First, the sample size in our study is larger (5378 vs 754). Second, we not only compared the relationship between the value of AIP and the risk of CAD but also compared the risk difference to CAD between AIP and other lipid parameters. In our study, we found that the value of AIP in the CAD group was higher than in controls (0.17 ± 0.30 vs 0.12 ± 0.31). The univariate logistic regression analysis revealed that AIP was the lipid parameter that was most strongly associated with CAD, with an unadjusted OR of 1.782 (95% CI: 1.490–2.131, P < .001), for an increase of 1-SD. Further, the multivariate logistic analysis models demonstrated that AIP was the most powerful predictor for CAD. In the correlation analysis, we found that AIP was most positively correlated with TG (r = 0.810, P < .001) and was negatively correlated with HDL-C (r = −0.632, P < .001). These findings were in agreement with previous studies.[9,25] Third, AIP might vary by gender.[26] In our study, we carried out subgroup analysis by gender and found that AIP was correlated with CAD risk either in males or in females.
Several limitations should be mentioned. First, the present study was a retrospective study. We could not obtain some useful data, such as waist circumference, body mass index, and physical activity. These data are associated with AIP and might affect the interpretation of the results. A prospective study with a good design should be carried out in the future. Second, the population of the study was from hospitalized patients undergoing a CAG examination; this population does not represent the general population.
Despite the limitations, our study concluded that AIP might be a strong and independent predictor for CAD in the Chinese Han population.
Acknowledgment
We thank all our colleagues at the Department of Cardiology, Wujin Hospital, affiliated with Jiangsu University.
Footnotes
Abbreviations: AI = atherosclerosis index, AIP = atherogenic index of plasma, CAD = coronary artery disease, DM = diabetes mellitus, EH = essential hypertension, HDL-C = high-density lipoprotein cholesterol, LCI = lipoprotein combined index, LDL-C = low-density lipoprotein cholesterol, TC = total cholesterol, TG = triglyceride.
Authorship: All authors have read the manuscript and agreed with the contents. GC conceived and designed the experiments; GC, GS, SX, and WL performed the experiments; GC analyzed the data, contributed reagents/materials/analysis tools, and wrote the paper.
Funding/support: This study was supported by the Jiangsu Youth Medical Talents Project (QNRC2016310), Changzhou Science and Technology Development (CJ20160004), and the Science and Technology Project of Wujin (WS201603).
The authors report no conflicts of interest.
References
- [1].Mathers CD, Loncar D. Projections of global mortality and burden of disease from 2002 to 2030. PLoS Med 2006;3:e442. [DOI] [PMC free article] [PubMed] [Google Scholar]
- [2].National Center for Cardiovascular Diseases, China. Report on Cardiovascular Diseases in China (2016). Beijing, China: Encyclopedia of China Publishing House; 2015. [Google Scholar]
- [3].Cai G, Zhang B, Shi G, et al. The associations between proprotein convertase subtilisin/kexin type 9 E670G polymorphism and the risk of coronary artery disease and serum lipid levels: a meta-analysis. Lipids Health Dis 2015;14:149. [DOI] [PMC free article] [PubMed] [Google Scholar]
- [4].Goliasch G, Wiesbauer F, Blessberger H, et al. Premature myocardial infarction is strongly associated with increased levels of remnant cholesterol. J Clin Lipidol 2015;9:801–6. [DOI] [PubMed] [Google Scholar]
- [5].Sniderman AD, Williams K, Contois JH, et al. A meta-analysis of low-density lipoprotein cholesterol, non-high-density lipoprotein cholesterol, and apolipoprotein B as markers of cardiovascular risk. Circ Cardiovasc Qual Outcomes 2011;4:337–45. [DOI] [PubMed] [Google Scholar]
- [6].Ridker PM, Rifai N, Rose L, et al. Comparison of C-reactive protein and low-density lipoprotein cholesterol levels in the prediction of first cardiovascular events. N Engl J Med 2002;347:1557–65. [DOI] [PubMed] [Google Scholar]
- [7].Gao M, Zheng Y, Zhang W, et al. Non-high-density lipoprotein cholesterol predicts nonfatal recurrent myocardial infarction in patients with ST segment elevation myocardial infarction. Lipids Health Dis 2017;16:20. [DOI] [PMC free article] [PubMed] [Google Scholar]
- [8].Zhu L, Lu Z, Zhu L, et al. Lipoprotein ratios are better than conventional lipid parameters in predicting coronary heart disease in Chinese Han people. Kardiol Pol 2015;73:931–8. [DOI] [PubMed] [Google Scholar]
- [9].Niroumand S, Khajedaluee M, Khadem-Rezaiyan M, et al. Atherogenic index of plasma (AIP): a marker of cardiovascular disease. Med J Islam Repub Iran 2015;29:240. [PMC free article] [PubMed] [Google Scholar]
- [10].Onat A, Can G, Kaya H, et al. Atherogenic index of plasma” (log10 triglyceride/high-density lipoprotein cholesterol) predicts high blood pressure, diabetes, and vascular events. J Clin Lipidol 2010;4:89–98. [DOI] [PubMed] [Google Scholar]
- [11].Zhan Y, Xu T, Tan X. Two parameters reflect lipid-driven inflammatory state in acute coronary syndrome: atherogenic index of plasma, neutrophil-lymphocyte ratio. BMC Cardiovasc Disord 2016;16:96. [DOI] [PMC free article] [PubMed] [Google Scholar]
- [12].Nansseu JR, Moor VJ, Nouaga ME, et al. Atherogenic index of plasma and risk of cardiovascular disease among Cameroonian postmenopausal women. Lipids Health Dis 2016;15:49. [DOI] [PMC free article] [PubMed] [Google Scholar]
- [13].Hartopo AB, Arso IA, Setianto BY. Low plasma atherogenic index associated with poor prognosis in hospitalized patients with acute myocardial infarction. Acta Med Indones 2016;48:106–13. [PubMed] [Google Scholar]
- [14].Nomenclature and criteria for diagnosis of ischemic heart disease. Report of the Joint International Society and Federation of Cardiology/World Health Organization task force on standardization of clinical nomenclature. Circulation 1979; 59:607–609. [DOI] [PubMed] [Google Scholar]
- [15].Cai G, Zhang B, Ma C, et al. Associations of rs3744841 and rs3744843 polymorphisms in endothelial lipase gene with risk of coronary artery disease and lipid levels in a Chinese population. PLoS One 2016;11:e0162727. [DOI] [PMC free article] [PubMed] [Google Scholar]
- [16].National Cholesterol Education Program (NCEP) Expert Panel on Detection, Evaluation, and Treatment of High Blood Cholesterol in Adults (Adult Treatment Panel III). Third Report of the National Cholesterol Education Program (NCEP) Expert Panel on detection, evaluation, and treatment of high blood cholesterol in adults (Adult Treatment Panel III) final report. Circulation 2002; 106: 3143–3421. [PubMed] [Google Scholar]
- [17].Dobiášová M, Frohlich J. The plasma parameter log (TG/HDL-C) as an atherogenic index: correlation with lipoprotein particle size and esterification rate in apoB-lipoprotein-depleted plasma (FERHDL). Clin Biochem 2001;34:583–8. [DOI] [PubMed] [Google Scholar]
- [18].Frohlich J, Dobiasova M. Fractional esterification rate of cholesterol and triglycerides to HDL-cholesterol are powerful predictors of positive findings on coronary angiography. Clin Chem 2003;4911:1873–80. [DOI] [PubMed] [Google Scholar]
- [19].Pourfarzam M, Zadhoush F, Sadeghi M. The difference in correlation between insulin resistance index and chronic inflammation in type 2 diabetes with and without metabolic syndrome. Adv Biomed Res 2016;5:153. [DOI] [PMC free article] [PubMed] [Google Scholar]
- [20].Shen S, Lu Y, Dang Y, et al. Effect of aerobic exercise on the atherogenic index of plasma in middle-aged Chinese men with various body weights. Int J Cardio 2017;230:1–5. [DOI] [PubMed] [Google Scholar]
- [21].Zhu XW, Deng FY, Lei SF. Meta-analysis of atherogenic index of plasma and other lipid parameters in relation to risk of type 2 diabetes mellitus. Prim Care Diabetes 2015;9:60–7. [DOI] [PubMed] [Google Scholar]
- [22].Adejumo OA, Okaka EI, Okwuonu CG, et al. Serum C-reactive protein levels in pre-dialysis chronic kidney disease patients in southern Nigeria. Ghana Med J 2016;50:31–8. [DOI] [PMC free article] [PubMed] [Google Scholar]
- [23].Amrita J, Mahajan M, Bhanwer AJ, et al. Oxidative stress: an effective prognostic tool for an early detection of cardiovascular disease in menopausal women. Biochem Res Int 2016;2016:1–7. [DOI] [PMC free article] [PubMed] [Google Scholar]
- [24].Cheah WL, Chang CT, Hazmi H, et al. Gender and racial differences in the cardiovascular risk factors among overweight and obese rural adults, Kuching and Samarahan division, Sarawak, Malaysia. J Nutr Metab 2016;2016:1–6. [DOI] [PMC free article] [PubMed] [Google Scholar]
- [25].Wang YM, Chen XF, Yuan Q. Analysis on levels of non-high density lipoproterin cholesterol and atherogenic index of plasma in normal population. Zhejiang Prev Med 2008;20:10–4. [Google Scholar]
- [26].Rašlová K, Dobiášová M, Hubáček JA, et al. Association of metabolic and genetic factors with cholesterol esterification rate in HDL plasma and atherogenic index of plasma in a 40 years old Slovak population. Physiol Res 2011;60:785–95. [DOI] [PubMed] [Google Scholar]


