

Abstract
Hyperglycemia-mediated, nonenzymatic collagen cross-links such as pentosidine (PENT) can have deleterious effects on cellular interactions with the extracellular matrix (ECM). Present techniques to quantify PENT are limited, motivating the need for improved methods to study the accumulation and contribution of PENT toward diabetic clinical challenges such as impaired bone healing. Current methods for studying PENT are destructive, laborious, and frequently employ oversimplified collagen films that lack the complexity of the native ECM. The primary goal of this study was to evaluate the capacity of time-resolved fluorescence spectroscopy (TRFS) to detect PENT in cell-secreted ECMs possessing enhanced compositional complexity. To demonstrate an application of this method, we assessed the response of human mesenchymal stem cells (MSCs) to cross-linked substrates to explore the role of detected PENT on osteogenic differentiation. We exposed MSC-secreted decellularized matrices (DMs) to 0.66 M ribose for 2 weeks and used TRFS to detect the accumulation of PENT. Ribose treatment resulted in a 30 nm blue shift in peak fluorescence emission and a significant decrease in average lifetime compared to that of control DMs (4.4 ± 0.3 ns vs 3.5 ± 0.09 ns). Evaluation of samples with high performance liquid chromatography (HPLC) confirmed that changes in observed fluorescence were due to PENT accumulation. A strong correlation was found between TRFS parameters and the HPLC measurement of PENT, validating the use of TRFS as an alternative method of PENT detection. Osteoblastic gene expression was significantly reduced in MSCs seeded on ribose DMs at days 7 and 14. However, no significant differences in calcium deposition were detected between control and ribose DMs. These data demonstrate the efficacy of nondestructive fluorescence spectroscopy to examine the formation of nonenzymatic collagen cross-links within biomimetic culture platforms and showcase one example where an improved biomimetic substrate can be used to probe cell-ECM interactions in the presence of collagen cross-links.
Keywords: collagen cross-links, decellularized matrices, mesenchymal stem cells, optical imaging, fluorescence lifetime
Graphical abstract

Introduction
Diabetes mellitus is a growing health epidemic affecting 382 million people worldwide; this number is predicted to rise to 592 million by 2035.1 Patients diagnosed with diabetes, either type 1 or 2, are vulnerable to increased fracture risk.2 Compared to normoglycemic patients, diabetics suffer from delayed union with a 163% increase in fracture healing time,3 potential bone nonunion,4,5 and spend additional time in the hospital after fracture-related surgeries.6 Despite a clear correlation between diabetes and diminished fracture repair, the mechanism of impaired bone healing in diabetics remains unclear.
The extracellular matrix (ECM) contains sites to promote cell adhesion, survival, and differentiation. Nonenzymatic glycation of long-lived ECM proteins such as type I collagen has been implicated in reduced bone formation.4,7 Exposure of collagen to reducing sugars in a diabetic environment catalyzes the formation of advanced glycation end products (AGEs). Sugar molecules react with lysine and arginine residues on collagen to form autofluorescent cross-links with pentosidine (PENT) as a measurable biomarker of AGEs in collagen.8 Local application of AGE-modified proteins to a bone defect reduced bone healing in diabetic mice, suggesting that the formation of AGEs due to chronic hyperglycemia may contribute to defective bone healing in diabetics.7 In vitro glycation of a collagen I matrix reduced adhesion, growth, and differentiation potential of osteoblasts.9 However, such collagen films fail to recapitulate the complex milieu of native human ECM. A bone fracture initiates an inflammatory response that recruits mesenchymal stem cells (MSCs) to the injury site,4 yet the effect of hyperglycemia-induced glycation on human MSCs is poorly characterized. Therefore, there is a need for an improved model system that facilitates understanding of the interaction of these progenitor cells with a more biomimetic ECM.
Cell-secreted decellularized matrices (DMs) represent an exciting culture platform that mimics the biological complexity of natural ECM. We previously described the synthesis of MSC-derived DMs10–12 containing several components present in bone ECM that play critical roles in cell adhesion and matrix mineralization. DMs can also regulate cell phenotype by enhancing the osteogenic potential of MSCs.11–13 Thus, DMs provide an improved substrate compared to substrates of a single ECM protein to study the ECM contribution toward cell function.
High performance liquid chromatography (HPLC) is the gold standard for the detection of collagen cross-links. However, HPLC is destructive, time intensive, unable to longitudinally probe the dynamic formation of collagen cross-links, and requires considerable time and cost to process samples and large sample volumes. Time-resolved fluorescence spectroscopy (TRFS) provides a rapid, nondestructive, and noninvasive alternative to detect changes in biochemical composition of the ECM. TRFS measures changes in tissue autofluorescence, which arise from endogenous structural proteins (e.g., collagen and elastin), amino acids, coenzymes, lipids, and collagen cross-links.14 Distinct spectroscopic parameters (i.e., intensity, spectral shift, and lifetime) derived from TRFS examination of engineered cartilage and bone constructs can be correlated to their biochemical composition, including collagen and collagen cross-links.15–17 Moreover, time-resolved measurements provide an additional contrast mechanism to differentiate fluorophores with overlapping emission spectra.14 Thus, TRFS provides a fast, nondestructive technique to assess biochemical properties of tissue-engineered platforms. However, to our knowledge, a direct correlation between specific collagen cross-links in engineered tissues and TRFS features has not been reported.
The goals of this study were to examine the ability of TRFS to detect the presence of PENT in engineered DMs and determine the effect of these cross-links on the adhesion, proliferation, and osteogenic potential of MSCs. We induced nonenzymatic crosslinks in MSC-secreted DMs, assessed cross-link formation by TRFS, and verified these results with HPLC. These findings validate the use of TRFS as a nondestructive means to detect collagen cross-links in engineered matrices while demonstrating the application of a biomimetic substrate for probing the role of PENT in MSC response.
Materials and Methods
Cell Culture
Human bone-marrow derived MSCs (Lonza, Walkersville, MD) were expanded without further characterization in growth medium (GM) consisting of minimum essential alpha medium (α-MEM; Invitrogen, Carlsbad, CA) supplemented with 10% fetal bovine serum (FBS; Atlanta Biologicals, Atlanta, GA) and 1% penicillin/streptomycin (Gemini Bio-Products, West Sacramento, CA). Cells were cultured under standard conditions (37 °C, 21% O2, and 5% CO2) and utilized at passages 5–6 (passage 5 for osteogenic response studies and passage 6 to deposit matrix and prepare DMs). The medium was further supplemented with 50 μg/mL ascorbate-2-phosphate (A2P) for one passage prior to experimental use to prime cells for enhanced matrix deposition.10–12
For experiments examining the effect of PENT on osteogenic differentiation, cells were initially seeded in GM and exposed to osteogenic medium (OM: GM supplemented with 10 mM β-glycerophosphate, 50 μg/mL A2P, and 100 nM dexamethasone) after 24 h. Media was replaced every 2–3 days.
Preparation of DMs
MSCs were seeded on 6-well plates at 50,000 cells/cm2 and cultured in supplemented media (SM: α-MEM + 50 μg/mL ascorbate-2-phosphate (A2P)) for 10 days under standard culture conditions, with media changes performed every 2–3 days. Wells were decellularized as previously described.10–13 Briefly, wells were rinsed with phosphate-buffered saline (PBS) and treated with 0.5% Triton X-100 (Sigma, St. Louis, MO) in 20 mM NH4OH in PBS for 5 min at 37 °C. Wells were rinsed with PBS and treated with DNase (Sigma, 150 units/mL PBS) for 1 h at 37 °C, and then rinsed with PBS again. Plates were allowed to dry in a sterile biosafety cabinet for 18 h and used for subsequent studies within 48 h.
Formation of PENT Cross-Links within DMs
DMs were incubated in either (1) 100 mg/mL ribose in HBSS/1.3 mM CaCl2 (ribose DM),18 or (2) HBSS alone (control DM, negative control) at 37 °C (21% O2 and 5% CO2) for up to 2 weeks (Figure 1A). Ribose solutions or buffer were changed every 3–4 days to maintain a fresh supply of glycating sugars. All solutions were also supplemented with 1% antibiotic/antimycotic solution (Mediatech, Manassas, VA) before each buffer change to prevent microbial growth.
Figure 1.

Schematic for the experimental procedure. (A) MSC-secreted ECM was incubated in ribose for up to 14 days to induce PENT formation. (B) Cross-linked DMs were subjected to TRFS at 0, 7, and 14 days after ribose treatment. Raw fluorescence signal was processed to obtain fluorescence emission spectra and average lifetime data.
SEM Characterization of DM Morphology
DM morphology before and after cross-linking was analyzed by scanning electron microscopy (SEM). Control DMs at day 0 (D0) and ribose DMs after 14 days of culture (D14) were fixed in 1 mL of Karnovsky's fixative (2.5% paraformaldehyde + 2% glutaraldehyde in 0.08 M sodium phosphate buffer, pH 7.2) for 3 h and then serially dehydrated by rinsing in 30%, 50%, and 70% ethanol for 15 min each, followed by three 15 min rinses each in 95% and 100% ethanol at room temperature. Pieces (1 cm2) of DMs were cut out of 6-well plates using a laser cutter prior to critical point drying and sputter coating samples with gold. Samples were imaged using a scanning electron microscope equipped with a field emission gun at 5 kV.
Assessment of Fluorescence within DMs Using TRFS
To evaluate compositional changes, optical measurements of DMs were performed at 0, 7, and 14 days after ribose incubation by placing samples on a nonfluorescent flat surface. The TRFS system used in this study is described in detail elsewhere (Figure 1B).19 Briefly, a pulsed nitrogen laser (337 nm, 800 ps pulse width, and 3 μJ/pulse energy, repetition rate 30 Hz; MNL205, LTB Lasertechnik Berlin, Berlin, Germany) was used as the excitation source with a bifurcated fiber-optic probe (one central fiber for excitation and a ring of 14 fibers around the central fiber for autofluorescence collection) for noncontact measurements. Emitted fluorescence was dispersed by a spectrometer (MicroHR, Horiba Jobin Yvon, Edison, NJ), and time-resolved measurements were made at discrete wavelengths ranging from 360 to 600 at 5 nm step intervals. The output light from the spectrometer was detected by a multichannel plate photomultiplier tube (R3809U-50, 180 ps rise time, Hamamatsu, Bridgewater, NJ) and amplified by a preamplifier (C5594-12, 1.5 GHz bandwidth, Hamamatsu, Bridgewater, NJ). A fast digital oscilloscope (DPO 7254, 2.5 GHz bandwidth, 20G samples/s; Tektronix, Richardson, TX) then digitized the signal, and a delay generator (DG535; Stanford Research Systems, Sunnyvale, CA) was used as the trigger source to synchronize excitation laser and data acquisition. The measured fluorescence intensity decay was deconvolved from the instrument response to estimate fluorescence decay characteristics using a fast constrained least-squares Laguerre based deconvolution method previously reported.20 The computed average fluorescence lifetime and intensity values are presented as a function of wavelength. The fluorescence emission (spectral and lifetime characteristics) of PENT (Cayman Chemicals, Ann Arbor, MI) was used as a reference for TRFS measurements.
Measurement of PENT Formation via HPLC
After hydrolyzing the samples in 6 N HCl at 110 °C for 20 h and removing the acid, the hydrolysates were prepared for two different high performance liquid chromatography (HPLC) assays. For the measurement of PENT, half the hydrolysate was resuspended in HPLC-grade water with 0.25 μg/mL pyridoxine (PYR) as the internal standard and then mixed with a dilution buffer (1:1) consisting of 10% (v/v) HPLC-grade acetonitrile (ACN) and 0.5% (v/v) heptafluorobutyric acid (HFBA). A portion of each sample, as well as cross-link standards that included pyridinoline (PYD) and deoxypyridinoline (DPD) along with PENT and pyridoxine, was injected onto a reversed-phase, silica-based column (Waters Spherisorb 5 μm ODS2, Milford, MA). With the HPLC system (Beckman-Coulter System Gold 126, Brea, CA) pumping 0.22% HFBA (solvent A) and 100% ACN (solvent B) in an isocratic mode, there was a change after the elution of PYR, PYD, and DPD from 83/17 to 75/25 (%) of solvents A/B, thereby eluting PENT. In generating the chromatogram, mature enzymatic cross-links and PYR were detected at 295/400 nm (excitation/emission), while PENT was detected at 248/378 nm (Waters 2475 Multi λ Fluorescence Detector).
The other half of the hydrolysate, along with 0.446 mM of α-aminobutyric acid (α-ABA) as the internal standard, was derivatized with ∼30 μL of phenyl isothiocyanate (PITC)–triethylamine (TEA)–water– ethanol (1:1:1:7) solution after redrying in 500 μL of ethonal–H2O– TEA (2:2:1), and then the dry sample was resuspended with a diluent solution of 0.071% NaH2PO4 (in 5% ACN).21 Aportion of each sample as well as amino acid standards that included derivatized proline and hydroxyproline along with α-ABA was injected onto a different reversed-phase column (Waters Pico·Taq). With the same HPLC system pumping 1.9% sodium-acetate-trihydrate (in 0.05% ACN) (solvent C) and 60% ACN (solvent D) in gradient mode, there was linear change from 100/0 to 50/50 (%) of solvents C/D over 8 min to elute the amino acids. A UV detector (Beckman-Coulter 168 Detector) generated the chromatogram. After a linear conversion of hydroxyproline to collagen (7.5 × mass of hydroxyproline ÷ molecular weight of collagen type I), the amount of the cross-link was normalized as mmol of PENT per mol of collagen.
Quantitative Characterization of DM Composition Using Mass Spectrometry
Protein-works protein profiling service (unfractioned) was performed by MS Bioworks LLC (Ann, Arbor, MI) on control and ribose DMs (n = 2). DMs were collected in 0.02 N acetic acid and homogenized by sonication on ice. Samples were concentrated by vacuum centrifugation and neutralized to 100 mM Tris HCl, pH 8.5, before loading onto a 10% Bis-Tris SDS–PAGE gel (Novex, Invitrogen) and separating approximately 1 cm. The gel was stained with Coomassie stain, and the entire mobility region excised into one segment and digested with trypsin using a robot (ProGest, DigiLab, Marlborough, MA). Digests were then analyzed by nano LC/MS/MS with a Waters NanoAcquity HPLC system interfaced to a ThermoFisher Q Exactive. Peptides were loaded on to a trapping column and eluted over a 75 μm analytical column at 350 nL/min; both columns were packed with Proteo Jupiter resin (Phenomenex, Torrance, CA). A 1 h gradient was employed, and the mass spectrometer was operated in data-dependent mode, with MS and MS/MS performed in the Orbitrap at 70,000 fwhm and 17,500 fwhm resolution, respectively. The 15 most abundant ions were selected for MS/MS. Data were searched using a local copy of Mascot with the following parameters: enzyme, trypsin; database, Swissprot Human (forward and reverse appended with common contaminants); fixed modification, carbamidomethyl (C); variable modifications, oxidation (M), acetyl (protein N-term), Pyro-Glu (N-term Q), deamidation (NQ); mass values, monoisotopic; peptide mass tolerance, 10 ppm fragment mass tolerance, 0.02 Da; max missed cleavages, 2. Mascot DAT files were parsed into the Scaffold software for validation, filtering, and to create a nonredundant list per sample. Data were filtered 1% protein and peptide FDR and requiring at least two unique peptides per protein.
Characterization of MSC Response to Cross-Linked DMs
Human MSCs at passage 5 were seeded on control and ribose DMs to examine cell response to PENT. To test the effect of PENT on cell adhesion to DMs, MSCs were seeded at 30,000 cells/cm2 in GM and allowed to attach for 4 h. Wells were then rinsed vigorously with PBS to remove nonadherent cells. The remaining live cells were stained with Calcein AM (Invitrogen) following the manufacturer's instructions. Cells were collected in passive lysis buffer (Promega, Madison, WI) to release fluorescent Calcein AM. The fluorescence intensity of 100 μL lysate samples was measured at 485/528 (ex/em) using a microplate reader (Synergy HTTR, Wisnooski, VT).22 A titration curve was generated using known cell concentrations to establish a correlation between cell number and fluorescence intensity (data not shown). To interrogate integrin expression, another set of samples treated in the same manner as described above were collected after 4 h in TRIzol reagent (Invitrogen) for PCR analysis. Samples were homogenized and the RNA fraction separated from DNA and protein phases following the manufacturer's protocol. Post-phase-separation, total RNA was isolated using an RNEasy micro kit (Qiagen, Valencia, CA). About 600 ng of total RNA was reverse transcribed with the QuantiTect Reverse Trascription kit (Qiagen). qPCR was performed using a QuantiFast Probe PCR kit (Qiagen) on a CFX96 Real-Time System. Primers and probes for RPL13 (HS00204173_m1), ITGA2 (HS00158127_m1), ITGB1 (HS00559595_m1), ITGA5 (HS01547673_m1), ITGAV (HS00233808_m1), and ITGB3 (HS01001469) were purchased from Applied Biosystems (Foster City, CA). Amplification conditions were 95 °C for 3 min, followed by 40 cycles at 95 °C for 3 s and 60 °C for 30 min. Quantitative PCR results were normalized to RPL13 transcript levels to yield ΔCt, and fold change in expression relative to the housekeeping gene was calculated using 2−ΔCt.23,24
To probe the effect of PENT on changes in cytoskeletal tension, MSCs were seeded at 7,500 cells/cm2 in GM on control D14 DMs and ribose D14 DMs. Twenty-four hours after seeding, culture medium was removed, and plates were gently washed twice with HBSS. Cells were fixed in 10% buffered formalin for 10 min at room temperature, permeablized in 0.1% Triton X/HBSS for 5 min at room temperature, and blocked with 1% BSA/HBSS for 30 min at 37 °C. Cells were first incubated in 0.165 μM rhodamine phalloidin (Life Technologies, Foster City, CA) for 30 min in the dark at room temperature to visualize the actin cytoskeleton. Then, samples were incubated in 1 μM SYTOX Green (Life Technologies) for 12 min in the dark at room temperature to visualize cell nuclei. Fluorescent images were acquired using a Nikon Eclipse TE2000-U fluorescent microscope (Melville, NY) and Andor Zyla digital camera (Oxford Instruments, Abingdon, Oxfordshire, UK). Cell area was quantified using Nikon Instruments Software (NIS) Elements; 11–19 cells were counted per image. Cell area was then converted from pixels to μm2 in ImageJ. Cell area for all cells from 3 separate images were pooled per group.
To examine the effect of PENT on osteogenic differentiation, MSCs were seeded at 30,000 cells/cm2 on control D14 DMs and ribose D14 DMs within 48 h of ribose cross-linking and cultured in OM for 14 days under standard culture conditions. Cells were lysed in passive lysis buffer and assessed for DNA content as previously described.23,25 Briefly, cells were rinsed in PBS and collected in passive lysis buffer. Samples were centrifuged at 5,000 rpm for 10 min to pellet the cell debris, and the supernatant was collected. The supernatant was analyzed for DNA content using the Quant-iT PicoGreen dsDNA Assay Kit (Invitrogen) following the manufacturer's instructions. DNA values were converted to cell number via a DNA titration curve of known cell numbers (data not shown). After rinsing with PBS, calcium deposited in each well was collected using a cell scraper and incubated overnight at 37 °C. Calcium deposition was quantified by reacting with o-cresolphthalein complex-one as previously described.23,26 Gene expression was analyzed from a separate set of samples treated in the same manner for PCR analysis. Primers for RUNX2 (HS00231692_m1), SP7 (HS01866874_s1), and COL1A1 (HS00166657_m1) were used (Applied Biosystems) as described above.
Statistical Analysis
Data are presented as the mean ± standard deviation unless otherwise stated. Statistical analysis was performed using Student's t tests, one-way ANOVA, and two-way ANOVA with Tukey's multiple comparison posthoc test, where applicable. Pearson's correlation coefficient tests were run to establish relationships between TRFS and HPLC findings. All statistical analysis was performed in Prism 6 software (GraphPad, San Diego, CA), and p values less than 0.05 were considered statistically significant.
Results
SEM Characterization of DM Morphology
A dense network of highly unorganized collagen fibrils was observed in SEM images of control D0 DMs (Figure 2A). Ribose D14 DMs exhibited a network of collagen fibrils similar to that seen in control DMs. We also observed heterogeneous coalescence of fibrils into bigger bundles in cross-linked DMs (Figure 2B).
Figure 2.

DM morphology visualized by SEM. (A) Representative SEM image of control D0 DMs reveals a dense network of unorganized collagen fibrils. (B) Ribose D14 DMs exhibit a similar collagen network with some coalescence of collagen fibrils into larger bundles. Collagen bundles are denoted by red arrows.
Changes in DM Composition Following Ribose Treatment Are Evident by TRFS
The fluorescence emission of control D0 DMs was characterized by a broad emission spectrum (425 ± 5 nm peak emission) and lifetime that exhibited higher values at emission wavelengths below 390 nm (4.4 ± 0.3 ns) relative to the longer wavelengths (3.4 ± 0.3 ns) (Figure 3). In contrast, the fluorescence emission of PENT was characterized by a relatively narrow spectrum (380 nm peak emission) with constant lifetime (3.6 ns) across the emission spectrum. Ribose treatment of DMs induced significant changes in DM fluorescence characteristics over time. In the spectral domain, ribose addition resulted in a 25 and 30 nm blue shift in peak fluorescence emission (toward PENT peak emission) of ribose D7 (400 ± 0 nm) and ribose D14 (395 ± 0 nm) DMs relative to control D0 DMs (425 ± 5 nm), respectively (Figure 3A,B). This spectral shift was associated with a decrease in the average lifetime values at emission wavelengths below 390 nm of ribose D7 (3.7 ± 0.03 ns) and ribose D14 (3.5 ± 0.09 ns) DMs relative to control D0 DMs (4.4 ± 0.3 ns) (Figure 3C,D). These lifetime values were similar to those determined for PENT (Figure 3C,D). Interestingly, an opposite trend was observed for the emission wavelengths larger than 390 nm where the cross-linked DMs exhibited much higher lifetime values with respect to control D0 DMs. No changes in the fluorescence emission characteristics were observed for control DMs at days 0, 7, and 14 (data not shown).
Figure 3.

Ribose treatment of DMs leads to significant blue shift in peak fluorescence emission and reduction in average lifetime as observed by TRFS. (A) Normalized fluorescence emission spectra of control D0 DMs, ribose D7 DMs, ribose D14 DMs, and PENT. (B) Quantification of peak fluorescence emission. Chart values represent the mean ± SD for n = 3; ***p < 0.001 and ****p < 0.0001 vs control D0 DMs. Standard deviations for control D7 and D14 DM are zero. (C) Average lifetime of control D0 DMs, ribose D7 DMs, ribose D14 DMs, and PENT. Figure inset represents the average lifetime from 360 to 390 nm (region with the highest contribution from PENT). (D) Quantification of average lifetime between 360 and 390 nm. Chart values represent the mean ± SD for n = 3; **p < 0.01 vs control D0 DM. Only one sample of pure PENT was measured.
Fluorescence Changes Are Due to PENT Formation and Not Changes in Collagen Content
Figure 4A illustrates representative HPLC chromatograms from control D0 DMs and ribose D14 DMs. Control D0 DMs had low levels of PENT compared to distinct, strong elution of PENT in ribose D14 DMs (Figure 4A). In agreement with the TRFS data, PENT formation in ribose DMs increased as a function of time (Figure 4B). Quantitative analysis of PENT/mmol of collagen revealed significantly higher levels of PENT in ribose D7 and ribose D14 DMs compared to that of control DMs at all time points (Figure 4B). We also analyzed both groups for the presence of mature enzymatic cross-links such as pyridinoline (PYD) and deoxypyridinoline (DPD). No detectable amounts of these hydroxylysyl and lysyl residue cross-links were found in control or ribose DMs (Figure 4A).
Figure 4.
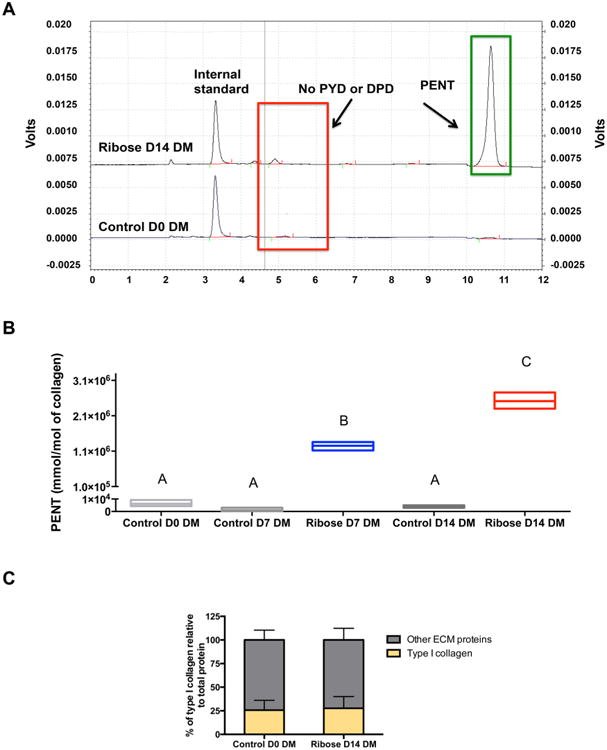
Fluorescence changes are due to the formation of PENT and not due to changes in collagen content. (A) Representative chromatograms of control D0 and ribose D14 DMs plotted on the same graph. The chromatogram for ribose D14 DMs is offset by 0.75 V. (B) PENT concentration determined via HPLC at days 0, 7, and 14 after ribose incubation. (C) Percentage of collagen in control and ribose DMs as assessed by mass spectrometry. Chart values for PENT quantification represent the mean ± SD for n = 3; floating bars not connected by the same letter are significantly different (p < 0.0001). Chart values for the percentage of collagen represent the mean of two distinct mass spectrometry experiments.
Since changes in fluorescence pattern can also be caused by differences in the amount of collagen present, we quantitatively analyzed the composition of control D0 DMs and ribose D14 DMs via mass spectrometry. We found comparable amounts of type I collagen (26 ± 10.4% and 27 ± 12.4% of total ECM proteins) in both control and ribose D14 DMs (Figure 4C).
HPLC Findings Correlate Strongly with TRFS Parameters
Pearson's correlation tests were performed to determine the correlation of PENT as detected by HPLC with fluorescence emission peaks and average lifetime as measured by TRFS. HPLC measurements of PENT/mmol of collagen showed significant and high correlation with both fluorescence peak wavelength (Figure 5A, r = −0.9341) and average lifetime (Figure 5B, r = −0.8955) over 375/15 nm.
Figure 5.

TRFS parameters (peak fluorescence emission and average lifetime) correlate with HPLC findings. Correlation between (A) peak fluorescence emission and mmol of PENT/mol of collagen (Pearson r = −0.9341, p < 0.05) and between (B) average lifetime and mmol of PENT/mol of collagen (Pearson r = −0.8955, p < 0.05).
MSC Adhesion Is Increased in the Presence of PENT
MSC adhesion was increased, by 9% on average, in MSCs seeded on ribose D14 DMs compared to that of control D14 DMs (Figure 6A–C). To probe the underlying contribution to differences in adhesion, we measured mRNA expression of integrins α2, α5, αv, β1, and β3, common integrins required for adhesion of MSCs to extracellular matrix proteins. No significant differences were observed in mRNA expression of any of these integrins in MSCs seeded on either DM (Figure 6D–H).
Figure 6.

PENT increases the adhesion of MSCs to cross-linked DMs. (A,B) Fluorescence microscopy images of cell morphology for MSCs stained with calcein AM. (C) Cell number attached to DMs 4 h after cell seeding. (D–F) Gene expression of integrins involved in MSC adhesion to DMs. Chart values represent the mean ± SD for n = 3–6; *p < 0.05 vs control DM.
PENT Cross-Linking of DMs Alters MSC Function
We investigated the effect of PENT on cytoskeletal tension and cell morphology in MSCs seeded on control D14 DMs and ribose D14 DMs by staining for F-actin 1 day after cell seeding. At this early time point and compared to cells seeded on control DMs (Figure 7A), MSCs seeded on ribose DMs (Figure 7B) appeared less elongated and exhibited increased area (Figure 7C).
Figure 7.

Changes in cytoskeletal tension of MSCs are observable due to the presence of PENT in DMs. MSCs were seeded on (A) control and (B) ribose DMs, and F-actin and nuclei were visualized using rhodamine phalloidin (red) and SYTOX green nuclear stain (green), respectively. (C) Cell area was quantified and converted from pixels to μm2 in ImageJ. Chart values represent the mean ± SD for n = 50 cells for control D14 DMs and n = 49 for ribose D14 DMs; ****p < 0.0001 vs control D14 DMs.
Cell number was not significantly different between control and ribose DMs at days 1, 7, or 14 (Figure 8A). We analyzed the gene expression of two key transcription factors essential for osteogenic differentiation (SP7 and RUNX2) as well as a late marker of osteogenic differentiation (COL1A1) over 14 days in MSCs. While RUNX2 levels were similar in both groups over time (Figure 8B), SP7 and COL1A1 expression was significantly reduced in cells seeded on ribose DMs at days 7 and 14, respectively (Figure 8C,D). However, calcium deposition, a functional and late marker of osteogenic differentiation, was similar for MSCs on ribose DMs at days 7 and 14 (Figure 8E).
Figure 8.

Cross-linking of DMs for 14 days alters the osteogenic potential of MSCs. (A) Cell number, (B–D) osteogenic gene expression, and (E) calcium deposition of MSCs after 0, 7, and 14 days of incubation on control and ribose DMs. Chart values represent the mean ± SD for n = 4–5 for cell number and calcium deposition, n = 6 for gene expression; ***p < 0.001 and ****p < 0.0001 vs control DMs all within same day.
Discussion
In this study, we induced PENT in cell-secreted DMs and validated the use of an optical spectroscopy technique for detecting cross-link formation. To demonstrate an application of the biomimetic substrate characterized here, we then examined the response of MSCs to cross-linked DMs to explore the effect of detected PENT on progenitor cells instrumental in bone repair. Diabetic patients suffer from impaired bone formation and increased healing time after a bone fracture. While the precise mechanism of impaired bone healing in diabetic patients is unknown, the accumulation of AGEs has been correlated to reductions in bone repair.7 Previous models for investigating cellular response in hyperglycemic conditions include rat-tail collagen thin films, cadaveric bovine bone, and streptozotocin-induced diabetic animals. While collagen films do not represent the complex composition of human ECM, diabetic animals do not facilitate the direct investigation of MSC interaction with cross-linked ECM. These caveats necessitate the development of a biomimetic ECM that can be glycated in vitro to mimic the diabetic microenvironment during fracture healing, as well as the development of technologies to accurately quantify the presence of distinct cross-links within the ECM.
While a variety of reducing sugars can be used for in vitro glycation of collagen, we selected ribose as it facilitates nonenzymatic cross-link formation 25 times faster than glucose.8,27 Previously, we demonstrated the feasibility of monitoring temporal changes in ECM composition of equine adipose stem cells differentiated toward the chondrogenic lineage using TRFS.16 Collagen content in engineered cartilage constructs was also detected using TRFS and correlated to mechanical properties.17 On the basis of our current mass spectrometry data and previous publications from our group and others, type I collagen is the major component of DMs.11,28 The peak fluorescence emissions of control D0 DMs occurred at 425 nm, which is consistent with values in the literature.29 We did not detect any change in the fluorescence emission spectrum in control DMs incubated for 14 days in HBSS, indicating that buffer incubation did not cause any biochemical changes. However, temporal quantification of fluorescence in ribose DMs exhibited a significant blue shift in peak emission relative to that of control D0 DMs, alluding to the formation of a new autofluorescent molecule. The fluorescence emission spectrum of PENT, which exhibited a peak emission at shorter wavelengths than that of control DMs, was in agreement with the blue shift we observed due to ribose treatment. Average lifetime measurements corroborated trends in the fluorescence emission spectra; cross-linked DMs exhibited lifetime values similar to that of PENT and significantly lower than that of control DMs. Others have also reported a decrease in average fluorescence lifetime due to glycation of collagen gels with ribose.30 Formation of greater amounts of PENT would therefore reduce the overall lifetime of ribose DMs over 375/15 nm, approaching the lifetime of PENT. We analyzed quantitative differences in average lifetime over this wavelength range, as PENT exhibits the greatest fluorescence in this range. At higher wavelengths, PENT did not contribute to the overall fluorescence of the samples. On the basis of the data presented here, we are unable to speculate on the cause of the increased average lifetime of cross-linked DMs at higher wavelengths, and these underlying contributions merit further investigation.
As the primary goal of this study was to validate the use of TRFS to quantify PENT accumulation in engineered matrices, we used HPLC and mass spectrometry to confirm that ribose treatment did not otherwise alter DM composition. Mass spectrometry revealed similar collagen content within control and ribose DMs, confirming that PENT is the primary fluorescent contributor causing the shifts in peak emission and average lifetime. Using HPLC, we observed a temporal increase in PENT formation in ribose DMs and hardly detectable PENT in control DMs. Additionally, we investigated the presence of mature enzymatic cross-links such as pyridinoline (PYD) and deoxypyridinoline (DPD), as these can also contribute to the overall fluorescence emission. In our system, MSCs deposit ECM over 10 days, an insufficient duration for the formation of mature enzymatic cross-links. As expected, we did not detect any enzymatic cross-links in either experimental group. To our knowledge, we are the first group to demonstrate direct correlation for the measurement of PENT through TRFS and HPLC, thus validating this optical spectroscopy technique as a new mode of cross-link measurement in engineered biomaterials. In addition to its nondestructive nature, TRFS is rapid, with each fluorescence measurement lasting over tens of seconds (depending on the repetition rate of the laser, averaging per point, scanning speed of spectrometer, etc.). This time scale is a substantial improvement over HPLC measurements, which may take up to several hours per sample.
After characterizing the cross-linked DMs, we investigated the effects of PENT on modulating MSC behavior in vitro. These progenitor cells play a vital role in bone formation by differentiating into chondrocytes or osteoblasts. Previously, the effect of AGEs on cellular response has been conducted by either incubating collagen with glycating sugars such as ribose or by treating cells with AGE-modified bovine serum albumin (AGE-BSA). AGE-collagen does not mimic the native ECM accurately, and evaluating the interaction of AGE-BSA in solution does not capture the effect of cross-linked collagen within the ECM on cellular response. In contrast, we investigated the role of PENT-modified DMs in altering the osteogenic differentiation potential of MSCs. First, we probed the role of PENT on impairing integrin-mediated cell adhesion. PENT formation reduces the availability of free arginine and lysine, amino acids that are part of the GFOGER integrin-binding sites on collagen.31 Recent studies demonstrated that glycation can impair integrin-mediated binding of cells to collagen films; this effect is dependent on cell type and the stage of osteoblastic development.32 Contrary to previous results, we observed slightly increased adhesion of MSCs to ribose D14 DMs relative to control D14 DMs. While we previously demonstrated that α2β1 (collagen-binding integrin) can regulate adhesion of MSCs to DMs,11 others have shown that αvβ3 and α5β1 can also play significant roles in MSC attachment.33 We did not observe any changes in mRNA expression and thus cannot comment on the mechanism leading to increased adhesion of MSCs to cross-linked DMs. On the basis of the premise that DMs can enhance the osteogenic phenotype of MSCs10,11,13 and that an increase in cytoskeletal tension of MSCs correlates to osteogenic commitment,34 we also probed for differences in cell morphology and cytoskeletal tension of attached MSCs. After 1 day, MSCs seeded on ribose D14 DMs appeared less elongated and exhibited a larger cell area than control D14 DMs, suggesting that the presence of PENT in DMs may cause changes in early morphology and cytoskeletal tension.
Finally, we probed the effect of cross-linking on MSC osteogenic differentiation. There were no significant differences in cell number between control D14 and ribose D14 DMs at days 1, 7, or 14. Currently, there is no consensus on the effect of glycation on cellular proliferation. Fibroblasts cultured in glycated collagen gels exhibited increased proliferation,35,36 while osteoblasts from different sources demonstrated higher or lower proliferation compared to controls based on the stage of differentiation.37 In order to measure osteogenic potential, MSCs were seeded at confluence in this study, potentially limiting our ability to discern changes in DNA content over time or between control and ribose DMs. We assessed the expression levels of RUNX2, a transcription factor regulating early osteogenic differentiation;38 SP7, another transcription factor acting downstream of RUNX2 that regulates late osteogenesis;39 and COL1A1, a marker for ECM deposition during osteoblast maturation.40 RUNX2 expression did not reveal significant changes between control DMs and ribose DMs. However, both SP7 and COL1A1 showed reduced expression in MSCs on ribose DMs at days 7 and 14, respectively. These significant decreases in gene expression did not translate to changes in functional outputs, namely, calcium deposition, suggesting that initial collagen cross-links in the ECM are insufficient to induce phenotypical changes in MSCs in this system. These studies were also conducted in the presence of soluble cues from OM, which may have overshadowed any effects of the cross-linked ECM on osteogenic differentiation potential of MSCs. Others have reported the effect of circulating systemic factors in diabetic patients on osteoblast function (reviewed in ref 5). Future studies will consider the inclusion of such potent factors to examine synergies between PENT-modified DMs on cellular responses.
There are several limitations to the system described in this work. To discern the effect of PENT on progenitor cell function, healthy human MSCs were utilized in these studies. However, MSCs from diabetic patients may provide a better representation of the disease condition. While ECM glycation is an indicator of the pathological condition associated with diabetic bone healing, these data demonstrate that it is not sufficient to replicate the microenvironment in the body. Systemic factors such as high blood sugar, other soluble cues in the media, or factors entrapped within the ECM may play a more pronounced role in impairing diabetic bone healing than ECM glycation alone.
Conclusions
This study serves as a proof of principle that nonenzymatic crosslinks such as PENT can be formed in biomimetic substrates and that these cross-links can be detected by the rapid, nondestructive, optical spectroscopy technique, TRFS. We also established strong correlations between TRFS measurements and cross-link concentrations as measured by HPLC, the standard in cross-link detection. PENT formation in DMs moderately altered adhesion and osteogenic differentiation of MSCs. Further studies are merited to investigate the mechanism behind the functional responses observed in this work.
Acknowledgments
This work was supported by the California Institute of Regenerative Medicine (RT3-07981) to J.K.L. and NIH R01 HL67377 to L.M. D.M. is grateful for financial support through the Schwall Fellowship in Medical Research, California Institute for Regenerative Medicine UC Davis Stem Cell Training Program (CIRM TG2-01163), and industry/campus supported fellowship under the Training Program in Biomolecular Technology (T32-GM008799) at the University of California, Davis. H.F. acknowledges financial support from the training program in molecular imaging grant (5T32EB003827). J.S.N. is grateful for support from the Department of Veterans Affairs, Veterans Health Administration, Office of Research and Development (1I01BX001018), which made the HPLC analysis possible.
Footnotes
Notes: The contents of this publication are solely the responsibility of the authors and do not necessarily represent the official views of CIRM or any other agency of the State of California.
The authors declare no competing financial interest.
References
- 1.Guariguata L, Whiting DR, Hambleton I, Beagley J, Linnenkamp U, Shaw JE. Global estimates of diabetes prevalence for 2013 and projections for 2035. Diabetes Res Clin Pract. 2014;103:137–149. doi: 10.1016/j.diabres.2013.11.002. [DOI] [PubMed] [Google Scholar]
- 2.Hamann C, Kirschner S, Gunther KP, Hofbauer LC. Bone, sweet bone–osteoporotic fractures in diabetes mellitus. Nat Rev Endocrinol. 2012;8:297–305. doi: 10.1038/nrendo.2011.233. [DOI] [PubMed] [Google Scholar]
- 3.Loder RT. The influence of diabetes mellitus on the healing of closed fractures. Clin Orthop Relat Res. 1988;232:210–216. [PubMed] [Google Scholar]
- 4.Graves DT, Alblowi J, Paglia DN, O'Connor JP, Lin S. Impact of Diabetes on Fracture Healing. J Exp Clin Med. 2011;3:3–8. [Google Scholar]
- 5.Blakytny R, Spraul M, Jude EB. Review: The diabetic bone: a cellular and molecular perspective. Int J Lower Extremity Wounds. 2011;10:16–32. doi: 10.1177/1534734611400256. [DOI] [PubMed] [Google Scholar]
- 6.Ganesh SP, Pietrobon R, Cecilio WA, Pan D, Lightdale N, Nunley JA. The impact of diabetes on patient outcomes after ankle fracture. J Bone Joint Surg Am. 2005;87:1712–1718. doi: 10.2106/JBJS.D.02625. [DOI] [PubMed] [Google Scholar]
- 7.Santana RB, Xu L, Chase HB, Amar S, Graves DT, Trackman PC. A role for advanced glycation end products in diminished bone healing in type 1 diabetes. Diabetes. 2003;52:1502–1510. doi: 10.2337/diabetes.52.6.1502. [DOI] [PubMed] [Google Scholar]
- 8.Monnier VM, Sell DR, Nagaraj RH, Miyata S, Grandhee S, Odetti P, Ibrahim SA. Maillard reaction-mediated molecular damage to extracellular matrix and other tissue proteins in diabetes, aging, and uremia. Diabetes. 1992;41(Suppl 2):36–41. doi: 10.2337/diab.41.2.s36. [DOI] [PubMed] [Google Scholar]
- 9.Katayama Y, Akatsu T, Yamamoto M, Kugai N, Nagata N. Role of nonenzymatic glycosylation of type I collagen in diabetic osteopenia. J Bone Miner Res. 1996;11:931–937. doi: 10.1002/jbmr.5650110709. [DOI] [PubMed] [Google Scholar]
- 10.Decaris ML, Leach JK. Design of experiments approach to engineer cell-secreted matrices for directing osteogenic differentiation. Ann Biomed Eng. 2011;39:1174–1185. doi: 10.1007/s10439-010-0217-x. [DOI] [PMC free article] [PubMed] [Google Scholar]
- 11.Decaris ML, Mojadedi A, Bhat A, Leach JK. Transferable cell-secreted extracellular matrices enhance osteogenic differentiation. Acta Biomater. 2012;8:744–752. doi: 10.1016/j.actbio.2011.10.035. [DOI] [PubMed] [Google Scholar]
- 12.Decaris ML, Binder BY, Soicher MA, Bhat A, Leach JK. Cell-derived matrix coatings for polymeric scaffolds. Tissue Eng Part A. 2012;18:2148–2157. doi: 10.1089/ten.TEA.2011.0677. [DOI] [PubMed] [Google Scholar]
- 13.Hoch AI, Mittal V, Mitra D, Vollmer N, Zikry CA, Leach JK. Cell-secreted matrices perpetuate the bone-forming phenotype of differentiated mesenchymal stem cells. Biomaterials. 2016;74:178–187. doi: 10.1016/j.biomaterials.2015.10.003. [DOI] [PMC free article] [PubMed] [Google Scholar]
- 14.Marcu L. Fluorescence lifetime techniques in medical applications. Ann Biomed Eng. 2012;40:304–331. doi: 10.1007/s10439-011-0495-y. [DOI] [PMC free article] [PubMed] [Google Scholar]
- 15.Ashjian P, Elbarbary A, Zuk P, DeUgarte DA, Benhaim P, Marcu L, Hedrick MH. Noninvasive in situ evaluation of osteogenic differentiation by Time-Resolved Laser-Induced Fluorescence Spectroscopy. Tissue Eng. 2004;10:411–420. doi: 10.1089/107632704323061771. [DOI] [PMC free article] [PubMed] [Google Scholar]
- 16.Fite BZ, Decaris M, Sun Y, Sun Y, Lam A, Ho CKL, Leach JK, Marcu L. Noninvasive multimodal evaluation of bioengineered cartilage constructs combining time-resolved fluorescence and ultrasound imaging. Tissue Eng, Part C. 2011;17:495–504. doi: 10.1089/ten.tec.2010.0368. [DOI] [PMC free article] [PubMed] [Google Scholar]
- 17.Sun Y, Responte D, Xie H, Liu J, Fatakdawala H, Hu J, Athanasiou KA, Marcu L. Nondestructive evaluation of tissue engineered articular cartilage using time-resolved fluorescence spectroscopy and ultrasound backscatter microscopy. Tissue Eng Part C Methods. 2012;18:215–226. doi: 10.1089/ten.tec.2011.0343. [DOI] [PMC free article] [PubMed] [Google Scholar]
- 18.Vashishth D, Gibson GJ, Khoury JI, Schaffler MB. Influence of nonenzymatic glycation on biomechanical properties of cortical bone. Bone. 2001;28:195–201. doi: 10.1016/s8756-3282(00)00434-8. [DOI] [PubMed] [Google Scholar]
- 19.Sun Y, Park J, Stephens DN, Jo JA, Sun L, Cannata JM, Saroufeem RMG, Shung KK, Marcu L. Development of a dual-modal tissue diagnostic system combining time-resolved fluorescence spectroscopy and ultrasonic backscatter microscopy. Rev Sci Instrum. 2009;80:065104. doi: 10.1063/1.3142478. [DOI] [PMC free article] [PubMed] [Google Scholar]
- 20.Liu J, Sun Y, Qi J, Marcu L. A novel method for fast and robust estimation of fluorescence decay dynamics using constrained least-squares deconvolution with Laguerre expansion. Phys Med Biol. 2012;57:843–865. doi: 10.1088/0031-9155/57/4/843. [DOI] [PMC free article] [PubMed] [Google Scholar]
- 21.Buckley A, Hill KE, Davidson JM. Collagen Metabolism. Methods Enzymol. 1988;163:674–694. doi: 10.1016/0076-6879(88)63056-4. [DOI] [PubMed] [Google Scholar]
- 22.Taylor AJ, Ratner BD, Buttery LDK, Alexander MR. Revealing cytokine-induced changes in the extracellular matrix with secondary ion mass spectrometry. Acta Biomater. 2015;14:70–83. doi: 10.1016/j.actbio.2014.12.005. [DOI] [PMC free article] [PubMed] [Google Scholar]
- 23.Binder BYK, Genetos DC, Leach JK. Lysophosphatidic acid protects human mesenchymal stromal cells from differentiation-dependent vulnerability to apoptosis. Tissue Eng Part A. 2014;20:1156–1164. doi: 10.1089/ten.tea.2013.0487. [DOI] [PMC free article] [PubMed] [Google Scholar]
- 24.Livak KJ, Schmittgen TD. Analysis of relative gene expression data using real-time quantitative PCR and the 2(-Delta Delta C(T)) Method. Methods. 2001;25:402–408. doi: 10.1006/meth.2001.1262. [DOI] [PubMed] [Google Scholar]
- 25.Vissers CAB, Harvestine JN, Leach JK. Pore size regulates mesenchymal stem cell response to Bioglass-loaded composite scaffolds. J Mater Chem B. 2015;3:8650–8658. doi: 10.1039/c5tb00947b. [DOI] [PubMed] [Google Scholar]
- 26.Murphy KC, Fang SY, Leach JK. Human mesenchymal stem cell spheroids in fibrin hydrogels exhibit improved cell survival and potential for bone healing. Cell Tissue Res. 2014;357:91–99. doi: 10.1007/s00441-014-1830-z. [DOI] [PMC free article] [PubMed] [Google Scholar]
- 27.Tanaka S, Avigad G, Eikenberry EF, Brodsky B. Isolation and partial characterization of collagen chains dimerized by sugar-derived cross-links. J Biol Chem. 1988;263:17650–17657. [PubMed] [Google Scholar]
- 28.Datta N, Pham QP, Sharma U, Sikavitsas VI, Jansen JA, Mikos AG. In vitro generated extracellular matrix and fluid shear stress synergistically enhance 3D osteoblastic differentiation. Proc Natl Acad Sci U S A. 2006;103:2488–2493. doi: 10.1073/pnas.0505661103. [DOI] [PMC free article] [PubMed] [Google Scholar]
- 29.Fujimori E. Changes induced by ozone and ultraviolet light in type I collagen. Bovine achilles tendon collagen versus rat tail tendon collagen. Eur J Biochem. 1985;152:299–306. doi: 10.1111/j.1432-1033.1985.tb09198.x. [DOI] [PubMed] [Google Scholar]
- 30.Fukushima S, Shimizu M, Miura J, Matsuda Y, Kubo M, Hashimoto M, Aoki T, Takeshige F, Araki T. Decrease in fluorescence lifetime by glycation of collagen and its application in determining advanced glycation end-products in human dentin. Biomed Opt Express. 2015;6:1844–1856. doi: 10.1364/BOE.6.001844. [DOI] [PMC free article] [PubMed] [Google Scholar]
- 31.Avery NC, Bailey AJ. The effects of the Maillard reaction on the physical properties and cell interactions of collagen. Pathol Biol. 2006;54:387–395. doi: 10.1016/j.patbio.2006.07.005. [DOI] [PubMed] [Google Scholar]
- 32.McCarthy AD, Uemura T, Etcheverry SB, Cortizo AM. Advanced glycation endproducts interefere with integrin-mediated osteoblastic attachment to a type-I collagen matrix. Int J Biochem Cell Biol. 2004;36:840–848. doi: 10.1016/j.biocel.2003.09.006. [DOI] [PubMed] [Google Scholar]
- 33.Hidalgo-Bastida LA, Cartmell SH. Mesenchymal stem cells, osteoblasts and extracellular matrix proteins: enhancing cell adhesion and differentiation for bone tissue engineering. Tissue Eng Part B Rev. 2010;16:405–412. doi: 10.1089/ten.TEB.2009.0714. [DOI] [PubMed] [Google Scholar]
- 34.McBeath R, Pirone DM, Nelson CM, Bhadriraju K, Chen CS. Cell Shape, Cytoskeletal Tension, and RhoA Regulate Stem Cell Lineage Commitment. Dev Cell. 2004;6:483–495. doi: 10.1016/s1534-5807(04)00075-9. [DOI] [PubMed] [Google Scholar]
- 35.Kawano E, Takahashi SI, Sakano Y, Fujimoto D. Nonenzymatic glycation alters properties of collagen as a substratum for cells. Matrix. 1990;10:300–305. doi: 10.1016/s0934-8832(11)80185-x. [DOI] [PubMed] [Google Scholar]
- 36.Francis-Sedlak ME, Uriel S, Larson JC, Greisler HP, Venerus DC, Brey EM. Characterization of type I collagen gels modified by glycation. Biomaterials. 2009;30:1851–1856. doi: 10.1016/j.biomaterials.2008.12.014. [DOI] [PubMed] [Google Scholar]
- 37.McCarthy AD, Etcheverry SB, Bruzzone L, Lettieri G, Barrio DA, Cortizo AM. Non-enzymatic glycosylation of a type I collagen matrix: effects on osteoblastic development and oxidative stress. BMC Cell Biol. 2001;2:16. doi: 10.1186/1471-2121-2-16. [DOI] [PMC free article] [PubMed] [Google Scholar]
- 38.Lian JB, Javed A, Zaidi SK, Lengner C, Montecino M, van Wijnen AJ, Stein JL, Stein GS. Regulatory controls for osteoblast growth and differentiation: role of Runx/Cbfa/AML factors. Crit Rev Eukaryotic Gene Expression. 2004;14:1–41. [PubMed] [Google Scholar]
- 39.Nakashima K, Zhou X, Kunkel G, Zhang Z, Deng JM, Behringer RR, de Crombrugghe B. The novel zinc finger-containing transcription factor osterix is required for osteoblast differentiation and bone formation. Cell. 2002;108:17–29. doi: 10.1016/s0092-8674(01)00622-5. [DOI] [PubMed] [Google Scholar]
- 40.Nakashima K, de Crombrugghe B. Transcriptional mechanisms in osteoblast differentiation and bone formation. Trends Genet. 2003;19:458–466. doi: 10.1016/S0168-9525(03)00176-8. [DOI] [PubMed] [Google Scholar]