Abstract
Objective:
The purpose of the study was to use deformable mapping of planning CT (pCT) electron density values on weekly cone-beam CT (CBCT) to quantify the anatomical changes and determine the dose–volume relationship in offline adaptive volumetric-modulated arc therapy.
Methods:
10 patients treated with RapidArc plans who had weekly CBCTs were selected retrospectively. The pCT was deformed to weekly CBCTs and the deformed contours were checked for any discrepancies. Clinical target volume 66 Gy and 60 Gy (CTV66 and CTV60), parotids and spinal cord were the structures selected for analysis. Volume reduction and dice similarity index (DSI) were determined. Hybrid RapidArc plans were created and the cumulative dose–volume histograms for selected structures were analyzed.
Results:
Results showed a mean volume reduction of 18.82 ± 6.08% and 18.22 ± 6.1% for Clinical target volume 66 Gy and 60 Gy (CTV66 and CTV60), respectively, and their corresponding DSI values were 0.94 ± 0.03 and 0.95 ± 0.01. Mean volume reductions of left and right parotids were 32.79 ± 10.28% and 29.46 ± 8.78%, respectively, and their corresponding mean DSI values were 0.90 ± 0.05 and 0.89 ± 0.05. The cumulative mean dose difference for Planning target volume 66 Gy (PTV66) was −1.35 ± 1.71% and for Planning target volume 60 Gy (PTV60), it was −0.69 ± 1.37%. Spinal cord doses varied for all patients over the course.
Conclusion:
The results from the study showed that it is clinically feasible to estimate the dose–volume relationship using deformed pCT. Monitoring of patient anatomic changes and incorporating patient-specific replanning strategy are necessary to avoid critical structure complications.
Advances in knowledge:
Deformable mapping of pCT electron density values on weekly CBCTs has been performed to establish the volumetric and dosimetric changes. The anatomical changes differ among the patients and hence, the choice for adaptive radiotherapy should be strictly patient specific rather than time specific.
INTRODUCTION
Radiotherapy plays a vital part in the treatment of head and neck cancers. However, the treatment poses a great challenge owing to the presence of many critical structures in and around the planning target volume (PTV). In conventional treatment techniques, these critical structures limit the doses delivered to the target volume. The advent of intensity-modulated radiotherapy (IMRT) caused a paradigm shift in treatment delivery. Owing to the steep dose gradients in IMRT, better target conformity as well as improved sparing of critical structures like parotids in close proximity to the target volume has been made possible. Advancements in better delivery techniques like volumetric-modulated arc therapy have improved the sparing of critical structures and reduced the treatment delivery time, thereby limiting intrafraction motion errors. It has been shown that volumetric-modulated arc therapy plans using double arcs for treatment in head and neck cancer provide a remarkable sparing of critical structures and healthy tissues without undermining target coverage compared with IMRT.1,2 Accurate patient positioning is essential for intensity-modulated treatments of head and neck cancers. Setup errors could alter the doses delivered to PTV and critical structures. A significant improvement in image-guided radiotherapy has led to improved setup accuracy and hence reduced CTV to PTV margins.3 Radiotherapy machines can acquire two-dimensional megavoltage (MV) and kilovoltage (kV) orthogonal images as well as three-dimensional cone-beam CT (CBCT) images for patient positioning verification.4,5 CBCT images of the patient acquired just before the treatment are registered automatically with planning CT (pCT), helping in visualizing the changes in anatomy. However, CBCT acquisition geometry and longer scan times result in inferior quality images as compared with CT.6,7
In the present scenario, radiotherapy plans are based on a single CT image set acquired in the initial phase of the treatment planning process. There is a possibility of change in the anatomy during the full course of the treatment. Thus, the initial CT data are ideally not representative of the anatomy present during treatment. These potential changes are not accounted for in daily treatment. Given the steep dose gradients in intensity-modulated plans, a marginal change could lead to overdosing the critical structures or underdosing the target. Studies in literature have described the setup errors and their potential dosimetric effects on target volumes and critical structures.8–13 Highly conformal plans based on a single image set may lead to unexpected complications or marginal geographical misses of target volumes if positional and anatomical modifications are not taken into account.10 Hansen et al13 analyzed retrospectively the dosimetric effects of repeat CT imaging and replanning on target volumes and normal tissues in head and neck IMRT and concluded that replanning is essential. Although repeat CT planning is essential in patients with significant volume reduction, it is an extremely time-consuming process.10
Adaptive radiotherapy (ART) has been suggested as a possible solution to the anatomical changes occurring during the course of radiotherapy. CBCT images acquired as part of setup verification provide the typical anatomical information of the day, which can be utilized for ART. The main advantage of ART is that it can help in compensating the underdosage of target volumes and overdosage of critical structures by accounting for the variation in anatomy.10 Deformable image registration (DIR) plays an important role in ART and many literature studies have confirmed that DIR-based ART is a promising tool to determine the delivered doses and cumulative dose–volume histograms (DVHs).14–17 DIR does the mapping of voxels from one image set to another, where mapping is represented by a vector that has a unique magnitude and direction. The deformation vector field is the composite of individual vectors in a single map and constitutes the transformation between two image sets.
Studies have been carried out with different DIR algorithms for deformable matching of pCT to repeat CT images.10 Dosimetric studies based on CBCT-based DIR are comparatively less. A commercially available system (Varian Medical Systems, Palo Alto, CA) for deformable registration has been used to deform pCT to CBCT. In this study, we have analyzed retrospectively the dose–volume relationship in patients treated with RapidArc technique by using deformable mapping of pCT electron density values on weekly CBCTs.
METHODS AND MATERIALS
Patient selection
10 patients with intact head and neck disease who underwent RapidArc® (Varian Medical Systems, Palo Alto, CA) treatments were selected retrospectively for this study and are presented in Table 1. The patients were immobilized using a five-clamp head and neck mask with appropriate headrest. The pCT data were acquired in a 16-slice CT scanner (Siemens Medical Systems, Concord, CA) with a slice thickness of 3 mm. The institutional protocol is to obtain two sets of CT data; a plain image set followed by a contrast injected set. The contrast-enhanced CT set is used for contouring and planning is performed on the plain image set. CTVs and organs at risk were contoured by the radiation oncologist in the Eclipse™ v. 11.1 treatment planning system (Varian Medical Systems, Palo Alto, CA). The PTV was grown from CTV with a 5-mm margin. The primary PTV, intermediate-risk and low-risk nodal PTVs were prescribed 66, 60 and 54 Gy, respectively, in 33 fractions with a simultaneous integrated boost technique. RapidArc plans were generated using the progressive resolution optimizer 3 algorithm and calculated using the analytical anisotropic algorithm with a grid resolution of 2.5 mm. During optimization, the critical structure doses were kept below the tolerances as much as possible without compromising PTV coverage. Some patients had either a part of parotids inside or close to the high-dose target volumes. In such scenarios, owing to the dose trade-off with other critical structures, parotid mean doses were higher than the dose constraint of 26 Gy. The average planned parotid mean dose for all patients was 25.4 Gy. The minimum PTV enclosed by 95% isodose line was 95% and the maximum dose was kept within 107%. All patients were treated with dual-arc plans. The Clinical and planning target volumes prescribed to 66 Gy & 60 Gy (CTV66, CTV60; PTV66, PTV60), parotids and spinal cord were the structures selected for the study. As part of imaging protocol, patients underwent daily kV orthogonal imaging for setup verification and had weekly CBCT scans in treatment position using Varian On-board imaging technology. The CBCTs were acquired in full-fan mode with a field of view (FOV) of about 25 cm in diameter, 17 cm in axial length and a slice thickness of 3 mm in a gantry rotation of little over 200°. More structures could not be included in the analysis because of the missing patient information in CBCT due to a limited FOV.
Table 1.
Characteristics of patient sample
| Number | Age (years) | Tumour site | Staging | Relative weight loss (%) |
|---|---|---|---|---|
| 1 | 53 | Nasopharynx | T3n2c | 15 |
| 2 | 54 | Tongue | T2n1 | 16 |
| 3 | 68 | Tongue | T2n2c | 11 |
| 4 | 49 | Pyriform fossa | T2n1 | 12 |
| 5 | 54 | Tonsil | T2n0 | 10 |
| 6 | 69 | Supraglottis | T3n1 | 13 |
| 7 | 51 | Glottis | T3n0 | 16 |
| 8 | 44 | Tonsil | T2n1 | 15 |
| 9 | 57 | Base of tongue | T3n2c | 12 |
| 10 | 62 | Nasopharynx | T2n2b | 18 |
Deformable image registration
SmartAdapt® system (Varian Medical Systems, Palo Alto, CA) was used for DIR. It is derived from a modified “accelerated demons algorithm” proposed by Wang et al,18 where the demon force required for deformation is based on the intensity differences between the images and the gradient of reference image.19 The pCTs and weekly CBCTs totalling 70 image sets were exported from the Eclipse planning system in digital imaging and communications in medicine format to the SmartAdapt system. The CBCT image was taken as the reference image, as it contains the anatomical information of the day and the pCT image set was taken as the moving image. Initially, a quick rigid registration was run to match the rigid bony landmarks of pCT to the CBCT. The limited FOV of CBCT meant that the shoulders were not included in the region of interest. Automatic deformable registration was performed for the selected FOV with preset parameter values, as SmartAdapt does not allow the modification of deformation parameters. The pCT slices were used to extend the CBCT images in the shoulder region. The pCT contours were deformed using the deformation vector field determined by the SmartAdapt system. The deformed structures were checked visually if they correlated with the changes in CBCT. The deformed image sets [deformed CT (dCT)] with warped structures were exported to the Eclipse planning system in digital imaging and communications in medicine format for contour evaluation and dose calculation.
Contour evaluation
The deformed sets with warped structures were imported into the Eclipse system. The same structures were delineated by the oncologist independently and were taken as the reference. To avoid interobserver error, the same oncologist contoured the structures in all CBCTs. Dice similarity index (DSI) was computed for selected structures. DSI is a volume-based similarity measure used to evaluate quantitatively any two sets of contours. The degree of overlap between the manually contoured and system-delineated structures can be determined using DSI. It can range from “0” to “1”, where “0” indicates no overlap and “1” indicates absolute overlap. DSI was chosen as the similarity measure, as it can be determined easily by using Boolean operators in the planning system. If VW and VC are the volume of system warped structures and contoured reference structures, then DSI is defined as:
Dose comparison
The RapidArc treatment plan based on pCT was transferred to the dCT. The dCT has the Hounsfield information of pCT with the anatomical data of CBCT. Calculation-based dCT is more accurate than that based on CBCT alone.15 The isocentre placement was performed based on the position of pCT isocentre from the nearest rigid bony landmark. The dose was calculated with fixed monitor units in the Eclipse treatment planning system using the analytical anisotropic algorithm with a resolution of 2.5 mm to estimate the actually delivered doses. DVH analysis of CTV and PTV was performed using doses received by 99% (D99%), 95% (D95%), 90% (D90%), 1% (D1%) of volume and mean dose parameters. The cumulative mean dose (Dmean), volume receiving 26 Gy (V26) and dose received by 50% volume (D50) were used for dosimetric analysis of parotid glands, whereas for spinal cord, maximum dose (Dmax) was determined.
RESULTS
Volume comparison
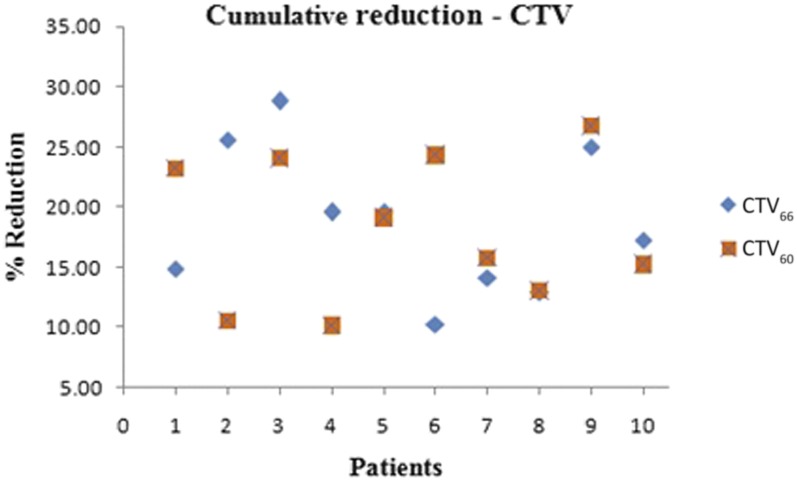
The volumes of Clinical target volume 66 Gy and 60 Gy (CTV66 and CTV60) determined from the weekly dCTs are shown in Figure 1a,b, respectively. The mean volume reduction of Clinical target volume 66 Gy and 60 Gy (CTV66 and CTV60) were 18.82 ± 6.08% and 18.22 ± 6.1%, respectively. Figure 2 shows the cumulative volume reduction in CTVs. Patient 3 had the largest reduction of 28.80% in Clinical target volume 66 Gy (CTV66) and Patient 6 had the least reduction of 10.24%. Patient 9 had the largest reduction of 26.72% in Clinical target volume 60 Gy (CTV60) and Patient 2 had the least variation of 10.54%.
Figure 1.
(a) Clinical target volume 66 Gy (CTV66) variation over the treatment course and (b) Clinical target volume 60 Gy (CTV60) variation over the treatment course. CBCT, cone-beam CT; Pt, patient.
Figure 2.
Cumulative volume reduction of clinical target volumes (CTVs).
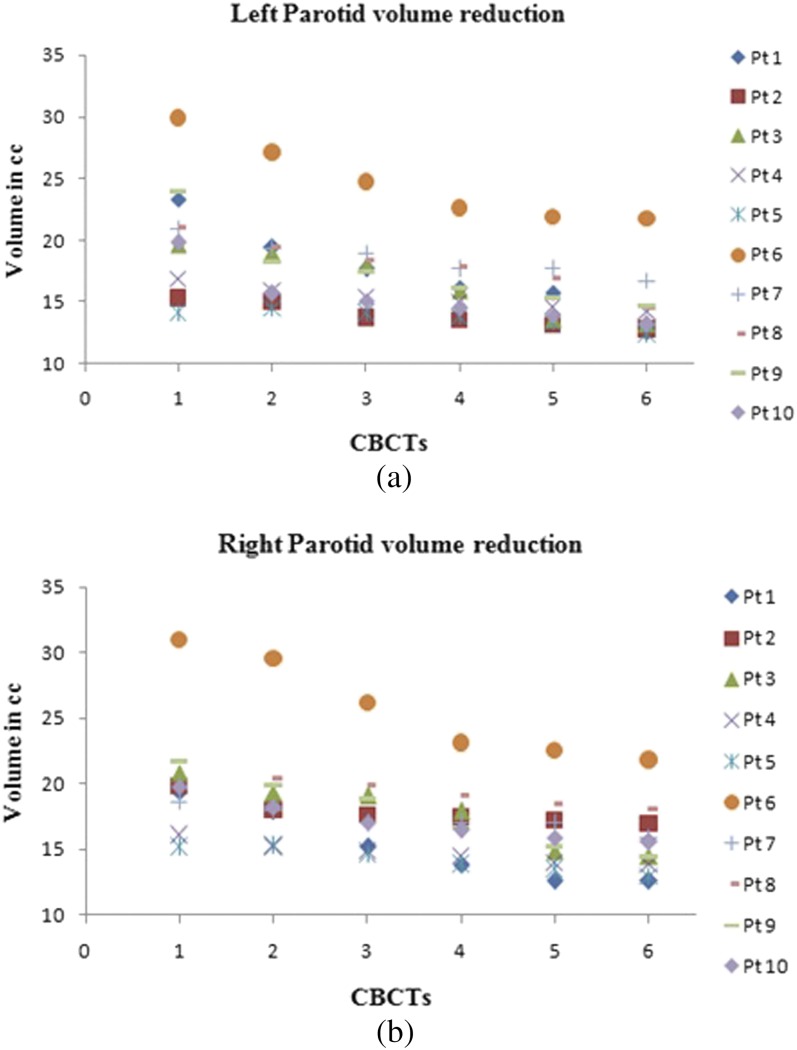
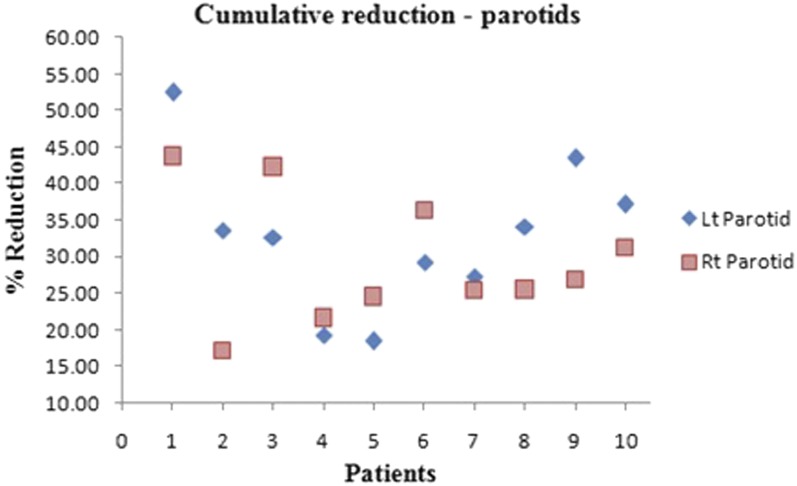
Figure 3a,b depict the variation in left and right parotid volumes, respectively. The volume reduction differed among the patients, with some having greater variation and others having minimal reduction. Mean reductions of the left and right parotids were 32.79 ± 10.28% and 29.46 ± 8.78%, respectively. Patient 1 had the greatest reduction of 52.45% and 43.75% in the left and right parotids, respectively. Patient 5 had the least reduction of 18.42% in the left parotid and Patient 4 had the least reduction of 21.59% in the right parotid. Figure 4 depicts the cumulative volume reduction of both parotids.
Figure 3.
(a) Variation of left parotid volume over the treatment course and (b) variation of right parotid volume over the treatment course. CBCT, cone-beam CT; Pt, patient.
Figure 4.
Cumulative volume reduction of parotids. Lt, left; Rt, right.
The DSI between the system deformed and manually delineated contours was determined for selected structures and is shown in Table 2. The cumulative mean DSI values of Clinical target volume 66 Gy and 60 Gy (CTV66 and CTV60) were 0.94 ± 0.03 and 0.95 ± 0.01 and for the left and right parotids, they were 0.90 ± 0.05 and 0.89 ± 0.05, respectively.
Table 2.
Dice similarity index (DSI) for the selected structures
| Patient | DSI |
|||
|---|---|---|---|---|
| CTV66 | CTV60 | Left parotid | Right parotid | |
| 1 | 0.97 ± 0.020 | 0.96 ± 0.014 | 0.91 ± 0.080 | 0.92 ± 0.053 |
| 2 | 0.98 ± 0.009 | 0.94 ± 0.019 | 0.92 ± 0.037 | 0.81 ± 0.049 |
| 3 | 0.88 ± 0.055 | 0.96 ± 0.010 | 0.91 ± 0.036 | 0.94 ± 0.010 |
| 4 | 0.96 ± 0.008 | 0.97 ± 0.005 | 0.93 ± 0.017 | 0.93 ± 0.023 |
| 5 | 0.95 ± 0.015 | 0.93 ± 0.023 | 0.87 ± 0.030 | 0.86 ± 0.031 |
| 6 | 0.97 ± 0.008 | 0.97 ± 0.013 | 0.94 ± 0.030 | 0.92 ± 0.035 |
| 7 | 0.95 ± 0.017 | 0.94 ± 0.015 | 0.84 ± 0.028 | 0.86 ± 0.042 |
| 8 | 0.95 ± 0.015 | 0.91 ± 0.024 | 0.86 ± 0.029 | 0.89 ± 0.041 |
| 9 | 0.93 ± 0.017 | 0.93 ± 0.019 | 0.92 ± 0.020 | 0.87 ± 0.027 |
| 10 | 0.92 ± 0.022 | 0.96 ± 0.015 | 0.83 ± 0.031 | 0.92 ± 0.032 |
CTV66, Clinical target volume 66 Gy; CTV60, Clinical target volume 60 Gy.
Dose comparison
The average cumulative differences in DVH parameters for Clinical target volume 66 Gy and 60 Gy (CTV66 and CTV60) are shown in Table 3. The cumulative mean dose differences for Clinical target volume 66 Gy and 60 Gy (CTV66 and CTV60) were −0.73 ± 1.46% and −0.25 ± 0.85%, respectively. Table 4 represents the average cumulative differences in DVH parameters for Planning target volume 66 Gy and 60 Gy (PTV66 and PTV60). The cumulative mean dose difference was −1.35 ± 1.71% for Planning target volume 66 Gy (PTV66) and −0.69 ± 1.37% for Planning target volume 60 Gy (PTV60). D99% of PTVs was consistently less than planned, whereas D1% was more or less on the higher side. In most patients, mean dose, D95% and D90% were less than planned.
Table 3.
Clinical target volume (CTV) dose–volume histogram parameters
| Patient | CTV66 (dose difference
in %) |
CTV60 (dose difference
in %) |
||||||||
|---|---|---|---|---|---|---|---|---|---|---|
| D1 | D99 | D95 | D90 | Mean | D1 | D99 | D95 | D90 | Mean | |
| 1 | 0.30 | −3.12 | −0.45 | −0.40 | −0.46 | −0.18 | −2.42 | 0.47 | 0.34 | 0.44 |
| 2 | 1.20 | 0.37 | 0.39 | 0.31 | 0.18 | 1.24 | −0.55 | 1.52 | 0.43 | −0.06 |
| 3 | −1.24 | −4.23 | −3.20 | −2.11 | −3.43 | 0.82 | −1.91 | 0.63 | −1.49 | −0.78 |
| 4 | 1.28 | −0.98 | −0.43 | −0.18 | 0.50 | 0.45 | −0.83 | −0.68 | 0.21 | −1.70 |
| 5 | 0.82 | −4.32 | −3.05 | −1.63 | −3.06 | 1.06 | −3.25 | −0.57 | −0.46 | −1.51 |
| 6 | 0.93 | 1.00 | 0.65 | 1.05 | 0.46 | 0.24 | −1.86 | 0.49 | 0.64 | 0.31 |
| 7 | 0.30 | −3.54 | −0.55 | −0.48 | 0.24 | −1.65 | −2.23 | 1.15 | 0.36 | 0.27 |
| 8 | 1.47 | −0.43 | 0.42 | 0.54 | −0.68 | −0.41 | −1.86 | −0.34 | −0.41 | −0.49 |
| 9 | 0.41 | −2.43 | −0.59 | −0.63 | −0.44 | 0.93 | −2.06 | 0.26 | 0.59 | 0.64 |
| 10 | 0.74 | −1.84 | −0.73 | −0.23 | −0.57 | 0.94 | −1.16 | 0.17 | 0.35 | 0.39 |
CTV66, Clinical target volume 66 Gy; CTV60, Clinical target volume 60 Gy.
Table 4.
Planning target volume (PTV) dose–volume histogram parameters
| Patient | PTV66 (dose difference
in %) |
PTV60 (dose difference
in %) |
||||||||
|---|---|---|---|---|---|---|---|---|---|---|
| D1 | D99 | D95 | D90 | Mean | D1 | D99 | D95 | D90 | Mean | |
| 1 | 0.53 | −4.47 | −0.91 | −0.74 | −0.78 | −0.29 | −4.01 | 0.17 | −0.13 | 0.05 |
| 2 | 1.91 | −1.72 | −0.22 | −0.92 | −0.85 | 1.24 | −0.96 | 0.81 | 1.09 | 0.89 |
| 3 | −1.53 | −5.01 | −3.68 | −2.70 | −3.65 | 0.90 | −2.73 | −1.60 | −2.04 | −1.87 |
| 4 | 1.54 | −2.10 | 0.20 | 0.40 | 0.01 | 0.55 | −3.66 | −0.87 | −1.69 | −2.12 |
| 5 | 1.04 | −7.10 | −4.84 | −2.22 | −5.24 | 1.22 | −4.76 | −0.82 | −1.67 | −2.11 |
| 6 | 2.59 | −3.73 | −0.31 | −0.46 | −0.73 | 0.73 | −3.95 | −0.57 | −1.09 | −0.88 |
| 7 | 0.30 | −3.78 | 0.13 | −0.18 | 0.29 | −1.84 | −2.59 | 0.19 | −0.42 | −0.32 |
| 8 | 1.71 | −2.27 | −0.24 | −0.16 | −0.67 | −1.16 | −2.14 | −0.28 | −1.21 | −0.99 |
| 9 | 0.44 | −3.39 | −0.88 | −0.78 | −0.66 | 1.34 | −2.70 | −0.85 | 0.25 | 0.27 |
| 10 | 0.88 | −3.15 | −1.1 | −0.81 | −1.18 | 1.55 | −1.48 | −0.22 | −0.48 | 0.04 |
PTV66, Planning target volume 66 Gy; PTV60, Planning target volume 60 Gy.
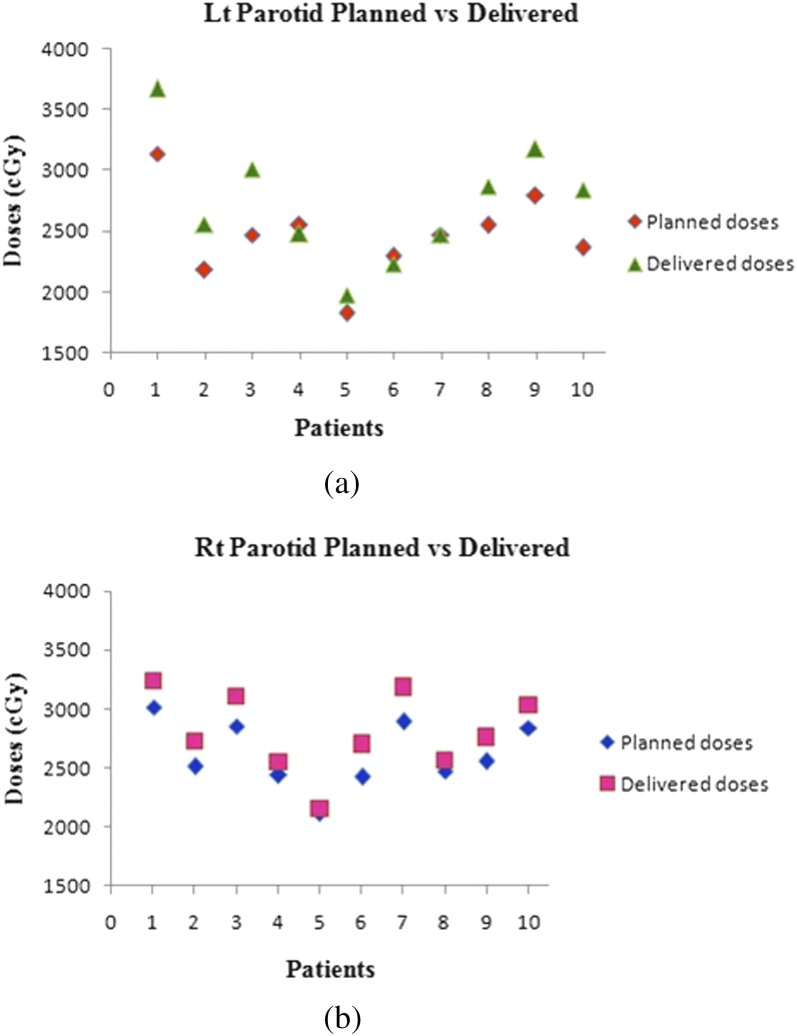
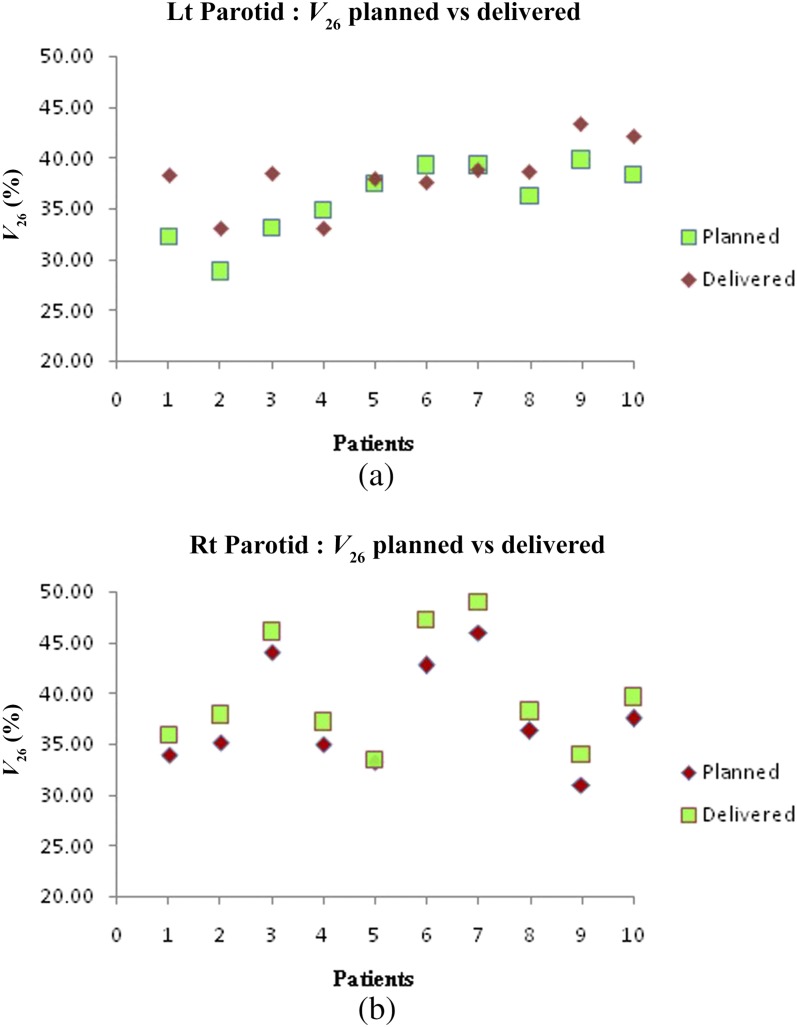
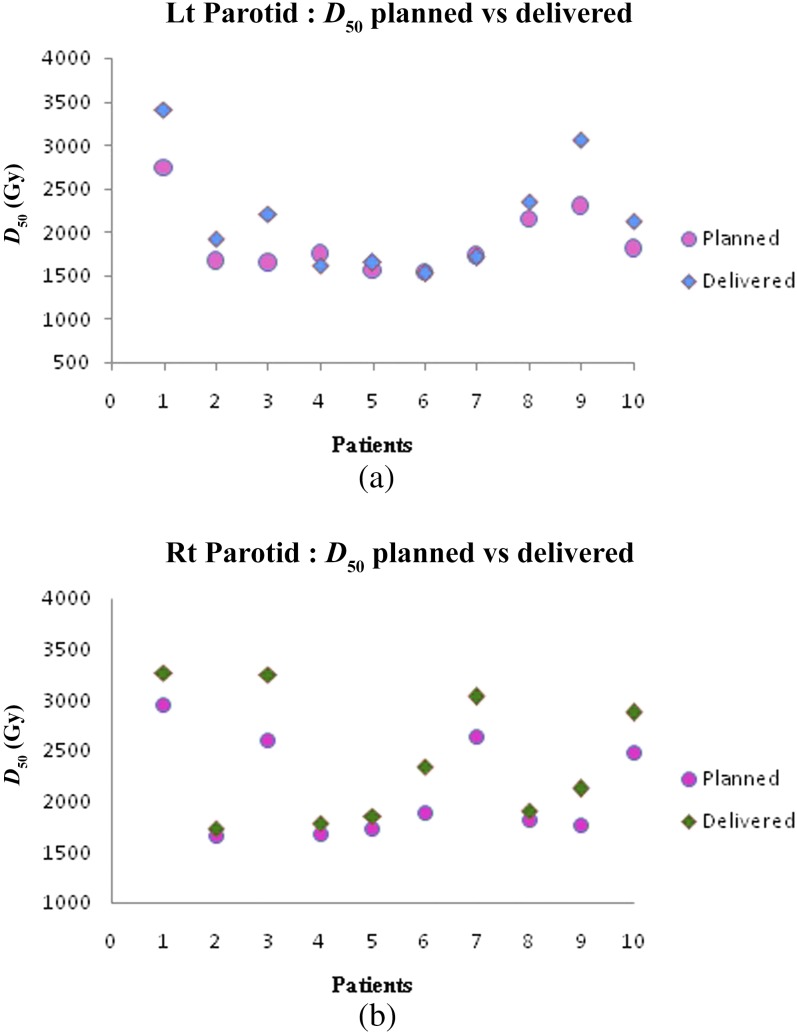
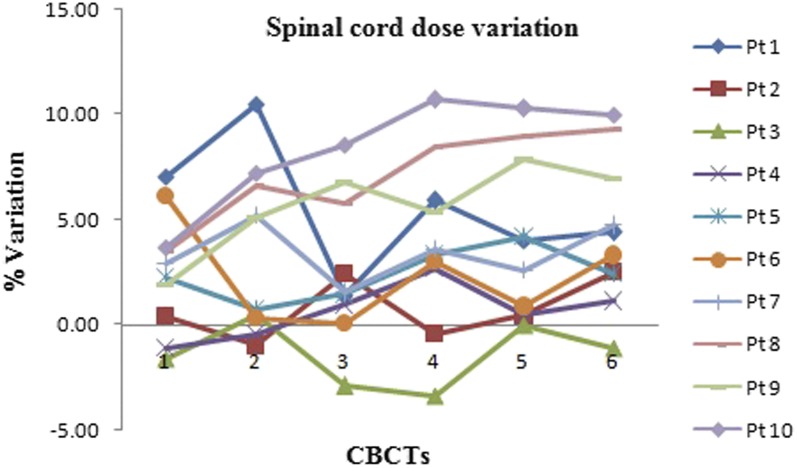
Figure 5a,b show the difference between planned and delivered mean doses for the left and right parotids, respectively. There is a significant increase in left parotid mean doses for Patients 1–3 and 8–10. Patient 5 had marginally higher than the planned doses, whereas Patients 4, 6 and 7 had less than the planned doses. Right parotid mean doses were significantly higher in Patients 1–3, 6 and 7 while for Patients 4, 5, 8–10, the dose delivered was marginally higher than planned doses. The increase in mean doses was prominent in ipsilateral parotids compared with contralateral ones. Variation in V26 and D50% of parotids is depicted in Figures 6a,b and 7a,b, respectively. The spinal cord doses varied on each dCT. Patient 1 had a greater variation whereas Patient 5 had the least variation. Figure 8 shows the variation in spinal cord doses.
Figure 5.
(a) Planned and delivered doses for the left (Lt) parotid and (b) planned and delivered doses for the right (Rt) parotid.
Figure 6.
(a) Left (Lt) parotid V26 variation and (b) right (Rt) parotid V26 variation.
Figure 7.
(a) Left (Lt) parotid D50 variation and (b) right (Rt) parotid D50 variation.
Figure 8.
Spinal cord dose variation over the treatment course. CBCT, cone-beam CT; Pt, patient.
DISCUSSION
We have studied the feasibility of offline ART based on DIR using the weekly CBCT scans. The patient anatomy changes during the course of radiotherapy leading to modifications of target volumes and critical structures. Barker et al8 have reported that the changes in the contours of the target and critical structures appeared to be significant after 3–4 weeks of treatment. In our study, the reduction in CTV and parotid volume differed among the patients studied. All except two (Patients 3 and 9) had a prominent rate of reduction in the initial 2 weeks of radiotherapy treatment. Significant volume reduction in Patients 3 and 9 occurred after the third week of treatment. This may be due to the varied response to radiotherapy and onset of weight loss. The Clinical target volume 66 Gy (CTV66) reduction is related to tumour response and shrinkage is asymmetric, whereas the reduction in Clinical target volume 60 Gy (CTV60) volume is attributed to weight loss only and is symmetric. In parotids, volume loss occurred throughout the course of treatment. The DSI values indicated a good overlap between the manually contoured and the system-generated contours. DSI values of parotids were relatively less owing to the difficulty in contouring on dCT. The dCT image is based on CBCT and hence had reduced image contrast compared with pCT.
Literature studies have revealed that anatomical variations impact critical structures the most rather than the target volumes.13,22–26 We also obtained the same results. Among the target volumes, the CTV dose coverage was relatively less sensitive to changes compared with the PTV. This could be due to the geometric concept of PTV. In our study, changes in PTV dose coverage for most patients were not prominent. The cumulative mean dose differences for PTVs were within ±4% and clinically insignificant for all except Patient 5. Patient 5 had slightly higher variation in PTV doses owing to changes in the neck position.
Lee et al20 used a deformable registration algorithm to register the daily megavoltage CT images to original planning kV CT and observed significant dose variations in parotid glands as a result of interfractional anatomic changes. Among all critical structures, the parotid glands have been shown to be more sensitive to volume changes during treatment.8,10,13 In our study, the differences between planned and delivered parotid mean doses varied in the patient sample. V26 and D50% of parotids mirrored the changes in mean doses. Often in inverse planning, sparing parotids closer to high dose volumes are attempted, which results in the formation of “high dose gradients”. In such scenarios, volume shrinkage results in more than intended doses owing to the migration of parotids medially towards the high dose volumes. This was the reason for increased doses of ipsilateral parotids. In Patients 4, 6 and 7, less than planned doses for contralateral parotids were due to the shrinkage along the superior direction also, resulting in migration away from the target. Generally, the increase in contralateral parotid mean doses was not significant as compared with ipsilateral parotids. This may be due to the absence of high dose gradients and relatively lesser volume reduction than, those parotids closer to high-dose regions. Studies have also reported the dependence of volume reduction on the planned mean doses.20,21 Hence, a significant reduction in parotid volumes may also be a criterion to determine the necessity for replanning. Most patients had variation in spinal cord doses owing to changes in neck position during each CBCT. The decrease in neck volume over the treatment course had led to improper positioning. The rotational errors in setup cannot be corrected by couch shifts alone and effects of such errors on the spinal cord are not negligible.
The ART concept involves monitoring the anatomical changes regularly and changing the treatment plan as and when required. Patients with profound anatomical changes during the initial phase of treatment should not be ignored as they could benefit more from replanning. Replanning improves the coverage of PTVs besides compensating for the dosimetric deterioration caused by anatomical changes during treatment. The changes can be monitored with CBCT images and the necessity for replanning could be established based on the analysis of deformed pCT. Replanning is not time specific, but is very much patient specific. The limitation of present study is the sample size and the use of weekly rather than daily CBCTs. Validation of DIR algorithm was not performed in this study and has been reported by Ramadaan et al27 Lack of repeat CT for the selected patients meant that comparison of dCT against repeat CT, considered to be the gold standard, was not possible.
CONCLUSION
ART has been suggested as a possible solution to the anatomical changes occurring during the course of radiotherapy. Continuous monitoring of anatomic changes and patient-specific replanning strategy can be used during the treatment to avoid critical structure complications. CBCT images acquired as part of setup verification have adequate information about the anatomical changes. From our study, it is feasible to use pCT deformed to CBCTs to estimate delivered doses. DIR-based offline ART could possibly establish the necessity for replanning.
Contributor Information
Anantharaman Ayyalusamy, Email: ananth18raman@yahoo.co.in.
Subramani Vellaiyan, Email: vsmani_ananth@yahoo.com.
Subramanian Shanmugam, Email: saishanmugam@rediffmail.com.
REFERENCES
- 1.Holt A, Van Gestel D, Arends MP, Korevaar EW, Schuring D, Kunze-Busch MC, et al. Multi-institutional comparison of volumetric modulated arc therapy vs. intensity-modulated radiation therapy for head-and-neck cancer: a planning study. Radiat Oncol 2013; 8: 1. doi: https://doi.org/10.1186/1748-717X-8-26 [DOI] [PMC free article] [PubMed] [Google Scholar]
- 2.Syam Kumar SA, Vivekanandan N, Sriram P. A study on conventional IMRT and RapidArc treatment planning techniques for head and neck cancers. Rep Pract Oncol Radiother 2012; 17: 168–75. doi: https://doi.org/10.1016/j.rpor.2012.01.009 [DOI] [PMC free article] [PubMed] [Google Scholar]
- 3.Bujold A, Craig T, Jaffray D, Dawson LA. Image-guided radiotherapy: has it influenced patient outcomes? Semin Radiat Oncol 2012; 22: 50–61. doi: https://doi.org/10.1016/j.semradonc.2011.09.001 [DOI] [PubMed] [Google Scholar]
- 4.Jaffray DA, Siewerdsen JH, Wong JW, Martinez AA. Flat-panel cone-beam computed tomography for image-guided radiation therapy. Int J Radiat Oncol Biol Phys 2002; 53: 1337–49. doi: https://doi.org/10.1016/S0360-3016(02)02884-5 [DOI] [PubMed] [Google Scholar]
- 5.Stock M, Pasler M, Birkfellner W, Homolka P, Poetter R, Georg D. Image quality and stability of image-guided radiotherapy (IGRT) devices: a comparative study. Radiother Oncol 2009; 93: 1–7. doi: https://doi.org/10.1016/j.radonc.2009.07.012 [DOI] [PMC free article] [PubMed] [Google Scholar]
- 6.Richter A, Hu Q, Steglich D, Baier K, Wilbert J, Guckenberger M, et al. Investigation of the usability of conebeam CT data sets for dose calculation. Radiat Oncol 2008; 3: 42. doi: https://doi.org/10.1186/1748-717X-3-42 [DOI] [PMC free article] [PubMed] [Google Scholar]
- 7.Usui K, Ichimaru Y, Okumura Y, Murakami K, Seo M, Kunieda E, et al. Dose calculation with a cone beam CT image in image-guided radiation therapy. Radiol Phys Technol 2013; 6: 107–14. doi: https://doi.org/10.1007/s12194-012-0176-z [DOI] [PubMed] [Google Scholar]
- 8.Barker JL, Jr, Garden AS, Ang KK, O'Daniel JC, Wang H, Court LE, et al. Quantification of volumetric and geometric changes occurring during fractionated radiotherapy for head-and-neck cancer using an integrated CT/linear accelerator system. Int J Radiat Oncol Biol Phys 2004; 59: 960–70. doi: https://doi.org/10.1016/j.ijrobp.2003.12.024 [DOI] [PubMed] [Google Scholar]
- 9.van Herk M. Errors and margins in radiotherapy. Semin Radiat Oncol 2004; 14: 52–64. doi: https://doi.org/10.1053/j.semradonc.2003.10.003 [DOI] [PubMed] [Google Scholar]
- 10.Castadot P, Lee JA, Geets X, Grégoire V. Adaptive radiotherapy of head and neck cancer. Semin Radiat Oncol 2010; 20: 84–93. doi: https://doi.org/10.1016/j.semradonc.2009.11.002 [DOI] [PubMed] [Google Scholar]
- 11.Han C, Chen YJ, Liu A, Schultheiss TE, Wong JY. Actual dose variation of parotid glands and spinal cord for nasopharyngeal cancer patients during radiotherapy. Int J Radiat Oncol Biol Phys 2008; 70: 1256–62. doi: https://doi.org/10.1016/j.ijrobp.2007.10.067 [DOI] [PubMed] [Google Scholar]
- 12.O'Daniel JC, Garden AS, Schwartz DL, Wang H, Ang KK, Ahamad A, et al. Parotid gland dose in intensity-modulated radiotherapy for head and neck cancer: is what you plan what you get?. Int J Radiat Oncol Biol Phys 2007; 69: 1290–6. doi: https://doi.org/10.1016/j.ijrobp.2007.07.2345 [DOI] [PMC free article] [PubMed] [Google Scholar]
- 13.Hansen EK, Bucci MK, Quivey JM, Weinberg V, Xia P. Repeat CT imaging and replanning during the course of IMRT for head-and-neck cancer. Int J Radiat Oncol Biol Phys 2006; 64: 355–62. doi: https://doi.org/10.1016/j.ijrobp.2005.07.957 [DOI] [PubMed] [Google Scholar]
- 14.Kadoya N. Use of deformable image registration for radiotherapy applications. J Radiol Radiat Ther 2014; 2: 1042. [Google Scholar]
- 15.Veiga C, McClelland J, Moinuddin S, Lourenço A, Ricketts K, Annkah J, et al. Toward adaptive radiotherapy for head and neck patients: feasibility study on using CT-to-CBCT deformable registration for “dose of the day” calculations. Med Phys 2014; 41: 031703. doi: https://doi.org/10.1118/1.4864240 [DOI] [PubMed] [Google Scholar]
- 16.Castadot P, Lee JA, Parraga A, Geets X, Macq B, Grégoire V. Comparison of 12 deformable registration strategies in adaptive radiation therapy for the treatment of head and neck tumors. Radiother Oncol 2008; 89: 1–12. doi: https://doi.org/10.1016/j.radonc.2008.04.010 [DOI] [PubMed] [Google Scholar]
- 17.Hou J, Guerrero M, Chen W, D'Souza WD. Deformable planning CT to cone-beam CT image registration in head-and-neck cancer. Med Phys 2011; 38: 2088–94. doi: https://doi.org/10.1118/1.3554647 [DOI] [PubMed] [Google Scholar]
- 18.Wang H, Dong L, O'Daniel J, Mohan R, Garden AS, Ang KK, et al. Validation of an accelerated ‘demons’ algorithm for deformable image registration in radiation therapy. Phys Med Biol 2005; 50: 2887–905. doi: https://doi.org/10.1088/0031-9155/50/12/011 [DOI] [PubMed] [Google Scholar]
- 19.Eclipse SmartAdapt reference guide; 2014. 60.
- 20.Lee C, Langen KM, Lu W, Haimerl J, Schnarr E, Ruchala KJ, et al. Assessment of parotid gland dose changes during head and neck cancer radiotherapy using daily megavoltage computed tomography and deformable image registration. Int J Radiat Oncol Biol Phys 2008; 71: 1563–71. doi: https://doi.org/10.1016/j.ijrobp.2008.04.013 [DOI] [PubMed] [Google Scholar]
- 21.Vásquez Osorio EM, Hoogeman MS, Al-Mamgani A, Teguh DN, Levendag PC, Heijmen BJ. Local anatomic changes in parotid and submandibular glands during radiotherapy for oropharynx cancer and correlation with dose, studied in detail with nonrigid registration. Int J Radiat Oncol Biol Phys 2008; 70: 875–82. doi: https://doi.org/10.1016/j.ijrobp.2007.10.063 [DOI] [PubMed] [Google Scholar]
- 22.Fung WW, Wu VW, Teo PM. Developing an adaptive radiation therapy strategy for nasopharyngeal carcinoma. J Radiat Res 2014; 55: 293–304. doi: https://doi.org/10.1093/jrr/rrt103 [DOI] [PMC free article] [PubMed] [Google Scholar]
- 23.Castelli J, Simon A, Louvel G, Henry O, Chajon E, Nassef M, et al. Impact of head and neck cancer adaptive radiotherapy to spare the parotid glands and decrease the risk of xerostomia. Radiat Oncol 2015; 10: 1. doi: https://doi.org/10.1186/s13014-014-0318-z [DOI] [PMC free article] [PubMed] [Google Scholar]
- 24.Schwartz DL, Garden AS, Shah SJ, Chronowski G, Sejpal S, Rosenthal DI, et al. Adaptive radiotherapy for head and neck cancer—dosimetric results from a prospective clinical trial. Radiother Oncol 2013; 106: 80–4. doi: https://doi.org/10.1016/j.radonc.2012.10.010 [DOI] [PubMed] [Google Scholar]
- 25.Wu Q, Chi Y, Chen PY, Krauss DJ, Yan D, Martinez A. Adaptive replanning strategies accounting for shrinkage in head and neck IMRT. Int J Radiat Oncol Biol Phys 2009; 75: 924–32. doi: https://doi.org/10.1016/j.ijrobp.2009.04.047 [DOI] [PubMed] [Google Scholar]
- 26.Brouwer CL, Steenbakkers RJ, Langendijk JA, Sijtsema NM. Identifying patients who may benefit from adaptive radiotherapy: Does the literature on anatomic and dosimetric changes in head and neck organs at risk during radiotherapy provide information to help?. Radiother Oncol 2015; 115: 285–94. doi: https://doi.org/10.1016/j.radonc.2015.05.018 [DOI] [PubMed] [Google Scholar]
- 27.Ramadaan IS, Peick K, Hamilton DA, Evans J, Iupati D, Nicholson A, et al. Validation of Varian’s SmartAdapt® deformable image registration algorithm for clinical application. Radiat Oncol 2015; 10: 1. doi: https://doi.org/10.1186/s13014-015-0372-1 [DOI] [PMC free article] [PubMed] [Google Scholar]


