Abstract
Event discovery aims to discover a temporal segment of interest, such as human behavior, actions or activities. Most approaches to event discovery within or between time series use supervised learning. This becomes problematic when some relevant event labels are unknown, are difficult to detect, or not all possible combinations of events have been anticipated. To overcome these problems, this paper explores Common Event Discovery (CED), a new problem that aims to discover common events of variable-length segments in an unsupervised manner. A potential solution to CED is searching over all possible pairs of segments, which would incur a prohibitive quartic cost. In this paper, we propose an efficient branch-and-bound (B&B) framework that avoids exhaustive search while guaranteeing a globally optimal solution. To this end, we derive novel bounding functions for various commonality measures and provide extensions to multiple commonality discovery and accelerated search. The B&B framework takes as input any multidimensional signal that can be quantified into histograms. A generalization of the framework can be readily applied to discover events at the same or different times (synchrony and event commonality, respectively). We consider extensions to video search and supervised event detection. The effectiveness of the B&B framework is evaluated in motion capture of deliberate behavior and in video of spontaneous facial behavior in diverse interpersonal contexts: interviews, small groups of young adults, and parent-infant face-to-face interaction.
1 Introduction
Event detection is a central topic in computer vision. Most approaches to event detection use one or another form of supervised learning. Labeled video from experts or naive annotators is used as training data, classifiers are trained, and then used to detect individual occurrences or pre-defined combinations of occurrences in new video. While supervised learning has well-known advantages for event detection, limitations might be noted. One, because accuracy scales with increases in the number of subjects for whom annotated video is available, sufficient numbers of training subjects are essential [12, 25]. With too few training subjects, supervised learning is under-powered. Two, unless an annotation scheme is comprehensive, important events may go unlabeled, unlearned, and ultimately undetected. Three and perhaps most important, discovery of similar or matching events is limited to combinations of actions that have been specified in advance. Unanticipated events go unnoticed. To enable the discovery of novel recurring or matching events or patterns, unsupervised discovery is a promising option.
To detect recurring combinations of actions without pre-learned labels, this paper addresses Common Event Discovery (CED), a relatively unexplored problem that discovers common temporal events in variable-length segments in an unsupervised manner. The goal of CED is to detect pairs of segments that retain maximum visual commonality. CED is fully unsupervised, so no prior knowledge about events is required. We need not know what the common events are, how many there are, or when they may begin and end. Fig. 1 illustrates the concept of CED for video. In an exhaustive search of variable-length video segments, kissing and handshake event matches are discovered between videos.
Fig. 1.
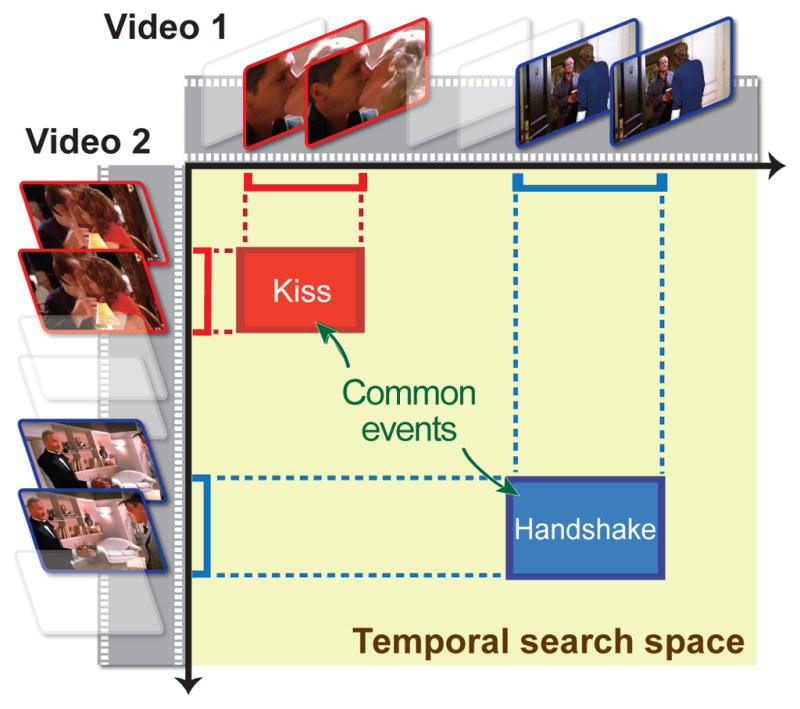
An illustration of Common Event Discovery (CED). Given two videos, common events (kiss and handshake) of different lengths in the two videos are discovered in an unsupervised manner.
A naive approach to CED would be to use a sliding window. That is, to exhaustively search all possible pairs of temporal segments and select pairs that have the highest similarities. Because the complexity of sliding window methods is quartic with the length of video, i.e., 𝒪(m2n2) for two videos of lengths m and n, this cost would be computationally prohibitive in practice. Even in relatively short videos of 200 and 300 frames, there would be in excess of three billion possible matches to evaluate at different lengths and locations.
To meet the computational challenge, we propose to extend the Branch-and-Bound (B&B) method for CED. For supervised learning, B&B has proven an efficient technique to detect image patches [35] and video volumes [77]. Because previous bounding functions of B&B are designed for supervised detection or classification, which require pre-trained models, previous B&B methods could not be directly applied to CED. For this reason, we derive novel bounding functions for various commonality measures, including ℓ1/ℓ2 distance, intersection kernel, χ2 distance, cosine similarity, symmeterized cross entropy, and symmeterized KL-divergence.
For evaluation, we apply the proposed B&B to application of discovering events at the same or different times (synchrony and event commonality, respectively), and variable-length segment-based event detection. We conduct the experiments on three datasets of increasing complexity: Posed motion capture and unposed, spontaneous video of mothers and their infants and of young adults in small groups. We report distance and similarity metrics and compare discovery with expert annotations. Our main contributions are:
A new CED problem: Common Event Discovery (CED) in video is a relatively unexplored problem in computer vision. Results indicate that CED achieves moderate convergence with supervised approaches, and is able to identify novel patterns both within and between time series.
A novel, unsupervised B&B framework: With its novel bounding functions, the proposed B&B framework is computationally efficient and entirely general. It takes any signals that can be quantified into histograms and with minor modifications adapts readily to diverse applications. We consider four: common event discovery, synchronous event discovery, video search, and supervised segment-based event detection.
A preliminary version of this work appeared as [13, 14]. In this paper, we integrate these two approaches with video search and supervised segment-based event detection, and provide a principal way of deriving bounding functions in the new, unsupervised framework. We also present new experiments on supervised event detection with comparisons to alternative methods. The rest of this paper is organized as follows. Sec. 2 discusses related work. Sec. 3 presents the proposed B&B framework for common event discovery. Sec. 4 applies the framework to tasks of varying complexity. Sec. 5 extends the B&B framework to discovery among more than two videos and considers acceleration using warm-start strategy and parallelism. Sec. 6 provides evaluation on unsupervised and supervised tasks with unsynchronous and synchronous videos. Sec. 7 concludes the paper with future work.
2 Related Work
This paper is closely related to event detection methods, and unsupervised discovery in images and videos. Below we review each in turn.
2.1 Event detection
CED closely relates to event detection. Below we categorize prior art into supervised and unsupervised approaches, and discuss each in turn.
Supervised event detection
Supervised event detection is well-developed in computer vision. Events can be defined as temporal segments that involve either a single pattern of interest or an interaction between multiple patterns. For single-pattern event detection, popular examples include facial expression recognition [19,38,42,59,69], surveillance system [22], activity recognition [20, 23, 32, 56, 74, 75], and sign language recognition [15]. These approaches aim to detect a temporal pattern that associates with a pre-defined human behavior, action, or activity.
Events may also be defined as the co-occurrence of discrete actions or activities. For instance, Brand et al. [8] treated each arm as a process, and proposed to recognize gestures by modeling motion trajectories between multiple processes using coupled hidden Markov models (CHMMs). Following up, Oliver and Pentland [53] proposed a CHMM-based system, with pedestrian trajectories, to detect and recognize interactions between people, such as following another person, altering one’s path to encounter another, etc. Hongeng and Nevatia [30] proposed a hierarchical trajectory representation along with a temporal logic network to address complex interactions such as a “stealing” scenario. More recently, Liu et al. [39] proposed to recognize group behavior in AAL environment (nursing homes), considering a switch control module that alternates between two HMM-based methods built on motion and poses of individuals. Messinger et al. [45] focused on specific annotated social signals, i.e., smiling and gaze, and characterized the transition between behavior states by a maximum likelihood approach. Interested readers are referred to [10] for a review. These techniques, however, require adequate labeled training data, which can be time-consuming to collect and not always available.
Unsupervised event detection
The closest to our study is unsupervised approaches that require no annotations. For instance, Zheng et al. [78] presented a coordinated motion model to detect motion synchrony in a group of individuals such as fish schools and bird flocks. Zhou et al. [79] proposed aligned cluster analysis that extended spectral clustering to cluster time series, and applied the technique to discover facial events in unsupervised manner. On the other hand, time series motifs, defined as the closest pair of subsequences in one time series stream, can be discovered with a tractable exact algorithm [48], or an approximated algorithm that is capable of tackling never-ending streams [6]. Some attempts at measuring interactional synchrony include using face tracking and expressions [76], and rater-coding and pixel changes between adjacent frames [62]. Nayak et al. [52] presented iterated conditional modes to find most recurrent sign in all occurrences of sign language sentences.
Common events refer to two or more actions that are similar either in form or in timing. The meaning of similarity depends upon the choice of features, similarity metrics, and the threshold to accept similarity. While cluster analysis or mode finding could be considered a potential method, it is not well-suited for common event discovery for some reasons. First, cluster analysis and mode finding methods are designed for discovering the instances or values that appear most often; yet, common events could appear rarely. Second, cluster analysis and mode finding methods consider all instances to obtain statistical “groups” or “modes”; common events are a sparse subset of instances with high similarity. Finally, cluster analysis and mode finding methods for time series require temporal segmentation as a pro-processing procedure; common event discovery has no such requirement.
2.2 Unsupervised discovery
For static images, unsupervised discovery of re-occurring patterns has proven informative, driven by wide applications in co-segmentation [11, 40, 49], grammar learning [81], irregularity detection [7] and automatic tagging [61] have been driving forces. Discovery of common patterns in videos is a relatively unexplored problem. See Wang et al. [71] for a survey.
For video, to our best knowledge, this study is the first to discover common events in an unsupervised manner. Our work is inspired by recent success on using B&B for efficient search. Lampert et al. [35] proposed Efficient Subwindow Search (ESS) to find the optimal subimage that maximizes the Support Vector Machine score of a pre-trained classifier. Hoai et al. [29] combine SVM with dynamic programming for efficient temporal segmentation. Yuan et al. [77] generalized Lampert’s 4-D search to the 6-D Spatio-Temporal Branch-and-Bound (STBB) search by incorporating time, to search for spatiotemporal volumes. However, unlike CED, these approaches are supervised and require a training stage.
Recently, there have been interests on temporal clustering algorithms for unsupervised discovery of human actions. Wang et al. [72] used deformable template matching of shape and context in static images to discover action classes. Si et al. [65] learned an event grammar by clustering event co-occurrence into a dictionary of atomic actions. Zhou et al. [80] combined spectral clustering and dynamic time warping to cluster time series, and applied it to learn taxonomies of facial expressions. Turaga et al. [68] used extensions of switching linear dynamical systems for clustering human actions in video sequences. However, if we cluster two sequences that each has only one segment in common, previous clustering methods would likely need many clusters to find the common segments. In our case, CED focuses only on common segments and avoids clustering all video segments, which is computationally expensive and prone to local minimum.
Another unsupervised technique related to CED is motif detection [47, 48]. Time series motif algorithms find repeated patterns within a single sequence. Minnen et al. [47] discovered motifs as high-density regions in the space of all subsequences. Mueen and Keogh [48] further improved the motif discovery problem using an online technique, maintaining the exact motifs in real-time performance. Nevertheless, these work detects motifs within only one sequence, but CED considers two (or more) sequences. Moreover, it is unclear how these technique can be robust to noise.
Finally, CED is also related to the longest common subsequence (LCS) [27, 43, 54]. The LCS problem consists on finding the longest subsequence that is common to a set of sequences (often just two) [54,73]. Closer to our work is the algorithm for discovering longest consecutive common subsequence (LCCS) [73], which finds the longest contiguous part of original sequences (e.g., videos). However, different from CED, these approaches have a major limitation in that they find only identical subsequences, and hence are sensitive to noisy signals in realistic videos.
3 A Branch-and-Bound Framework for Common Event Discovery (CED)
This section describes our representation of time series, a formulation of CED, the proposed B&B framework, and the newly derived bounding functions that fit into the B&B framework.
3.1 Representation of time series
Bag of Temporal Words (BoTW) model [66, 77] has been shown effective in many video analysis problems, such as action recognition [9,28,36,41,58]. This section modifies the BoTW model to describe the static and dynamic information of a time series. Suppose a time series S can be described as a set of feature vectors {xj} for each frame j (see notation1). For instance, a feature vector can be facial shape in face videos or joint angles in motion capture videos. Given such features, we extract two types of information: observation info from a single frame, and interaction info from two consecutive frames. Denote as a temporal segment between the b-th and the e-th frames, we consider a segment-level feature mapping:
| (1) |
The observation info ϕobs(xj) describes the “pseudo” probability of xj belonging to a latent state, and the interaction info ϕint(xj) describes transition probability of states between two consecutive frames. To obtain ϕobs(xj), we performed k-means to find K centroids as the hidden states. Then, we computed ϕobs(xj) ∈ [0, 1]K with the k-th element computed as exp(−γ||xj − ck||2) and γ chosen as an inverse of the median distance of all samples to the centroids. An interaction info ϕint(xj) ∈ [0, 1]K2 is computed as:
| (2) |
where ⊗ denotes a Kronecker product of two observation vectors. As a result, each temporal segment is represented as an ℓ2-normalized feature vector of dimension (K2+K).
Because this representation accepts almost arbitrary features, any signal, even with negative values, that can be quantified into histograms can be directly applied. One notable benefit of the histogram representation is that it allows for fast recursive computation using the concept of integral image [70]. That is, the segment-level representation for S[b, e] can be computed as φS[b,e] = φS[1,e] − φS[1,b−1], which only costs 𝒪(1) per evaluation. Based on the time series representation, we develop our approach below.
3.2 Problem formulation
To establish notion, we begin with two time series S1 and S2 with m and n frames respectively. The goal of common event discovery (CED) is to find two temporal segments with intervals [b1, e1] ⊆ [1, m] and [b2, e2] ⊆ [1, n] such that their visual commonality is maximally preserved. We formulate CED:
| (3) |
where f(·, ·) is a commonality measure between two time series representations, and ℓ controls the minimal length for each temporal segment to avoid a trivial solution. More details about f(·, ·) are discussed in Sec. 3.4. Problem (3) is non-convex and non-differentiable, and thus standard convex optimization methods can not be directly applied. A naive solution is an exhaustive search over all possible locations for {b1, e1, b2, e2}. However, it leads to an algorithm with computational complexity 𝒪(m2n2), which is prohibitive for regular videos with hundreds or thousands of frames. To address this issue, we introduce a branch-and-bound (B&B) framework to efficiently and globally solve (3).
Note that, although ℓ controls the minimal length of discovered temporal segments, the optimal solution can be of length greater than ℓ. For instance, consider two 1-D time series S1 = [1, 2, 2, 1] and S2 = [1, 1, 3]. Suppose we measure f(·, ·) by ℓ1 distance, where smaller values indicate higher commonality. Let the minimal length ℓ = 3, and represent their 3-bin histograms as φS1[1,4] = [2, 2, 0], φS1[1,3] = [1, 2, 0] and φS2 = [2, 0, 1]. Showing the distance fℓ1(φS1[1,4], φS2) = 3 < 4 = fℓ1 (φS1[1,3], φS2), we prove by contradiction.
3.3 Optimization by Branch and Bound (B&B)
With a proper bounding function, B&B has been shown empirically more efficient than straight enumeration. B&B can eliminate regions that provably do not contain an optimal solution. This can be witnessed in many computer vision problems, e.g., object detection [35,37], video search [77], pose estimation [67] and optimal landmark detection [2]. Inspired by previous success, this section describes the proposed B&B framework that globally solves (3).
Problem interpretation
As depicted in Fig. 1, we interpret Problem (3) as searching a rectangle in the 2-D space formed by two time series. A rectangle r ≐ [b1, e1, b2, e2] in the search space indicates one candidate solution corresponding to S1[b1, e1] and S2[b2, e2]. To allow a more efficient representation for searching, we parameterize each step as searching over sets of candidate solutions. That is, we search over intervals instead of individual value for each parameter. Each parameter interval corresponds to a rectangle set R ≐ B1 × E1 × B2 × E2 in the search space, where and indicate tuples of parameters ranging from frame lo to frame hi. Given the rectangle set R, we denote the longest and the shortest possible segments as Si+ and Si− respectively. We denote |R| as the number of rectangles in R. Fig. 2(a) shows an illustration of the notation.
Fig. 2.
An example of CED on two 1-D time series: (a) An illustration of our notation (see Sec. 3.3). (b) Searching intervals at iterations (it) #1, #300 and #1181 over sequences S1 and S2. Commonalities S1[b1, e1] and S2[b2, e2] are discovered at convergence (#1811). (c) Convergence curve w.r.t. bounding value and #it. (d) Histograms of the discovered commonalities. In this example, a naive sliding window approach needs more than 5 million evaluations, while the proposed B&B method converges at iteration 1181 using ℓ = 20.
The B&B framework
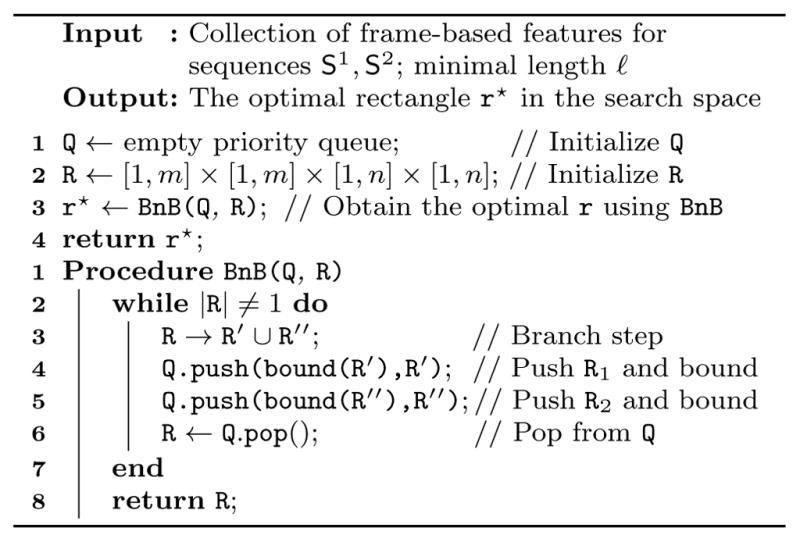
With the problem interpreted above, we describe here the proposed B&B framework. Algorithm 1 summarizes the procedure. To maintain the search process, we employ a priority queue denoted as Q. Each state in Q contains a rectangle set R, its upper bound u(R) and lower bound l(R). Each iteration starts by selecting a rectangle set R from the top state, which is defined as the state containing the minimal upper bound for f(·, ·). Given this structure, the algorithm repeats a branch step and a bound step until R contains a unique entry.
Algorithm 1.
Common Event Discovery (CED)
|
In the branch step, each rectangle set R is split by its largest interval into two disjoint subsets. For example, suppose E2 is the largest interval, then R → R′ ∪ R″ where and . In the bound step, we calculate the bounds for each rectangle set, and then update new rectangle sets and their bounds into Q. The computed bounds tell the worst possible values in f(·, ·), and therefore enable the algorithm to efficiently discard unlikely rectangle sets where their bounds are worse than the current best. The algorithm terminates when R contains a unique entry, i.e., |R|=1. Fig. 2(b)–(d) show an example of CED for discovering commonality between two 1-D time series. Despite that in the worst case the complexity of B&B can be still 𝒪(m2n2), we will experimentally show that in general B&B is much more efficient than naive approaches.
3.4 Construction of bounding functions
One crucial aspect of the proposed B&B framework is the novel bounding functions for measuring commonality between two time series. The commonality measures can interchangeably be formed in terms of distance or similarity functions. Below we describe the conditions of bounding functions, and then construct the bounds.
Conditions of bounding functions
Recall that R represents a rectangle set and r ≐ [bi, ei, bj, ej] represents a rectangle corresponding to two subsequences Si[bi, ei] and Sj[bj, ej]. Without loss of generality, we denote f(r) = f(φSi[bi,ei], φSj [bj,ej]) as the commonality measure between Si[bi, ei] and Sj[bj, ej]. To harness the B&B framework, we need to find an upper bound u(R) and a lower bound l(R) that bounds the values of f over a set of rectangles. A proper bounding function has to satisfy the conditions:
, Bounding conditions
,
u(R) = f(r) = l(R), if r is the only element in R.
Conditions a) and b) ensure that u(R) and l(R) appropriately bound all candidate solutions in R from above and from below, whereas c) guarantees the algorithm to converge to the optimal solution. With both lower and upper bounds, one can further prune the priority queue for speeding the search, i.e., eliminate rectangle sets R′ that satisfy l(R′) > u(R) [3].
Bound histogram bins
Let Si denote the i-th time series and can be represented as an unnormalized histogram hi or a normalized histogram ĥi using the representation in Sec. 3.1. Denote and as the k-th bin of hi and ĥi, respectively. The normalized histogram is defined as , where . is the Euclidean norm of histogram of Si. Considering histograms of Si+ and Si−, we can bound their k-th histogram bin:
| (4) |
Given a rectangle r=[b1, e1, b2, e2] and denote and . For normalized histograms, we use the fact that |Si−| ≤ |Si[bi, ei]| ≤ |Si+|. Then we can rewrite (4) for bounding the normalized bins:
| (5) |
Below we use Eq. (5) to construct bounds for various commonality measures with normalized histograms, whereas those with unnormalized histograms can be likewise obtained.
Bound commonality measures
Given two time series Si and Sj represented as normalized histograms ĥi and ĥj respectively, we provide bounding functions for various commonality measures: ℓ1/ℓ2 distance, histogram intersection, χ2 distance, cosine similarity, symmetrized KL divergence, and symmetrized cross entropy. These measures have been widely applied to many tasks such as object recognition [21, 35] and action recognition [9,28,36,41,58].
1) ℓ1/ℓ2 distance
Applying the min/max operators on (4), we get
| (6) |
Reordering the inequalities, we obtain the upper bound uk and lower bound lk for the k-th histogram bin:
| (7) |
Summing over all histogram bins, we obtain the bounds of the ℓ1 distance for two unnormalized histograms hi, hj:
| (8) |
For normalized histograms ĥi, ĥj, we obtain their bounds following same operations of (6) and (7):
| (9) |
where
| (10) |
Deriving bounds for ℓ2-distance can be written as:
| (11) |
where (·)+ = max(0, ·) is a non-negative operator.
2) Histogram intersection
Given two normalized histograms, we define their intersection distance by the Hilbert space representation [63]:
| (12) |
Following (5) and (6), we obtain its lower bound and upper bound:
| (13) |
3) χ2 distance
The χ2 distance has been proven to be effective to measure distance between histograms. The χ2 distance is defined as:
| (14) |
Incorporating the ℓ1-bounds l̂k and ûk in (10) and the inequalities in (5), we obtain the lower bound and upper bound for fχ2 as:
| (15) |
| (16) |
4) Cosine similarity
Treating two normalized histograms ĥi and ĥj as two vectors in the inner product space, we can measure the similarity as their included cosine angle:
| (17) |
Using (4) and the fact that ||Si−||≤||Si[bi, ei]||≤||Si+||, we obtain the bounds:
| (18) |
5) Symmetrized KL divergence
By definition, the normalized histograms ĥi and ĥj are non-negative and sum to one, and thus can be interpreted as two discrete probability distributions. Their similarity can be measured using the symmetrized KL divergence:
| (19) |
where DKL(ĥi||ĥj) is the KL divergence of ĥj from ĥi. From (5) and that , we have . Then, we obtain the bounds for (19):
| (20) |
6) Symmetrized cross entropy
The symmetrized cross entropy [50] measures the average number of bins needed to identify an event by treating each other as the true distribution. Similar to KL divergence that treats ĥi and ĥj as two discrete probability distributions, the entropy function is written as:
| (21) |
Recall (5) and that , we obtain the bounds:
| (22) |
Above we have reported derivations for six commonly used measures. However, choice of one or another is influenced by a variety of factors, such as the nature of the data, problem, preferences of individual investigators, etc. In experiments, we picked ℓ1, χ2, and KL-divergence because due to their popularity in computer vision applications. For instance, ℓ1-distance is popular in retrieval problems (e.g., [27, 57]), χ2-distance in object recognition (e.g., [21,35]), and KL-divergence in measuring similarity between distributions (e.g., Gaussian mixtures for image segmentation [26]).
Algorithm 2.
Synchrony Discovery (SD)
4 Searching Scenarios
With the B&B framework and various bounds derived in the previous section, this section discusses unsupervised and supervised searching scenarios that can be readily applied. Fig. 3 illustrates the searching scenarios in terms of different applications. The first application, common event discovery (CED), as has been discussed in Sec. 3, has the most general form and the broadest search space. Below we discuss others in turn.
Fig. 3.
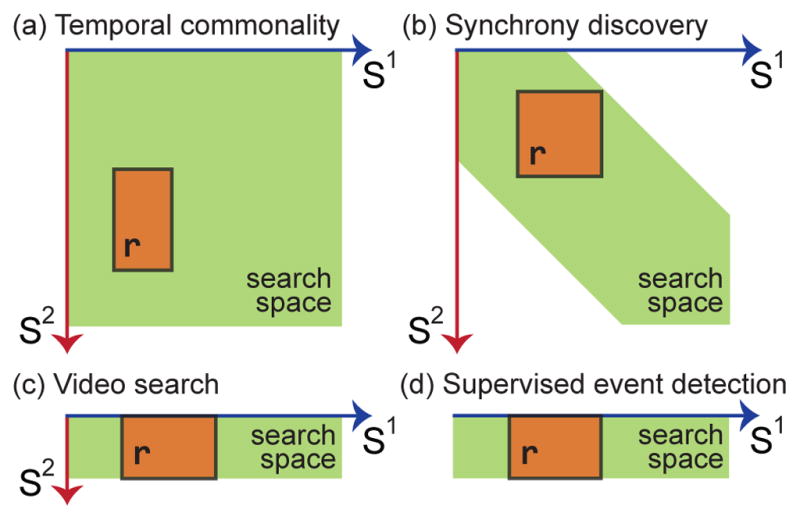
Searching scenarios readily applicable to the proposed B&B framework: (a) Common event discovery (CED), (b) synchrony discovery (SD), (c) video search (VS), and (d) supervised segment-based event detection (ED). Green area indicates the search space; an orange box indicates a candidate solution r. (see Sec. 4 for details)
4.1 Synchrony discovery (SD)
Social interaction plays an important and natural role in human behavior. This section presents that a slight modification of CED can result in a solution to discover interpersonal synchrony, which is referred as to two or more persons preforming common actions in overlapping video frames or segments. Fig. 3(b) illustrates the idea. Specifically, synchrony discovery searches for commonalities (or matched states) among two synchronized videos S1 and S2 with n frames each. Rewriting (3), we formulate SD as:SD
| (23) |
where f(·, ·) is the commonality measure, and T is a temporal offset that allows SD to discover commonalities within a T -frame temporal window, e.g., in mother-infant interaction, the infant could start smiling after the mother leads the smile for a few seconds. A naive solution has complexity 𝒪(n4).
Algorithm
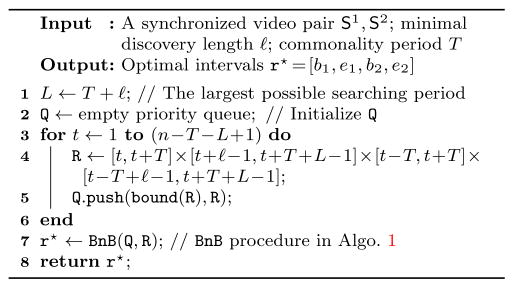
For an event to be considered as a synchrony, they have to occur within a temporal neighborhood between two videos. For this reason, we only need to search within neighboring regions in the temporal search space. Unlike CED or ESS [35] that exhaustively prunes the search space to a unique solution, we constrain the space before the search begins. In specific, we slightly modify Algorithm 1 to solve SD. Let L = T + ℓ be the largest possible period to search, we initialize a priority queue Q with rectangle sets and their associated bounds (see details in Sec. 3.4). These rectangle sets lie sparsely along the diagonal in the 2-D search space, and thus prune a large portion before the search. Once all rectangle sets are settled, the CED algorithm can be employed to find the exact optimum. Algorithm 2 summarizes the SD algorithm.
Fig. 4 shows a synthetic example of 1-D time series with two synchronies, denoted as red dots and green triangle, where one is a random permutation of another. SD discovered 3 dyads with the convergence curve in (b), and histograms of each dyad in (c)~(e). Note that the interaction feature distinguishes the temporal consistency for the first and second discovery, maintaining a much smaller distance than the third discovery.
Fig. 4.
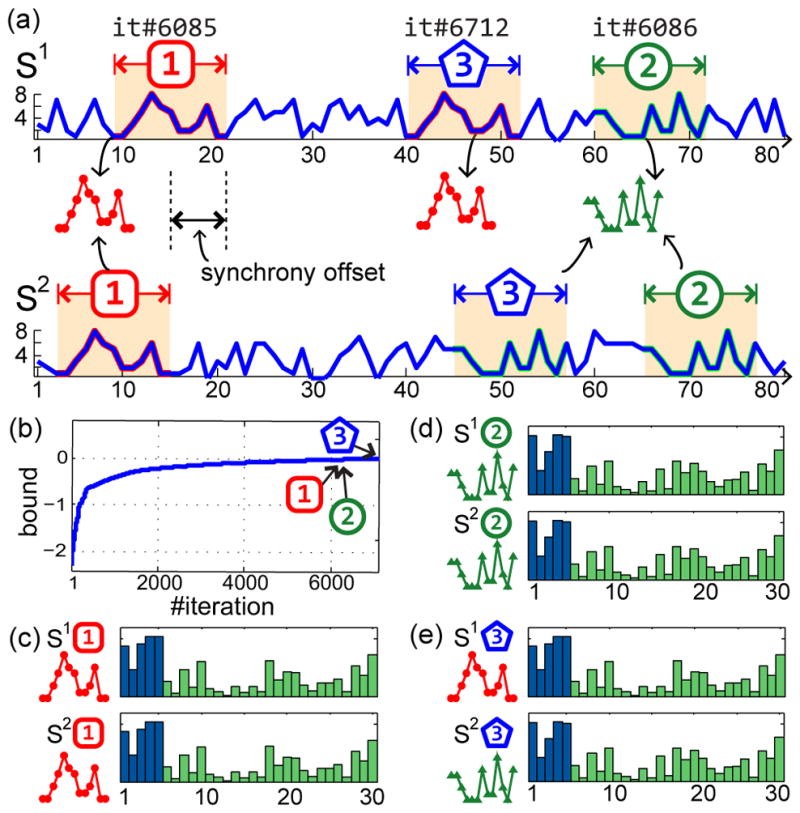
An example of SD on two 1-D time series using ℓ=13 and T = 5: (a) Top 3 discovred synchronies at different iterations; exhaustive search takes 39151 iterations. (b) The convergence curve w.r.t. bounding value and #iter. (c)~(e) Discovered synchronies and their histograms, where blue and green bars indicate the segment features ϕobs and ϕint, respectively. ϕint is 10X magnified for display purpose. The ℓ1 distances between the three histogram pairs are 6.3e-8, 1.5e-7, and 5.8e-2, respectively.
4.2 Video search (VS)
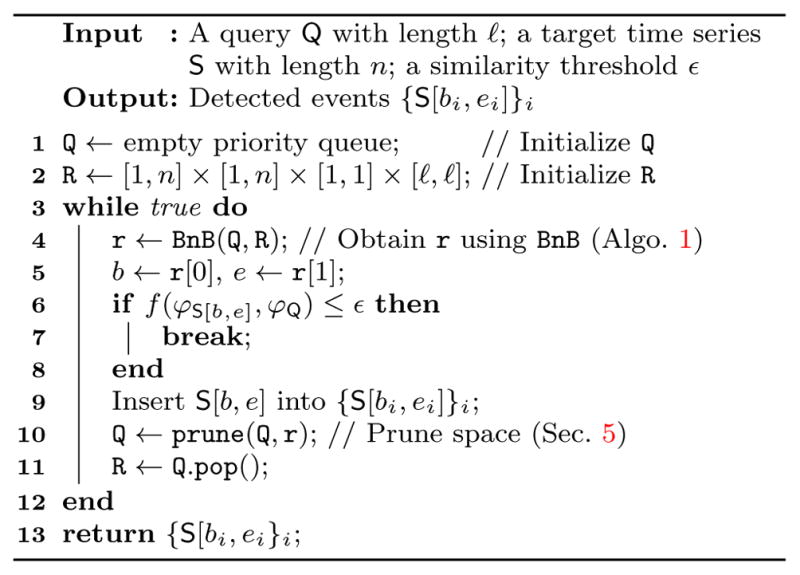
The CED algorithm can be also useful for efficient searching for a time series with similar content. That is, given a query time series, search for common temporal segments in a longer video in an efficient manner. Fig. 3(c) illustrates the idea. More formally, let Q be the query time series with length ℓ, we find in the target time series S by modifying (3) as:VS
| (24) |
The problem now becomes searching along one axis of the search space, but it is still non-convex and non-differentiable. Nevertheless, Algorithm 1 can be directly applied to find the optimal solution by fixing the beginning and ending frame of the query time series. Note that we do not claim that VS is state-of-the-art method for video search, but just illustrate the versatility of the B&B framework. We refer interested readers to [31] for a more comprehensive survey.
4.3 Segment-based event detection (ED)
Efficiently detecting variable-length events in time series arises in a wide spectrum of applications, ranging from diseases, financial decline, speech recognition to video security. While event detection has been studied extensively in the literature, little attention has been paid to efficient inference from a pre-trained classifier. Fig. 3(d) illustrates the idea. Here we demonstrate event detection using an SVM decision function, which has been shown effective in many event detection tasks [29, 36, 58, 64].
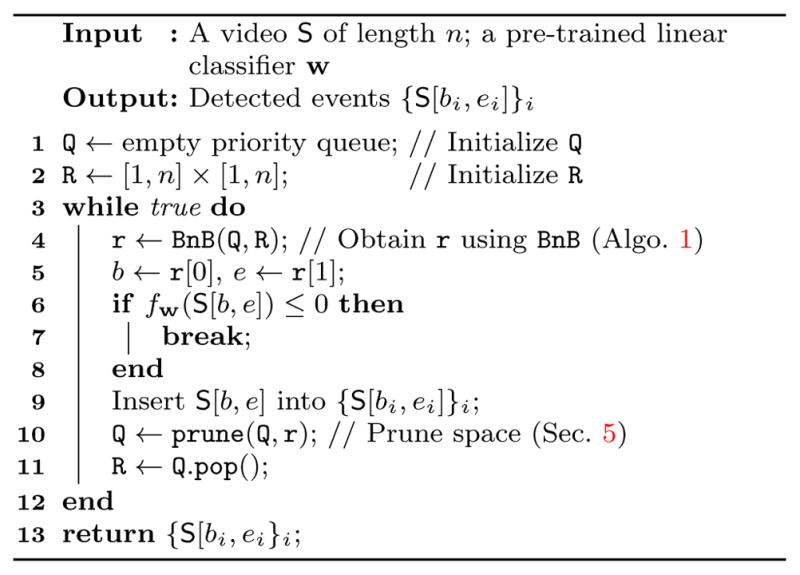
Given the BoTW representation discussed in Sec. 3.1, we represent time series by their histograms. These histograms are used to train an SVM classifier to tell whether a new time series contains an event of interest. To perform inference, temporal segmentation [36,58,64] or dynamic programming (DP) [29] is required. However, temporal segmentation for many real-world videos may not be trivial, and DP is computationally expensive to run it in large scale, especially when a time series is too long and relatively small portion of frames contain an interested event. Instead, we modify (3) for efficient inference of event detection:ED
| (25) |
where w is a pre-trained linear classifier with each element , and fw(·) = Σi αi〈·, hi〉 is the commonality measure based on the classifier. αi is the weight vector learned during SVM training.
Algorithm
The ED problem in (25) becomes supervised detection rather than unsupervised as mentioned in previous sections. The proposed bounds in Sec. 3.4 are thus inapplicable. Due to the summation property of BoTW in (1), we decompose the commonality measure into per-frame positive and negative contributions: Denote the longest and the shortest possible searching segments as S+ and S− respectively, with slight abuse of notation, we reach the bounds:
| (26) |
where R = [b, e] corresponds to time series S, instead of previous definition over two time series. With the derived bounds, the CED algorithm can be directly applied for efficient inference of an event of interest.
4.4 Comparisons with related work
The proposed CED bear similarities and differences with several related work. Below we discuss in terms of problem definition and technical details.
Problem definition
Although CED achieves discovery via “matching” between subsequences, it has fundamental differences from standard matching problems. For instance, CED allows many-to-many mapping (e.g., Sec. 6.1.2), while standard matching algorithms assume one-to-one or one-to-many mapping. Moreover, a matching problem (e.g., graph matching or linear assignment) typically measures sample-wise similarity or distance to determine correspondence between one another, e.g., a feature vector on a node in a graph. CED uses bag-of-words representation that aggregates multiple samples (i.e., frames) into one vector, making the application of standard matching methods non-trivial.
CED is also different from time warping (e.g., dynamic time warping [33]) and temporal clustering (e.g., aligned cluster analysis [79]). Time warping aims to find the optimal match between two given sequences that allow for stretched and compressed sections of the sequences. Given this goal, time warping assumes the beginning and the ending frames of the sequences to be fixed, and performs matching on entire sequence. Similarly, temporal clustering considers entire sequence in its objective, and hence is likely to include irrelevant temporal segments in one cluster. On the contrary, CED does not assume fixed beginning and ending frames, instead directly targeting at subsequence-subsequence matching, and thus enables a large portion of irrelevant information to be ignored.
Technical details
Technically, the proposed B&B framework is closely related to Efficient Subwindow Search (ESS) [35] and Spatio-Temporal B&B (STBB) [77]. However, they have at least three differences. (1) Learning framework: ESS and STBB are supervised techniques that seek for a confident region according to a pre-trained classifier. CED is unsupervised, and thus requires no prior knowledge. (2) Bounding functions: We design new bounding functions for the unsupervised CED problem. Moreover, ESS and STBB consider only upper bounds, while CED can incorporate both upper and lower bounds. (3) Search space: ESS and STBB search over spatial coordinates of an image or a spatiotemporal volume in a video, while CED focuses on temporal positions over time series.
For segment-based event detection (ED), we acknowledge its similarity with the version of STBB that omits spatial volume. Both address efficient search in a one-dimension time series, and differ in the following ways. (1) Objective: ED searches for segments with maximal, positive segment-based decision values. STBB uses a Kadane’s algorithm for frame-based max subvector search, which potentially lead to inferior detection performance because the max sum is usually found in an overly-large segment (as can be seen in Sec. 6.3). (2) Searching strategy: ED prunes the search space to avoid evaluating segments where an AU is unlikely to occur; STBB evaluates every frame. (3) Inputs: ED can take the minimal length and normalized histograms as input, yet it is unclear for STBB to accommodate such input because of the linear nature of the Kadane’s algorithm.
5 Extensions to the B&B framework
Given the aforementioned CED algorithm and variants, this section describes extensions to discovery among multiple time series and discover multiple commonalities. Due to the special diagonal nature of SD, we also introduce its acceleration using warm start and parallelism. Fig. 5 illustrates these extensions.
Fig. 5.
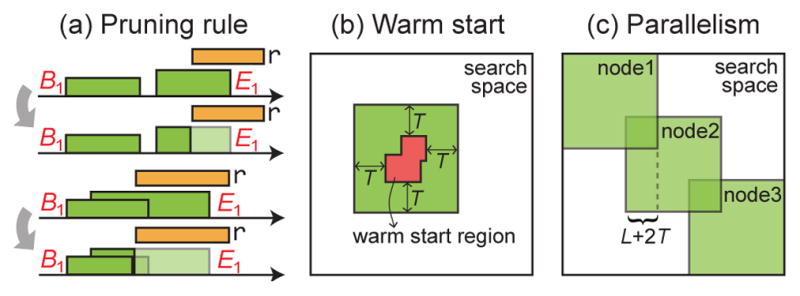
Illustration of extensions: (a) pruning rules applied to multiple-commonality discovery, (b) SD with warm start, and (c) SD with parallelism.
Discovery among multiple time series
We have described above how the B&B framework can discover temporal commonalities within a pair of time series. Here we show that the framework can be directly extended to capture commonality among multiple time series. Specifically, we formulate the discovery among N sequences by rewriting (3) as
| (27) |
where F(·) is a similarity measure for a set of sequences and defined as the sum of pairwise similarities:
| (28) |
Given a rectangle set R and a time series pair (Si, Sj), we rewrite their pairwise bounds in Sec. 3.4 as and . The bounds for F(·, ·) can be defined as:
| (29) |
Given this bound, Algos. 1 and 2 can be directly applied to discover commonalities among multiple time series.
Discover multiple commonalities
Multiple commonalities occur frequently in real videos, while the B&B framework only outputs one commonality at a time. Here, we introduce a strategy that prunes the search space to accelerate multiple commonality discovery. Specifically, we repeat the searching algorithm by passing the priority queue Q from the previous search to the next, and continue the process until a desired number of solutions is reached, or the returned commonality measure f(·, ·) is less than some threshold. The threshold can be also used for excluding undesired discoveries for the scenario where two sequences have no events in common. That is, if the first discovery does not pass a pre-defined threshold, the algorithm returns empty because the subsequent discoveries perform no better than the first one. Fig. 5(a) illustrates an example of the pruning rule when E1 overlaps with a previously discovered solution r. Because we want to exclude the same solution for the next discovery, the search region is updated by avoiding overlapping with previous solution. For axes of both S1 and S2, all R overlapped with r is updated using the same rule, or discarded if the updated R is empty, i.e., |R| = 0. The updated rectangle sets, along with their bounds, are then pushed back to Q before the next search.
This pruning strategy is simple yet very effective. Previously derived bounds remain valid because each updated set is a subset of R. In practice, it dramatically reduces |Q| for searching the next commonality. For example, in synchrony discovery of Fig. 4, |Q| is reduced 19% for the second search, and 25% for the third SD. Note that this pruning strategy differs from conventional detection tasks, e.g., [35, 77], which remove the whole spatial or temporal region for the next search. In CED, temporal segments can be many-to-many matching, i.e., S1[b1, e1] can match multiple segments in S2 and vice versa. Thus, removing any segments from either time series would cause missing matches. This strategy allows us to maintain many-to-many matching.
SD with Warm start
Due to the B&B nature, SD exhibits poor worst-case behavior, leading to a complexity as high as an exhaustive search [51]. On the other hand, B&B can quickly identify the exact solution when a local neighborhood contains a clear optimum [35]. Given this motivation, we explore a “warm start” strategy that estimates an initial solution with high quality, and then initializes SD around the solution. Estimating an initial solution costs only few percentage of total iterations, and thus can effectively prune branches in the main SD algorithm. Fig. 5(b) illustrates the idea. Specifically, we run sliding window sampled with stepsize=10, sort the visited windows according their distances, and then determine a warm start region around the windows within the top one percentile. Then SD is performed only within an expanded neighborhood around the warm start region.
SD with Parallelism
The use of parallelism to speed up B&B algorithms has emerged as a way for large problems [24]. Based on the block-diagonal structure in the SD search space, this section describes an parallelized approach to scale up SD for longer time series. In specific, we divide SD into subproblems, and perform the SD algorithm solve each in parallel. Because each subproblem is smaller than the original one, the number of required iterations can be potentially reduced. As illustrated in Fig. 5(c), the original search space is divided into overlapping regions, where each can be solved using independent jobs on a cluster. The results are obtained as the top k rectangles collected from each subproblem. Due to the diagonal nature of SD in the search space, the final result is guaranteed to be a global solution. The proposed structure enables static overload distribution, leading to an easily programmable and efficient algorithm.
6 Experiments
In this section, we evaluated the effectiveness and efficiency of the proposed B&B framework under three applications: Common event discovery (Sec. 6.1), synchrony discovery (Sec. 6.2), and variable-length segment-based event detection (Sec. 6.3). As mentioned in Sec. 4, each application relates to a particular searching scenario of the B&B framework.
6.1 Common event discovery (CED)
In the first experiment, we evaluated CED on discovering common facial events, and discovering multiple common human actions. Table 1 shows the distribution of event lengths in respective experiments. The mixture of long and short events indicates a more realistic scenario of handling events with slow and fast motions. Specifically, for RU-FACS, we computed the distribution of AU12 events among the 4,950 sequence pairs. For mocap, the distribution was computed on a total of 25 actions from 45 sequence pairs (details below).
Table 1.
Distribution of event lengths in different datasets: min and max show the shortest and longest length of a common event. 25-, 50-, and 75-th indicate degrees of percentiles.
6.1.1 Discovering common facial events
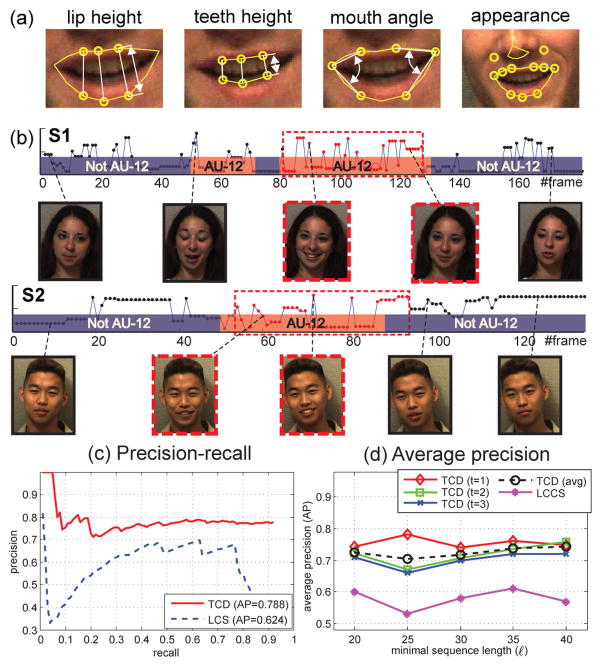
This experiment evaluates the CED algorithm to find similar facial events in the RU-FACS dataset [5]. The RU-FACS dataset consists of digitized video of 34 young adults. They were recorded during an interview of approximately 2 minutes duration in which they lied or told the truth in response to interviewer’s questions. Pose orientation was mostly frontal with moderate out-of-plane head motions. We selected the annotation of Action Unit (AU) 12 (i.e., mouth corner puller) from 15 subjects that had the most AU occurrence. We collected 100 video segments containing one AU 12 and other AUs, resulting in 4,950 pairs of video clips from different subjects. For each video, we represented features as the distances between the height of lips and teeth, angles for the mouth corners and SIFT descriptors in the points tracked with Active Appearance Models (AAM) [44] (see Fig. 7(a) for an illustration).
Fig. 7.
Results on discovering common facial actions: (a) Facial features extracted from the tracked points. (b) An example of common discovered facial events (indicated by dashed-line rectangles). (c)(d) Accuracy evaluation on precision-recall and average precision (AP).
Accuracy evaluation
Because the CED problem is relatively new in computer vision, to our knowledge there is no baseline we could directly compare to. Instead, we compared against the state-of-the-art sequence matching approach: Longest common consecutive subsequence matching (LCCS) [73]. Observe that when the per-frame feature was quantized into a temporal word, the unsupervised CED problem can be naturally interpreted as an LCCS. Following LCCS that uses a 0–1 distance, we chose ℓ1-distance for CED. Note that the segment-based BoTW representation is not helpful for LCCS [73], because LCCS computes matches only at frame-level. The minimal length ℓ was fixed as the smaller length of ground truth segments for both LCCS and CED. Given a discovered solution r and a ground truth g that indicates a correct matching, we measured their overlap score [21] as . The higher the overlap score, the better the algorithm discovered the commonality. We considered r to be a correct discovery if the overlap score is greater than 0.5.
Fig. 7(b) shows an example of a correct discovery of AU12. In this example, CED was able to correctly locate an AU 12 segment with overlap score greater than 0.8. Fig. 7(c) plots the precision-recall curves for the first discovery of CED and LCCS. We reported the average precision (AP) [21] and found CED outperformed LCCS by 0.15 points. Unlike LCCS that sought for identical subsequences, CED considered a distribution of temporal words present in two videos, and thus was able to more reliably capture common events in real-world videos. Fig. 7(d) shows the average precision of our approach under different parameters. We varied the minimal sequence length ℓ in {20, 25, …, 40}, and examined the AP of the t-th result. As can be observed from the averaged AP (black dashed line), our B&B approach performed more stably across different combinations of ℓ and t. As a result, CED performed on average 16% higher AP than LCCS in discovering the common facial actions.
Efficiency evaluation
Using the above settings, we evaluated speedup of the CED algorithm against exhaustive sliding window (SW) approach, which was implemented following parameter settings in [35, 70]. Fig. 6(a) shows these settings denoted as SWi (i = 1, 2, 3). Denote lengths of two time series as m,n and the minimal length for each sequence is ℓ, we set the maximal and minimal rectangle size for SW to be (m × n) and ( ), respectively. To be independent of implementation, we measured the discovery speed as the number of evaluation for the bounding functions, referred as nCED and nSWi for CED and SWi respectively. Fig. 6(b) shows the histograms of the log ratio for nCED/nSWi. The smaller the value, the less times CED has to evaluate the distance function. As can be seen, although SW was parameterized to search only a subset of the search space, CED searched the entire space yet still performed on average 6.18 times less evaluations than SW. To evaluate the discovery quality, we computed the distance difference measured by CED and SW, i.e., fℓ1 (rSWi) − fℓ1(rCED). The larger the difference, the lower quality of discovery SW got. Fig. 6(c) shows the histograms of such differences. One can observe that the differences are always greater than or equal to zero. This is because our method provably finds the global optimum. On the other hand, SW only performed a partial search according to its parameters, and thus was likely to reach larger distance than ours.
Fig. 6.
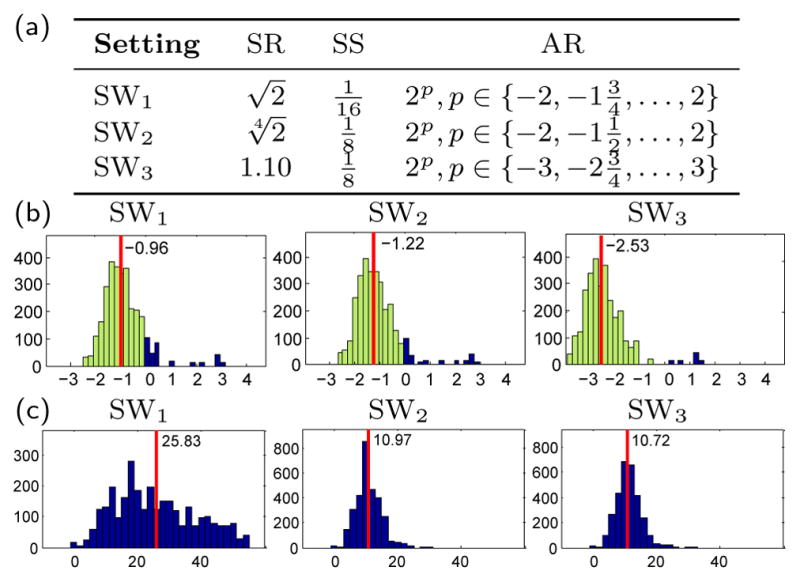
Efficiency evaluation between CED and alternative sliding window (SW) approach. (a) Parameter settings [35,70]: size-ratio (SR), stepsize (SS), and aspect ratios (AR). (b) Histogram of ratio of #evaluation: . Red vertical lines indicate the average. Light green bars show CED performs less evaluations than SW; dark blue bars represent the opposite. (c) Histogram of difference between resulting commonality measure: fℓ1 (rSWi) − fℓ1 (rCED).
6.1.2 Discover multiple common human motions
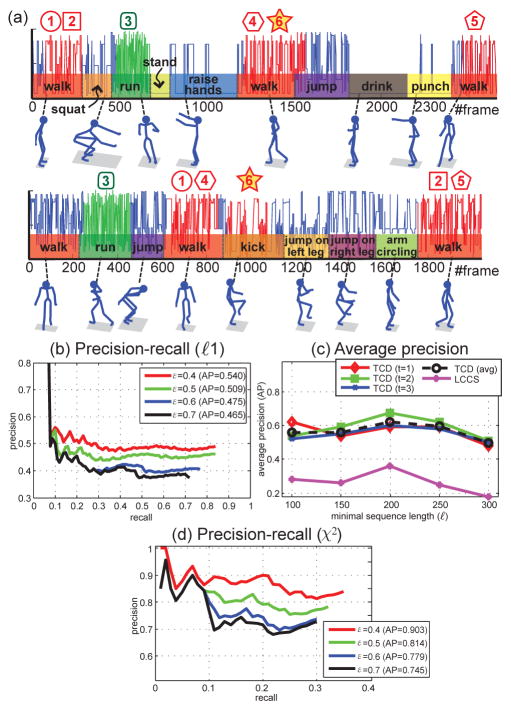
This experiment attempts to discover multiple common actions using the CMU-Mocap dataset [1]. We used Subject 86 that contains 14 long sequences with 1,200~2,600 frames and human action annotation [4]. Each sequence contains up to 10 actions (out of a total of 25) such as walk, jump, punch, etc. See Fig. 8(a) for an example. Each action ranged from 100 to 300 frames. We randomly selected 45 pairs of sequences and discovered common actions among each pair. Each action was represented by root position, orientation and relative joint angles, resulting in a 30-D feature vector. Note that this experiment is much more challenging than the previous one due to the large number of frames and more complicated actions. In this case, we excluded SW for comparison because it needs 1012 evaluations that is impractical.
Fig. 8.
(a) Top six discovered common motions. The numbers indicate discovered commonalities. Note that the shaded star (number 6) indicates an incorrect discovery that matched walk and kick. (b)(c) Precision-recall and average precision on ℓ1 distance. (d) Precision-recall on χ2 distance.
Fig. 8(a) illustrates the first six common motions discovered by CED. A failure discovery is shown in the shaded number 6, which matches walk to kick. An explanation is because these actions were visually similar, resulting in similar features of joint angles. Fig. 8(b) shows the precision-recall curve for different values of overlapping threshold ε. Using ℓ1 distance, the curve decreases about 10% AP when the overlap score ε raises from 0.4 to 0.7, which implies that we can retain higher quality results without losing too much precision. Fig. 8(c) shows the average precision over various ℓ on the t-th discovered result. LCCS performed poorly to obtain long common subsequences because human motions have more variability than just one facial event (e.g., AU-12). On the contrary, CED used BoTW representation, and thus allowed more descriptive power for activity recognition. Fig. 8(d) shows the precision-recall curve evaluated with χ2 distance. Although the Mocap dataset is very challenging in terms of various motions and diverse sequence lengths, the CED algorithm with χ2 performed 30% better than ℓ1 and LCCS. It suggest χ2 is a more powerful commonality measure for histograms than ℓ1. Overall, using the χ2 measurement and ε = 0.5, CED achieved 81% precision.
6.2 Synchrony discovery (SD)
This section evaluates SD for discovering synchronous behavior using three datasets of increasing diversity: Posed motion capture (Sec. 6.2.1) and unposed, spontaneous video of mothers and their infants (Sec. 6.2.2) and of young adults in a small social group (Sec. 6.2.3).
6.2.1 Human actions
We first provide an objective evaluation the SD algorithm (Sec. 6.1.2) on discovering human actions using the CMU Mocap dataset [1]. Mocap data provides high-degree reliability in measurement and serves as an ideal target for a clean-cut test of our method. To mimic a scenario for SD, we grouped the sequences into 7 pairs as the ones containing similar number of actions, and trimmed each action to up to 200 frames. SD was performed using ℓ = 120 and T = 50. Denote the video index set as 𝒜, we evaluated the discovery performance by the recurrence consistency [17]:
| (30) |
where I(X) is an indicator function returning 1 if the statement X is true and 0 otherwise, and denote the c-th class annotation corresponding to the p-th frame in Si.
Table 2 summarizes the SD results compared with the baseline sliding window (SW). Results are reported using χ2-distance and the recurrent consistency. A threshold of 0.012 was manually set to discard discovery with large distance. We ran SW with step sizes 5 and 10, and marked the windows with the minimal distance as and , respectively. Among all, SD discovers all results found by SW. To understand how well a prediction by chance can be, all windows were collected to report average μ and standard deviation σ. As can be seen, on average, a randomly selected synchrony can result in large distance over 100 and low quality below 0.3. SD maintained an exact minimal distance with good qualities as the ones found by exhaustive SW. Note that, because SD is totally unsupervised, the synchrony with minimal distance may not necessarily guarantee the highest quality.
Table 2.
Distance and quality analysis on CMU Mocap dataset: (top) χ2 distance using 1e-3 as unit, (bottom) recurrent consistency. indicates the optimal window found by SWs with step size s = 5, 10; and indicate average and standard deviation among all windows. The best discovery are marked in bold.
| Pair | (1,11) | (2,4) | (3,13) | (5,7) | (6,8) | (9,10) | (12,14) | Avg. | |
|---|---|---|---|---|---|---|---|---|---|
| χ2-distance | SD | 6.3 | 1.2 | 4.7 | 2.6 | 0.1 | 0.2 | 11.9 | 3.9 |
|
|
6.5 | 1.3 | 6.7 | 5.4 | 0.1 | 0.4 | 12.0 | 4.6 | |
|
|
6.7 | 2.7 | 6.7 | 10.1 | 0.2 | 0.7 | 14.3 | 5.9 | |
|
|
97.1 | 76.9 | 81.4 | 64.2 | 89.3 | 172.0 | 334.5 | 130.8 | |
|
|
33.8 | 74.4 | 53.8 | 28.2 | 79.2 | 117.7 | 345.1 | 104.6 | |
|
|
94.8 | 77.3 | 81.8 | 63.2 | 87.1 | 170.2 | 327.2 | 128.8 | |
|
|
34.3 | 74.1 | 54.2 | 28.3 | 79.4 | 117.8 | 341.5 | 104.2 | |
|
| |||||||||
| Rec. consistency | SD | 0.89 | 0.85 | 0.46 | 0.90 | 1.00 | 0.64 | 0.76 | 0.79 |
|
|
0.95 | 0.81 | 0.50 | 0.84 | 1.00 | 0.69 | 0.73 | 0.79 | |
|
|
0.95 | 0.75 | 0.50 | 0.64 | 1.00 | 0.55 | 0.00 | 0.63 | |
|
|
0.07 | 0.32 | 0.09 | 0.07 | 0.08 | 0.13 | 0.12 | 0.12 | |
|
|
0.16 | 0.33 | 0.25 | 0.20 | 0.21 | 0.29 | 0.22 | 0.24 | |
|
|
0.08 | 0.31 | 0.09 | 0.07 | 0.09 | 0.13 | 0.12 | 0.13 | |
|
|
0.19 | 0.33 | 0.26 | 0.21 | 0.22 | 0.29 | 0.23 | 0.25 | |
Fig. 9 shows the speed up of SD against exhaustive SW. SD and its extensions demonstrated an improved efficiency over SW. In some cases, SDΔ improved search speed by a large margin, e.g., in (01,11) with χ2-distance reached a speed boost over 200 times. Across all metrics, the speed up of SDΔ was less obvious with symmetrized KL divergence. SD# was implemented on a 4-core machine; an extension to larger clusters is possible yet beyond the scope of this study. On average, SD# consistently accelerated the original SD due to parallelism.
Fig. 9.
Speedup of SD against sliding window (SW) on CMU-Mocap. All 7 pairs of sequences from subject 86 were evaluated. The speedup was computed as the relative number of evaluations NSW/NSD using ℓ1, χ2 and symmetrized KL divergence.
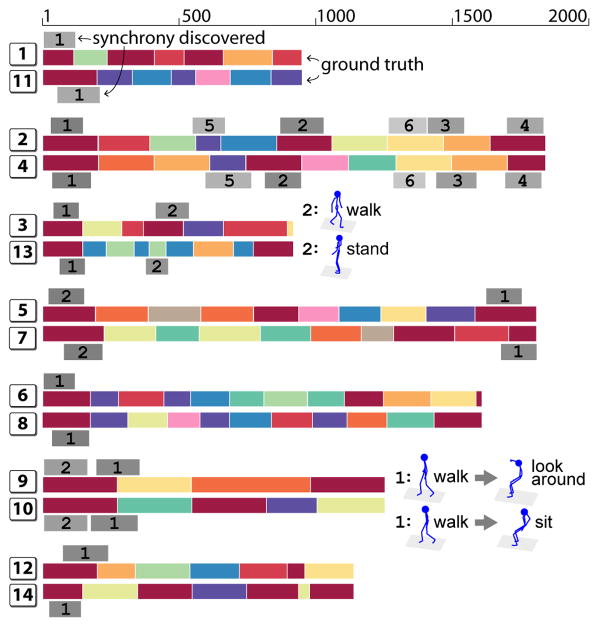
Fig. 10 shows the qualitative results on all 7 pairs, annotated with ground truth and the discovered synchronies. As can be seen, SD allows to discover multiple synchronies with varying lengths. Although some discovered synchronies contain disagreed action labels, one can observe that the discoveries share reasonable visual similarity, e.g., in pair (9,10), the “look around” action in sequence 9 was performed when the subject was seated, sharing the similarity with the “sit” action in sequence 10.
Fig. 10.
Discovered synchronies on 7 pairs of Subject 86 in CMU-Mocap dataset. Each pair is annotated with ground truth (colorful bars, each represents an action), and synchronies discovered by our method (shaded numbers). Synchronies with disagreed action labels are visualized.
6.2.2 Parent-infant interaction
Parent-infant interaction is critical for early social development. This section attempts to characterize their affective engagement by exploring the moments where the behavior of both the parent and the infant are correlated. We performed this experiment on the mother-infant interaction dataset [46]. Participants were 6 ethnically diverse 6-month-old infants and their parents (5 mothers, 1 father). Infants were positioned in an infant-seat facing their parent who was seated in front of them. We used 3 minutes of normal interaction where the parent plays with the infant as they might do at home. Because this dataset was not fully annotated, we only evaluated the results quantitatively. After the faces were tracked, we used only the shape features because the appearance of adults and infants are different. Throughout this experiment, we set ℓ = 80 and T = 40.
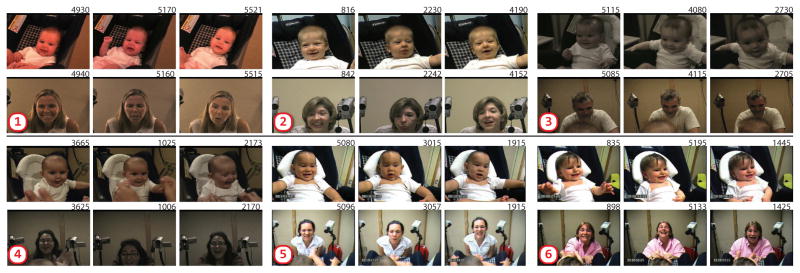
Fig. 11 illustrates three discovered synchronies among all parent-infant pairs. As can be seen, many synchronies were discovered as the moments when both infants and parents exhibit strong smiles, serving as a building block of early interaction [46]. Besides smiles, a few synchronies showed strong engagement in their mutual attention, such as the second synchrony of group ➀ where the infant cried after the mother showed a sad face, and the second synchrony of the second group where the mother stuck her tongue out after the infant did so. These interactive patterns offered solid evidence of a positive association between infants and their parents.
Fig. 11.
Discovered sychronies from 6 groups of parent-infant interaction. Each column indicates a discovery and its #frame.
6.2.3 Social group interaction
This experiment investigates discovery of synchronies in social group interaction. We used the GFT dataset [60] that consists of 720 participants recorded during group-formation tasks. Previously unacquainted participants sat together in groups of 3 at a round table for 30 minutes while getting to know each other. We used 2 minutes of videos from 48 participants, containing 6 groups of two subjects and 12 groups of three subjects. SD was performed to discover dyads among groups of two, and triads among groups of three. Each video was tracked with 49 facial landmarks using IntraFace [16]. We represented each face by concatenating appearance features (SIFT) and shape features (49 landmarks). In this dataset, we used annotations of AUs (10,12,14,15,17,23,24) that appear most frequently.
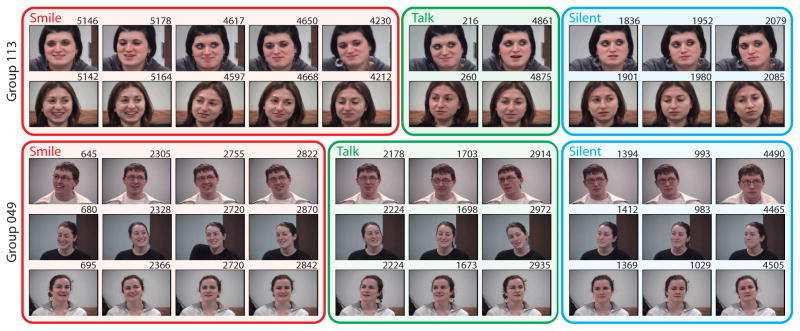
Fig. 12 shows qualitative results of the discovered dyadic and triadic synchronies among two social groups. Each column indicates a discovery among each group. As can be observed, most common events are discovered as concurrent smiles, talk, or silent moments where all participants remained neutral. Because the interaction was recorded during a drinking section, the SD algorithm discovers more frequent concurring smiles than other behavior. This discovery is particular interesting for complying with the findings in [60] that alcohol facilitates bonding during group formation. It is noticeable that the SD algorithm requires no human supervision, yet can identify meaningful patterns (e.g., smiles) occult to supervised approaches.
Fig. 12.
Top 10 discovered synchronies from groups 113 and 128 in the GFT dataset. Each column indicates a discovered synchrony and its frame number. The SD algorithm correctly matched the states of smiling, talking and silent.
Quantitatively, we examined SD with varying ℓ, i.e., ℓ ∈ {30, 60, 120}, resulting in synchronies that last at least 1, 2 and 4 seconds; we set the synchrony offset T = 30 (1 second). Baseline SW was performed using step sizes 5 and 10. Symmetrized KL divergence was used as the distance function. We evaluated the distance and quality among the optimal window discovered, as well as the average and standard deviation among all windows to tell a discovery by chance. Fig. 13 shows the averaged KL divergence and recurrent consistency (Eq. (30)) among top 10 discovered dyadic and triadic synchronies. As can be seen, SD always guarantees the lowest divergence because of its nature to find the exact optimum. The recurrence quality decreases while ℓ grows, showing that finding a synchrony with longer period while maintaining good quality is harder than finding one with shorter period. Note that, although the discover quality is not guaranteed in an unsupervised discovery, SD consistently maintained the best discovery quality across various lengths. This result illustrates the power of our unsupervised method that agrees with that of supervised labels.
Fig. 13.
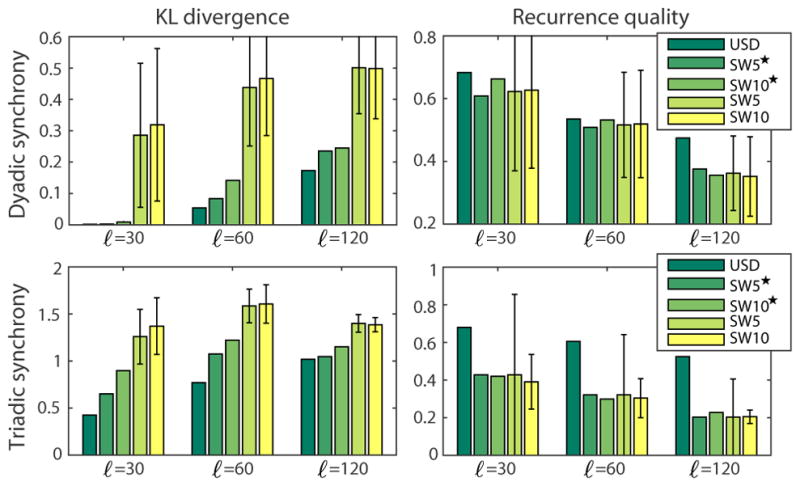
Analysis on top 10 discovered dyadic and triadic synchronies of the GFT dataset. SW denoted with ★ indicates the optimal windows discovered, and without ★ indicates the average and standard deviation over all visited windows.
6.3 Segment-based Event detection (ED)
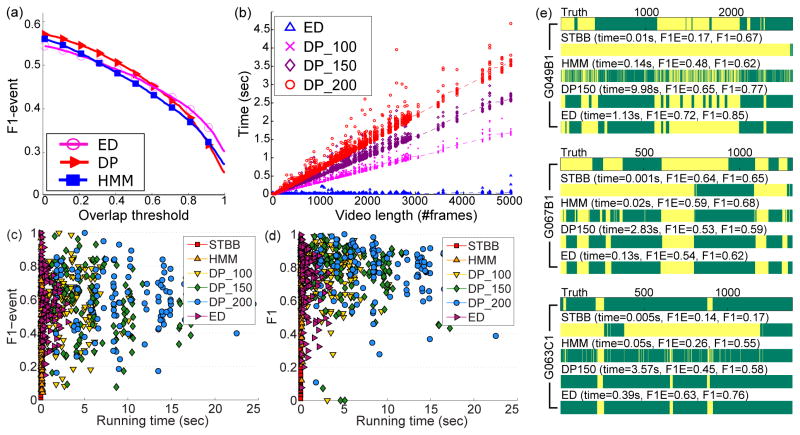
This experiment evaluates performance and computation time of segment-based event detection on the GFT dataset [60], as used in Sec. 6.2.3. The task is to localize AU events using a pre-trained segment-based linear SVM classifier. The AUs of interest are 1, 2, 6, 7, 10, 11, 12, 14, 15, 17, 23, and 24. Unlike previous studies that require temporal segmentation [36, 58, 64], we focused on joint detection and segmentation of a temporal event. Specifically, we compared ED with a hybrid SVM-HMM [34] (denoted HMM hereafter for simplicity) and the state-of-the-art event detection algorithms, including a dynamic programming (DP) approach [29] and the Kadane’s algorithm used in STBB [77]. We trained a frame-based SVM for each AU, and used the same SVM for the detection task on different methods. For SVM-HMM, the HMM has two states, i.e., activation or inactivation of an AU. The state transition probabilities and the a-priori probability were estimated by the frequency of an AU activation in the training data. The emission probabilities of HMM was computed based on normalized SVM output using Platt’s scaling [55]. During test, the most likely AU state path for each video was determined by a standard Viterbi algorithm, which has a complexity 𝒪(|s|2 × N), where |s| = 2 is the number of states and N is the number of frames of a test video. For both ED and DP, we set the minimal discovery length ℓ = 30. For DP, we set the maximal segment lengths in {100, 150, 200}, denoted as DP 100, DP 150, and DP 200, respectively. For evaluation, we used the standard F1 score and the F1-event metric [18] defined as , where EP and ER stand for event-based precision and event-based recall. Unlike a standard F1 score, F1-event focuses on capturing the temporal consistency of prediction. An event-level agreement holds if the overlap of two temporal segments is above a certain threshold.
Fig. 14(a) shows the F1-event curve w.r.t. event overlapping thresholds. Overall DP and ED performed better than the baseline HMM. The performance of DP dropped when threshold was greater than 0.6, which implies DP missed highly overlapped events during detection. This is because DP performed exhaustive search, and thus requested a maximal search length for computational feasibility. On the other hand, ED by construction excludes such limitation. Fig. 14(b) shows the running time on a 2.8GHz dual core CPU machine by comparing ED v.s. DP. Note that we omitted STBB and HMM in Fig. 14(b) because the time difference between ED and STBB/HMM is insignificant under this scale. Each detected AU event is plotted in terms of the running time and sampled video length (#frame). As can be seen, the computation time for DP increased linearly with video length, while ED maintained invariance of video length. These results suggest that ED was able to perform comparably with significantly improved efficiency for event detection.
Fig. 14.
Comparison between ED and alternative approaches in terms of: (a) F1-event over 12 AUs, (b) running time v.s. video length, (c) F1-event v.s. time, (d) F1 v.s. time, and (e) comparison between ground truth and detection results on 3 subjects.
Figs. 14(c) and (d) show the trend of running time v.s. F1-event and F1 score across ED and all alternative methods. Each marker indicates a detection result for a sequence. For visualization purpose, we randomly picked 120 sequences to include in this figure. The quantitative evaluation on the entire dataset is shown in Table 3. As can be seen in Figs. 14(c) and (d), STBB and HMM performed significantly faster than others due to their linear nature in computation. In general, for F1-event and F1, STBB led to suboptimal performance because events with activation are usually found in over-length segments. Fig. 14(e) illustrates detection results of three subjects. In all cases, it reveals the over-length detection of STBB due to its consideration of max sub-vectors. As can be seen, STBB tends to include a large temporal window so that the sum of decision values is maximized. HMM took SVM outputs as emission probability, and thus performs similarly as a frame-based SVM. HMM tends to generate lower F1-event, as also suggested in Figs. 14(a). This is because of the memoryless property considered in the Markov chain, i.e., the future state only depends upon the present state. On the contrary, ED and DP produced more visually smooth results due to their segment-based detection. Similar to Fig. 14(b), we observed that, with comparable performance, ED is consistently faster over DP with different parameters.
Table 3.
Comparison between ED and alternative methods in terms of running time, F1-event (F1E), and F1 on the supervised AU detection task.
| Method | Time (sec) | F1E | F1 |
|---|---|---|---|
| STBB | 0.003±0.002 | 0.297±0.256 | 0.420±0.270 |
| HMM | 0.090±0.049 | 0.405±0.209 | 0.698±0.182 |
| DP100 | 3.987±2.184 | 0.586±0.188 | 0.756±0.179 |
| DP150 | 6.907±3.720 | 0.586±0.188 | 0.756±0.179 |
| DP200 | 9.332±5.268 | 0.586±0.188 | 0.756±0.179 |
| ED (ours) | 0.668±0.873 | 0.572±0.197 | 0.753±0.165 |
Table 3 summarizes the comparison between ED and alternative methods in terms of running time, F1-Event and F1 scores averaged over sequences in the entire dataset. As what we have observed in Fig. 14, STBB had the smallest running time yet with the worst performance. Among the top performing DP and ED, without losing much accuracy, ED improved the speed against DP from about 6x to 14x.
7 Conclusion and Future Work
Using Branch-and-Bound (B&B), we introduced an unsupervised approach to common event discovery in segments of variable length. We derived novel bounding functions with which the B&B framework guarantees a globally optimal solution in an empirically efficient manner. With slight modifications the B&B framework can be readily applied to common event discovery, synchrony discovery, video search, and supervised event detection. The searching procedure can be extended to discovery among multiple time series, discovery of multiple commonalities, and can be accelerated with warm start and parallelism. We evaluated the effectiveness of the B&B framework in motion capture of deliberate whole-body behavior and in video of spontaneous facial behavior in interviews, small groups of young adults, and parent-infant face-to-face interaction.
Future work includes promoting the scalability of the proposed algorithm. Given current pairwise design, the computational complexity grows quadratically with the number of input sequences. One direction is to pursue parallelism, i.e., compute pairwise bounds independently using clusters or multi-threading, and then aggregate these bounds into a overall score.
Algorithm 3.
Video Search (VS)
|
Algorithm 4.
Seg.-based Event Detection (ED)
|
Acknowledgments
This work was supported in part by US National Institutes of Health grants GM105004 and MH096951. Any opinions, findings, and conclusions or recommendations expressed in this material are those of the authors and do not necessarily reect the views of the National Institutes of Health. The authors would like to thank Jaibei Zeng and Feng Zhou for helping partial experiments.
Footnotes
Bold capital letters denote a matrix X, bold lower-case letters a column vector x. xi represents the ith column of the matrix X. xij denotes the scalar in the ith row and jth column of the matrix X. All non-bold letters represent scalars.
References
- 1.http://mocap.cs.cmu.edu/
- 2.Amberg B, Vetter T. Optimal landmark detection using shape models and branch and bound. ICCV. 2011 [Google Scholar]
- 3.Balakrishnan V, Boyd S, Balemi S. Branch and bound algorithm for computing the minimum stability degree of parameter-dependent linear systems. International Journal of Robust and Nonlinear Control. 1991;1(4):295–317. [Google Scholar]
- 4.Barbič J, Safonova A, Pan JY, Faloutsos C, Hodgins JK, Pollard NS. Segmenting motion capture data into distinct behaviors. Proceedings of Graphics Interface; 2004; Canadian Human-Computer Communications Society; 2004. pp. 185–194. [Google Scholar]
- 5.Bartlett MS, Littlewort GC, Frank MG, Lainscsek C, Fasel IR, Movellan JR. Automatic recognition of facial actions in spontaneous expressions. Journal of Multimedia. 2006;1(6):22–35. [Google Scholar]
- 6.Begum N, Keogh E. Rare time series motif discovery from unbounded streams. 2015 [Google Scholar]
- 7.Boiman O, Irani M. Detecting irregularities in images and in video. ICCV. 2005 [Google Scholar]
- 8.Brand M, Oliver N, Pentland A. Coupled HMMs for complex action recognition. CVPR. 1997 [Google Scholar]
- 9.Brendel W, Todorovic S. Learning spatiotemporal graphs of human activities. ICCV. 2011 [Google Scholar]
- 10.Chaaraoui AA, Climent-Pérez P, Flórez-Revuelta F. A review on vision techniques applied to human behaviour analysis for ambient-assisted living. Expert Systems with Applications. 2012;39(12):10,873–10,888. [Google Scholar]
- 11.Chu WS, Chen CP, Chen CS. Momicosegmentation: Simultaneous segmentation of multiple objects among multiple images. ACCV. 2010 [Google Scholar]
- 12.Chu WS, De la Torre F, Cohn JF. Selective transfer machine for personalized facial expression analysis. TPAMI. 2016 doi: 10.1109/TPAMI.2016.2547397. [DOI] [PMC free article] [PubMed] [Google Scholar]
- 13.Chu WS, Zeng J, De la Torre F, Cohn JF, Messinger DS. Unsupervised synchrony discovery in human interaction. ICCV. 2015 doi: 10.1109/ICCV.2015.360. [DOI] [PMC free article] [PubMed] [Google Scholar]
- 14.Chu WS, Zhou F, De la Torre F. Unsupervised temporal commonality discovery. ECCV. 2012 [Google Scholar]
- 15.Cooper H, Bowden R. Learning signs from subtitles: A weakly supervised approach to sign language recognition. CVPR. 2009 [Google Scholar]
- 16.De la Torre F, Chu WS, Xiong X, Ding X, Cohn JF. Intraface. Automatic Face and Gesture Recognition. 2015 doi: 10.1109/FG.2015.7163082. [DOI] [PMC free article] [PubMed] [Google Scholar]
- 17.Delaherche E, Chetouani M, Mahdhaoui A, Saint-Georges C, Viaux S, Cohen D. Interpersonal synchrony: A survey of evaluation methods across disciplines. IEEE Trans on Affective Computing. 2012;3(3):349–365. [Google Scholar]
- 18.Ding X, Chu WS, De la Torre F, Cohn JF, Wang Q. Facial action unit event detection by cascade of tasks. ICCV. 2012;2013 doi: 10.1109/ICCV.2013.298. [DOI] [PMC free article] [PubMed] [Google Scholar]
- 19.Du S, Tao Y, Martinez AM. Compound facial expressions of emotion. Proceedings of the National Academy of Sciences. 2014;111(15):E1454–E1462. doi: 10.1073/pnas.1322355111. [DOI] [PMC free article] [PubMed] [Google Scholar]
- 20.Duchenne O, Laptev I, Sivic J, Bach F, Ponce J. Automatic annotation of human actions in video. ICCV. 2009 [Google Scholar]
- 21.Everingham M, Zisserman A, Williams CI, Van Gool L. The PASCAL visual object classes challenge 2006 results. 2th PASCAL Challenge. 2006 [Google Scholar]
- 22.Feris R, Bobbitt R, Brown L, Pankanti S. Attributebased people search: Lessons learnt from a practical surveillance system. ICMR. 2014 [Google Scholar]
- 23.Gao L, Song J, Nie F, Yan Y, Sebe N, Tao Shen H. Optimal graph learning with partial tags and multiple features for image and video annotation. CVPR. 2015 doi: 10.1109/TIP.2016.2601260. [DOI] [PubMed] [Google Scholar]
- 24.Gendron B, Crainic TG. Parallel branch-and-branch algorithms: Survey and synthesis. Operations research. 1994;42(6):1042–1066. [Google Scholar]
- 25.Girard JM, Cohn JF, Jeni LA, Lucey S, De la Torre F. How much training data for facial action unit detection? AFGR. 2015 doi: 10.1109/FG.2015.7163106. [DOI] [PMC free article] [PubMed] [Google Scholar]
- 26.Goldberger J, Gordon S, Greenspan H. An efficient image similarity measure based on approximations of kl-divergence between two gaussian mixtures. ICCV. 2003 [Google Scholar]
- 27.Gusfield D. Algorithms on strings, trees, and sequences: computer science and computational biology. Cambridge Univ Press; 1997. [Google Scholar]
- 28.Han D, Bo L, Sminchisescu C. Selection and Context for Action Recognition. ICCV. 2009 [Google Scholar]
- 29.Hoai M, zhong Lan Z, De la Torre F. Joint segmentation and classification of human actions in video. CVPR. 2011 [Google Scholar]
- 30.Hongeng S, Nevatia R. Multi-agent event recognition. ICCV. 2001 [Google Scholar]
- 31.Hu W, Xie N, Li L, Zeng X, Maybank S. A survey on visual content-based video indexing and retrieval. IEEE Transactions on Systems, Man, and Cybernetics, Part C. 2011;41(6):797–819. [Google Scholar]
- 32.Jhuang H, Serre T, Wolf L, Poggio T. A biologically inspired system for action recognition. ICCV. 2007 [Google Scholar]
- 33.Keogh E, Ratanamahatana CA. Exact indexing of dynamic time warping. Knowledge and information systems. 2005;7(3):358–386. [Google Scholar]
- 34.Krüger SE, Schafföner M, Katz M, Andelic E, Wendemuth A. Speech recognition with support vector machines in a hybrid system. Interspeech. 2005 [Google Scholar]
- 35.Lampert C, Blaschko M, Hofmann T. Efficient subwindow search: A branch and bound framework for object localization. PAMI. 2009;31(12):2129–2142. doi: 10.1109/TPAMI.2009.144. [DOI] [PubMed] [Google Scholar]
- 36.Laptev I, Marszalek M, Schmid C, Rozenfeld B. Learning realistic human actions from movies. CVPR. 2008 [Google Scholar]
- 37.Lehmann A, Leibe B, Van Gool L. Fast prism: Branch and bound hough transform for object class detection. IJCV. 2011;94(2):175–197. [Google Scholar]
- 38.Littlewort G, Bartlett MS, Fasel I, Susskind J, Movellan J. Dynamics of facial expression extracted automatically from video. Image and Vision Computing. 2006;24(6):615–625. [Google Scholar]
- 39.Liu CD, Chung YN, Chung PC. An interaction-embedded hmm framework for human behavior understanding: with nursing environments as examples. IEEE Trans on Information Technology in Biomedicine. 2010;14(5):1236–1246. doi: 10.1109/TITB.2010.2052061. [DOI] [PubMed] [Google Scholar]
- 40.Liu H, Yan S. Common visual pattern discovery via spatially coherent correspondences. CVPR. 2010 [Google Scholar]
- 41.Liu J, Shah M, Kuipers B, Savarese S. Cross-view action recognition via view knowledge transfer. CVPR. 2011 [Google Scholar]
- 42.Lucey P, Cohn JF, Kanade T, Saragih J, Ambadar Z, Matthews I. The extended cohn-kanade dataset (CK+): A complete dataset for action unit and emotion-specified expression. CVPRW. 2010 [Google Scholar]
- 43.Maier D. The complexity of some problems on subsequences and supersequences. Journal of the ACM. 1978;25(2):322–336. [Google Scholar]
- 44.Matthews I, Baker S. Active appearance models revisited. IJCV. 2004;60(2):135–164. [Google Scholar]
- 45.Messinger DM, Ruvolo P, Ekas NV, Fogel A. Applying machine learning to infant interaction: The development is in the details. Neural Networks. 2010;23(8):1004–1016. doi: 10.1016/j.neunet.2010.08.008. [DOI] [PMC free article] [PubMed] [Google Scholar]
- 46.Messinger DS, Mahoor MH, Chow SM, Cohn JF. Automated measurement of facial expression in infant–mother interaction: A pilot study. Infancy. 2009;14(3):285–305. doi: 10.1080/15250000902839963. [DOI] [PMC free article] [PubMed] [Google Scholar]
- 47.Minnen D, Isbell C, Essa I, Starner T. Discovering multivariate motifs using subsequence density estimation. AAAI. 2007 [Google Scholar]
- 48.Mueen A, Keogh E. Online discovery and maintenance of time series motifs. KDD. 2010 [Google Scholar]
- 49.Mukherjee L, Singh V, Peng J. Scale invariant cosegmentation for image groups. CVPR. 2011 doi: 10.1109/CVPR.2011.5995420. [DOI] [PMC free article] [PubMed] [Google Scholar]
- 50.Murphy KP. Machine learning: a probabilistic perspective. MIT press; 2012. [Google Scholar]
- 51.Narendra PM, Fukunaga K. A branch and bound algorithm for feature subset selection. IEEE Trans on Computers. 1977;100(9):917–922. [Google Scholar]
- 52.Nayak S, Duncan K, Sarkar S, Loeding B. Finding recurrent patterns from continuous sign language sentences for automated extraction of signs. Journal of Machine Learning Research. 2012;13(1):2589–2615. [Google Scholar]
- 53.Oliver NM, Rosario B, Pentland AP. A bayesian computer vision system for modeling human interactions. IEEE Trans on Pattern Analysis and Machine Intelligence. 2000;22(8):831–843. [Google Scholar]
- 54.Paterson M, Dančík V. Longest common subsequences. Mathematical Foundations of Computer Science 1994. 1994;841:127–142. [Google Scholar]
- 55.Platt J, et al. Probabilistic outputs for support vector machines and comparisons to regularized likelihood methods. Advances in large margin classifiers. 1999;10(3):61–74. [Google Scholar]
- 56.Reddy KK, Shah M. Recognizing 50 human action categories of web videos. Machine Vision and Applications. 2013;24(5):971–981. [Google Scholar]
- 57.Rubner Y, Tomasi C, Guibas LJ. The earth mover’s distance as a metric for image retrieval. IJCV. 2000;40(2):99–121. [Google Scholar]
- 58.Sadanand S, Corso JJ. Action bank: A high-level representation of activity in video. CVPR. 2012 [Google Scholar]
- 59.Sangineto E, Zen G, Ricci E, Sebe N. We are not all equal: Personalizing models for facial expression analysis with transductive parameter transfer. 2014 [Google Scholar]
- 60.Sayette MA, Creswell KG, Dimoff JD, Fairbairn CE, Cohn JF, Heckman BW, Kirchner TR, Levine JM, Moreland RL. Alcohol and group formation a multimodal investigation of the effects of alcohol on emotion and social bonding. Psychological science. 2012 doi: 10.1177/0956797611435134. [DOI] [PMC free article] [PubMed] [Google Scholar]
- 61.Schindler G, Krishnamurthy P, Lublinerman R, Liu Y, Dellaert F. Detecting and matching repeated patterns for automatic geo-tagging in urban environments. CVPR. 2008 [Google Scholar]
- 62.Schmidt RC, Morr S, Fitzpatrick P, Richardson MJ. Measuring the dynamics of interactional synchrony. Journal of Nonverbal Behavior. 2012;36(4):263–279. [Google Scholar]
- 63.Scholkopf B. The kernel trick for distances. NIPS. 2001 [Google Scholar]
- 64.Schuller B, Rigoll G. Timing levels in segment-based speech emotion recognition. Interspeech. 2006 [Google Scholar]
- 65.Si Z, Pei M, Yao B, Zhu S. Unsupervised learning of event and-or grammar and semantics from video. ICCV. 2011 [Google Scholar]
- 66.Sivic J, Zisserman A. Video Google: A text retrieval approach to object matching in videos. ICCV. 2003 [Google Scholar]
- 67.Sun M, Telaprolu M, Lee H, Savarese S. An efficient branch-and-bound algorithm for optimal human pose estimation. CVPR. 2012 [Google Scholar]
- 68.Turaga P, Veeraraghavan A, Chellappa R. Unsupervised view and rate invariant clustering of video sequences. CVIU. 2009;113(3):353–371. [Google Scholar]
- 69.Valstar M, Pantic M. Fully automatic facial action unit detection and temporal analysis. CVPRW. 2006 [Google Scholar]
- 70.Viola P, Jones MJ. Robust real-time face detection. IJCV. 2004;57(2):137–154. [Google Scholar]
- 71.Wang H, Zhao G, Yuan J. Visual pattern discovery in image and video data: a brief survey. Wiley Interdisciplinary Reviews: Data Mining and Knowledge Discovery. 2014;4(1):24–37. [Google Scholar]
- 72.Wang Y, Jiang H, Drew MS, Li Z, Mori G. Unsupervised discovery of action classes. CVPR. 2006 [Google Scholar]
- 73.Wang Y, Velipasalar S. Frame-level temporal calibration of unsynchronized cameras by using Longest Consecutive Common Subsequence. ICASSP. 2009 [Google Scholar]
- 74.Yang Y, Saleemi I, Shah M. Discovering motion primitives for unsupervised grouping and one-shot learning of human actions, gestures, and expressions. TPAMI. 2013;35(7):1635–1648. doi: 10.1109/TPAMI.2012.253. [DOI] [PubMed] [Google Scholar]
- 75.Yang Y, Song J, Huang Z, Ma Z, Sebe N, Hauptmann AG. Multi-feature fusion via hierarchical regression for multimedia analysis. 2013:572–581. [Google Scholar]
- 76.Yu X, Zhang S, Yu Y, Dunbar N, Jensen M, Burgoon JK, Metaxas DN. Automated analysis of interactional synchrony using robust facial tracking and expression recognition. Automatic Face and Gesture Recognition. 2013 [Google Scholar]
- 77.Yuan J, Liu Z, Wu Y. Discriminative video pattern search for efficient action detection. PAMI. 2011;33(9):1728–1743. doi: 10.1109/TPAMI.2011.38. [DOI] [PubMed] [Google Scholar]
- 78.Zheng Y, Gu S, Tomasi C. Detecting motion synchrony by video tubes. ACMMM. 2011 [Google Scholar]
- 79.Zhou F, De la Torre F, Hodgins JK. Hierarchical aligned cluster analysis for temporal clustering of human motion. IEEE Trans on Pattern Analysis and Machine Intelligence. 2013;35(3):582–596. doi: 10.1109/TPAMI.2012.137. [DOI] [PubMed] [Google Scholar]
- 80.Zhou F, De la Torre F, Cohn JF. Unsupervised discovery of facial events. CVPR. 2010 [Google Scholar]
- 81.Zhu S, Mumford D. A stochastic grammar of images. Foundations and Trends in Computer Graphics and Vision. 2006;2(4):259–362. [Google Scholar]


