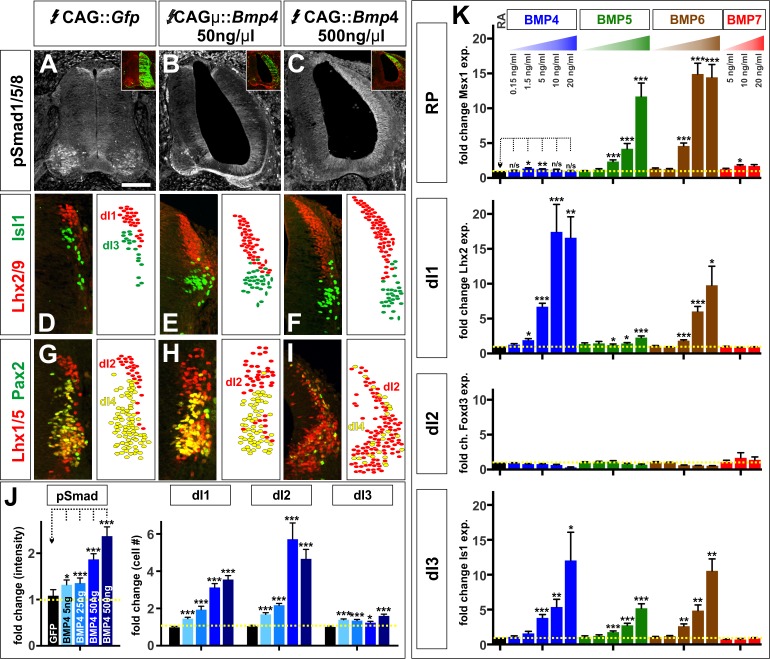
Figure 4. The BMPs do not act as morphogens either in vivo or in vitro.
(A–I) Chicken spinal cords were electroporated at HH stage 15 with Gfp (A, D, G), [low] Bmp4 (B, E, H) or [high] Bmp4 (C, F, I) under the control of the CAG enhancer, and incubated until HH stage 25. Thoracic transverse sections were labeled with antibodies against pSmad1/5/8 (red, A–C), Lhx2/9 (red, D–F), Isl (green, D–F), Lhx1/5 (red, G–I) and Pax2 (green, G–I). (A–C, J) R-Smad activation increases over a range of ~20% to~130% as the level of Bmp4 misexpression increases. 5 ng/μl CAG::Bmp4, n = 27 sections from 3 embryos, p<0.008 similar to control; 25 ng/ul CAG::Bmp4, n = 14 sections from 2 embryos, p<4.4×10⁻⁵; 50 ng/ul CAG::Bmp4, n = 23 sections from 3 embryos, p<2.4×10⁻⁸; 500 ng/ul CAG::Bmp4, n = 19 sections from 3 embryos, p<3.6×10⁻⁷; Gfp control: n = 27 sections from 3 embryos, p>0.47. (D–I, J) The concentration of BMP4 determines the efficiency of dI1-3 specification in chicken embryos. Thus, high levels of Bmp4 expression direct more Lhx2/9+ dI1s (F, n = 28 sections from 3 embryos, p<1.8×10⁻¹⁶), Lhx1/5+ dI2s (I, n = 22 sections from 3 embryos, p<7.6×10⁻¹¹) and Isl1+ dI3s (F, n = 28 sections from 3 embryos, p<6.3×10⁻⁷) compared to lower concentrations of Bmp4 expression (E, Lhx2/9: n = 29 sections from 3 embryos, p<7.6×10⁻¹⁴; Isl1: n = 29 sections from 3 embryos, p<0.006; H, Lhx1/5: n = 26 sections from 3 embryos, p<5.1×10⁻⁷). Expression of Gfp had no effect (Lhx2/9: D, n = 28 sections from 3 embryos, p>0.88; Isl1: D, n = 29 sections from 3 embryos, p>0.89; Lhx1/5: G, n = 29 sections from 3 embryos, p>0.28). (K) Similarly, increasing the concentration of a given BMP improves its ability to direct mESCs towards a specific dorsal fate, as measured by increased gene expression. BMP4: n = 4 independent experiments; BMP5: n = 3 experiments; BMP6: n = 2 experiments; BMP7: n = 2 experiments. Samples were run in triplicate within each experiment. Probability of similarity between control and experimental groups, *p<0.05, **p<0.005, ***p<0.0005, Student’s t-test or Mann Whitney test. Scale bar: 80 µm.


