. 2017 Jul 7;6:e23539. doi: 10.7554/eLife.23539

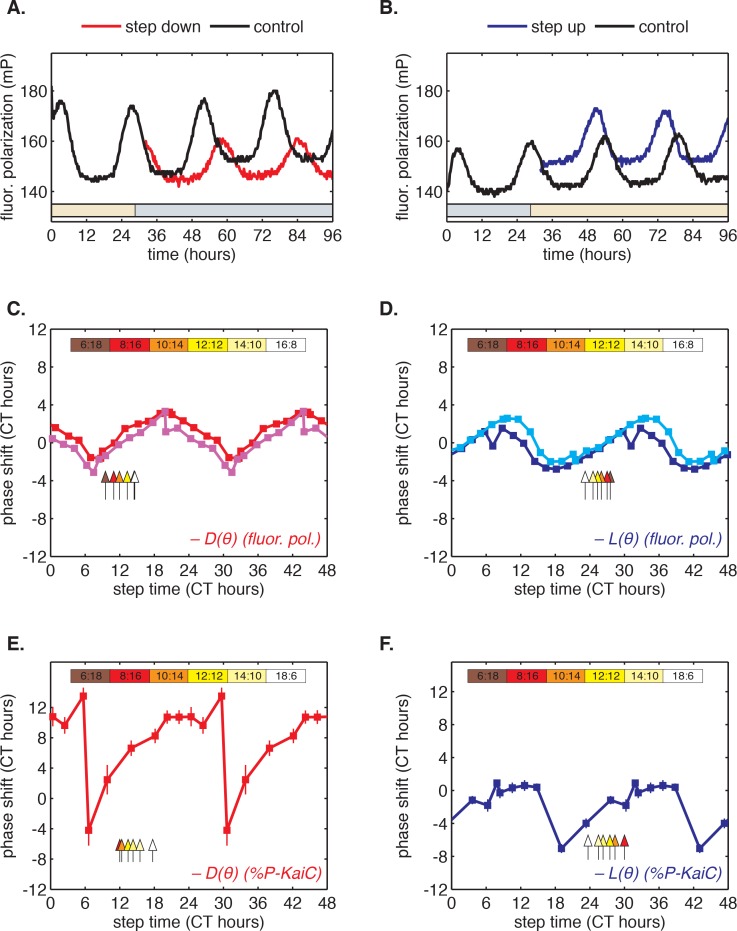
Figure 3. Clock responses to metabolic steps mimicking dawn (step up) and dusk (step down).

(A) Phase shift in fluorescence polarization (red curve) caused by a shift to a buffer that mimics the nucleotide pool at night ([ATP]/([ATP]+[ADP]) ≈ 25%, gray bar). The control reaction remained in the original buffer (black curve). (B) Phase shift in fluorescence polarization (blue curve) caused by a shift from night buffer back to day buffer ([ATP]/([ATP]+[ADP]) ≈ 100%, beige bar). (C, D) Summary of phase shifts caused by metabolic step-down (C) or step-up (D) perturbations throughout the clock cycle. Simulated day-night or night-day steps were administered as in (A) and (B). Different colors represent independent measurements. To estimate the phase of each reaction, trajectories were fit to sinusoids. Phase shifts were determined relative to the respective control reactions. The times at which buffer steps were administered were converted to circadian time (CT 0 corresponds to the estimated trough of KaiC phosphorylation based on Figure 2—figure supplement 1). Colored arrows indicate clock phases when metabolic shifts occur in entrained conditions. (E, F) Analogs of (C, D) for the gel-based phosphorylation measurements on an independent preparation of Kai proteins. Error bars represent standard deviations calculated by bootstrapping (see Computational methods). Horizontal error bars are smaller than marker widths.

DOI: http://dx.doi.org/10.7554/eLife.23539.020

Figure 3—source data 1. Source data for Figure 3A–B.
DOI: 10.7554/eLife.23539.021
Figure 3—source data 2. Source data for Figure 3C–D.
DOI: 10.7554/eLife.23539.022
Figure 3—source data 3. Source data for Figure 3E–F.
DOI: 10.7554/eLife.23539.023

Figure 3.

Figure 3—figure supplement 1. Example calculation of phase shifts in response to metabolic step transitions.

Figure 3—figure supplement 1.

Phase shifts are computed from the difference in phase of the control reaction and the perturbed reaction evaluated at the time of the step. Phase of each reaction at the time of the step (green dashed line) is calculated based on the sinusoidal fit to the normalized fluorescence polarization trajectory for that reaction. Periods of the oscillator in day and night conditions were fit globally to all reactions measured in one experiment. See Computational methods for fitting details.
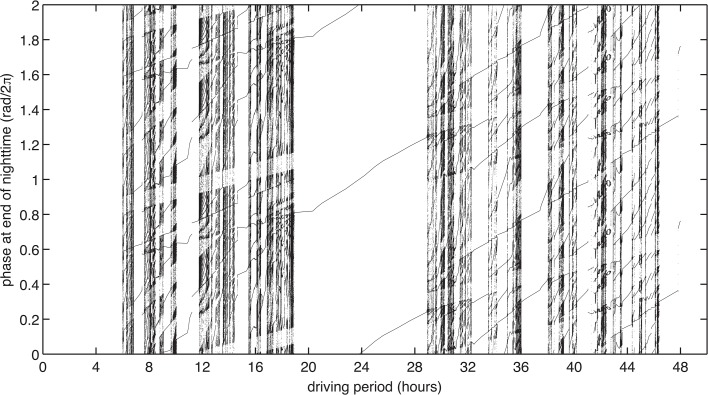
Figure 3—figure supplement 2. Experimentally measured step-response functions predict entrainment to driving periods near 24 hr.

Figure 3—figure supplement 2.

(A) Entrainment simulations with driving periods 4–48 hr were performed for 1000 cycles, and phases at the end of nighttime (immediately before the action of L) of the last 920 cycles were plotted. Simulation results are double-plotted along the vertical axis for clarity. In each simulation, the oscillator runs at constant angular speed in the light and dark, and experiences instantaneous phase shifts at dawn and dusk, according to the values of L and D. Refer to Figure 4A for an illustration of a single entrainment simulation.