Abstract
If the shared familial risk factors that predispose to psychotic disorder interact with early-life exposures in the urban environment, familial correlations of psychosis proneness measures should be higher in the exposed environment. We tested the hypothesis that in sib-pairs with one member affected by psychotic disorder, the familial correlation of psychotic experiences, but not depression, negative symptoms, or intelligence quotient (IQ), would be higher if the nonaffected sibling was raised in an urban environment until age 15 years. The sample analyzed consisted of 959 sib-pairs of whom one was affected with psychotic disorder. Lifetime self-reported psychotic and depressive experiences were measured using the self-reported “Community Assessment of Psychic Experiences” (CAPE). In the unadjusted model of the sibling-patient association in CAPE positive symptoms, there was a significant interaction by urban environment (B interaction = 0.079, 95% CI: 0.021 to 0.137, P = .007, n = 828). Stratified analyses revealed a strong sib-pair association in the urban environment (B = 0.077, 95% CI: 0.037 to 0.117, P < .001) and absence of association in the rural environment (B = −0.002, 95% CI: −0.044 to 0.039, P = .920). Associations were not affected after taking into account confounders and outliers, and there was no evidence that sibling associations in IQ, depression, or negative symptoms were moderated by the urban environment. The results agree with previous work indicating that the effects of the genetic and environmental factors that occasion familial clustering of psychotic disorder depend on whether or not an individual spends his early life in an urban environment.
Keywords: schizophrenia, etiology, genes, urbanicity, risk factors
Introduction
It is generally agreed that both genes and environment have an important role in the etiology of psychotic disorder. Growing up in an urban environment until age 15 years is a risk factor for psychotic disorder.1,2 While part of the observed risk may be mediated by shared genetic factors,3,4 it likely also represents substantial nongenetic risk.5 Several studies found evidence for interaction, in that the effect or the urban environment was greater if there was also evidence of familial clustering.6–8 These findings suggest that environmental influences associated with growing up in an urban environment may interact with the genetic or environmental factors that occasion familial clustering of psychotic outcomes in families.
One way to take these findings further is to examine the degree of familial clustering of psychosis-related phenotypes in sib-pairs exposed and nonexposed to growing up in an urban environment. If familial risk-environment interactions play a role in the development of psychotic disorder, and shared genes associated with familial risk play a role, the heritability estimate of the disorder will differ between high-risk and low-risk environments.9 Given that heritability estimates are based on measures of phenotypic correlation between related individuals, examination of these as a function of environmental exposures represents an elementary first test to what degree the impact of a given environmental exposure may be moderated by familial risk. Thus, in the case of developmental urbanicity, if there is gene-environment interaction, one expects greater sib-pair correlations for psychosis-related measures in sibs who grew up in the exposed environment. Given that the great majority of sib-pairs share the place of growing up before the age of 15 years, the design cannot be biased by genetic risk factors impacting on sibs differentially choosing to live in an urban or a rural environment.
Familial correlation is the correlation of a trait among family members. Familial correlation is a fundamental analytic tool to investigate the influences of shared genes and shared environments on a continuous trait. For a defined relationship (eg, parent-offspring, siblings, or cousins, etc.), familial correlation greater than zero implies that shared genes or shared environments influence the trait. We wished to study the hypothesis that in families where at least one family member was affected by psychosis, familial correlation of psychotic experiences would be higher in an urban environment. To check if findings were specific to the dimension of psychosis, we examined the same correlations for depressive experiences, as a measure of common psychopathology, for negative symptoms, as a measure of motivational alterations in psychotic disorder, and for intelligence quotient (IQ) as a summary measure of cognitive performance.
Method
Subjects
The data pertain to the baseline sample of the GROUP study.10 The full GROUP sample at baseline consisted of 1119 patients with nonaffective psychotic disorder, 1059 siblings of these patients, 920 parents of the patients, and 586 unrelated healthy comparison subjects.10 Inclusion criteria were: (1) age range 16 to 50 years and (2) good command of Dutch language. For patients, an additional inclusion criterion was the presence of a clinical diagnosis of nonaffective psychotic disorder. Healthy comparison subjects status was confirmed by using the Family Interview for Genetic studies11 with the healthy comparison subject as informant, to establish absence of first-degree relatives with a psychotic disorder. Diagnosis was based on the Diagnostic and Statistical Manual of Mental Disorder-IV (DSM-IV) criteria,12 assessed with the Comprehensive Assessment of Symptoms and History (CASH) interview13 or Schedules for Clinical Assessment for Neuropsychiatry (SCAN 2.1).14 The majority of patients had a DSM-IV diagnosis of schizophrenia (DSM-IV 295.x; n = 940, 84%).
The study was approved by the standing ethics committee of Utrecht University Medical Centre, and all the subjects gave written informed consent in accordance with the committee’s guidelines.
Urban Exposure
We generated a historical population density record for each municipality from 1930 onwards using the Dutch Central Bureau of Statistics (CBS) and equivalent Belgium database. When data were not available, linear extrapolations were computed. When historical names of municipalities disappeared from historical records (eg, due to city mergers), we used the available data from the agglomerate city. Subjects were asked to describe where they lived during their life. This resulted in a number of records for each subject, containing locations by age period. For each of these records, we computed the average population density (by square kilometer, excluding water) of the municipality for the matching year periods. Subsequently, it was determined where the subject lived at birth, between ages 0–4 years; 5–9 years; 10–14 years; 15–19 years; 20–39 years; 40–59 years; and 60+ up to the actual age. Average population density over the period was categorized conform the Dutch CBS urbanicity rating (1 = <500/km2; 2 = 500–1000/km2; 3 = 1000–1500/km2; 4 = 1500–2500/km2; 5 = 2500+/km2). The periods 0–4 years, 5–9 years, and 10–14 years were merged to average urbanicity exposure between 0 and 14 years. The median value of urbanicity between 0 and 14 years in the controls was used to define a dichotomous urbanicity exposure.
Psychosis Measures in Sib-Pairs
The Community Assessment of Psychic Experiences (CAPE; www.cape42.homestead.com) was developed in order to rate self-reports of lifetime psychotic experiences.15 Items are modeled on patient experiences as contained in the Present State Examination, 9th version (PSE-9),16 schedules assessing negative symptoms such as the Scale for the Assessment of Negative Symptoms (SANS)17 and the Subjective Experience of Negative Symptoms (SENS),18 and scales assessing depressive symptoms such as the Calgary Depression Scale.19 Items are scored on a 4-point scale. In the current analyses, CAPE dimensions of frequency of positive experiences (20 items), negative experiences (14 items), and depressive experiences (8 items) were included, representing the person’s perceived psychosis load over the lifetime. A total score representing the mean of all items was calculated for each dimension. For the current analyses, the dimensions of psychotic, depressive, and negative experiences were used.
Intelligence Quotient
IQ was estimated based on the 4-subtest version (Information, Block Design, Digit Symbol Coding and Arithmetic)20 of the Wechsler Adult Intelligence Scale (WAIS-III).21
Analysis
Analyses are based on version 5.0 of the GROUP database. Analyses were done using Stata, version 14.22 For the sibling-patient analyses, as per our main hypothesis, we calculated the cross-sib, within-trait association for CAPE psychosis, with sibling CAPE as dependent variable and patient CAPE as the independent variable, as well as possible moderation thereof by the binary urban environment variable. To check for specificity, we made similar calculations for the association with IQ, CAPE negative symptoms, and CAPE depression.
In the case of significant interaction, stratified results were calculated from the model containing the interaction, using the Stata MARGINS procedure.
Given hierarchical clustering of the data (clustering of siblings in the same family), multilevel random intercept regression models were applied to the data using the XTREG routine in the Stata statistical program.23
Analyses were corrected a priori for age, sex, ethnic group (white European vs other), and educational level (continuous variable ranging from 0 [no education], 3–5 [school diploma] to 8 [university degree]).
Results
Sample
The total number of sib-pairs, consisting of one patient and one healthy sibling, for analysis at baseline was 1092. Of these, 959 sib-pairs had valid data on urban exposure until age 15 years, of whom 86% were concordant for urban exposure (table 1). There was no evidence of an urbanicity main effect on CAPE positive symptoms, corrected for ethnic group, age, sex, and educational level, in either the patients (P = .080) or their siblings (P = .651).
Table 1.
Sample Descriptives by Group (Siblings, Patients) and Urbanicity (Median Split Around Control Value)
| Age | Proportion Female | Proportion Ethnic Minority | Education | CAPE Positive | CAPE Depressive | IQ | |||
|---|---|---|---|---|---|---|---|---|---|
| Siblings | Rural | Mean or % | 28.05 | 0.52 | 0.10 | 2.52 | 0.20 | 0.62 | 102.65 |
| SD | 8.48 | 1.45 | 0.19 | 0.40 | 16.08 | ||||
| n | 444 | 444 | 444 | 441 | 405 | 407 | 429 | ||
| Urban | Mean or % | 27.94 | 0.57 | 0.21 | 2.58 | 0.22 | 0.67 | 102.83 | |
| SD | 8.22 | 1.49 | 0.22 | 0.42 | 15.07 | ||||
| n | 576 | 576 | 576 | 575 | 507 | 507 | 552 | ||
| Total | Mean or % | 27.99 | 0.55 | 0.16 | 2.55 | 0.22 | 0.65 | 102.75 | |
| SD | 8.33 | 1.47 | 0.21 | 0.41 | 15.51 | ||||
| n | 1020 | 1020 | 1020 | 1016 | 912 | 914 | 981 | ||
| Patients | Rural | Mean or % | 27.28 | 0.27 | 0.10 | 1.96 | 0.74 | 1.05 | 95.55 |
| SD | 7.91 | 1.31 | 0.51 | 0.60 | 15.08 | ||||
| n | 453 | 453 | 453 | 451 | 396 | 396 | 420 | ||
| Urban | Mean or % | 27.12 | 0.17 | 0.21 | 2.01 | 0.66 | 1.00 | 97.84 | |
| SD | 6.86 | 1.35 | 0.48 | 0.58 | 14.75 | ||||
| n | 555 | 555 | 555 | 552 | 451 | 456 | 520 | ||
| Total | Mean or % | 27.19 | 0.21 | 0.16 | 1.98 | 0.70 | 1.02 | 96.81 | |
| SD | 7.35 | 1.33 | 0.50 | 0.59 | 14.94 | ||||
| n | 1008 | 1008 | 1008 | 1003 | 847 | 852 | 940 |
Note: CAPE, Community Assessment of Psychic Experiences.
Sibling-Patient Association as a Function of Urban Living
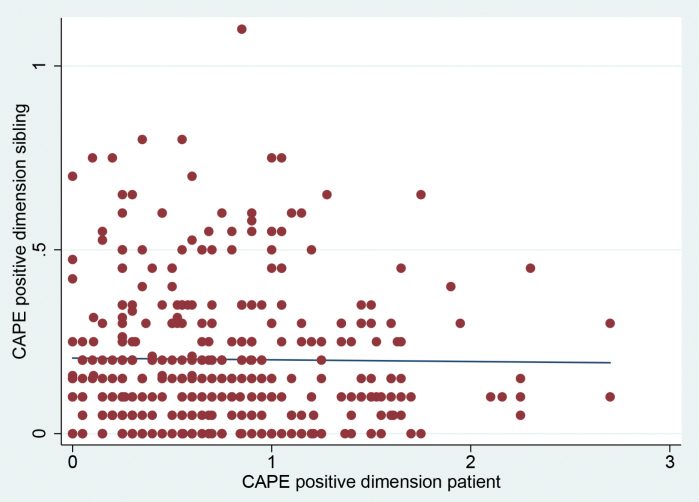
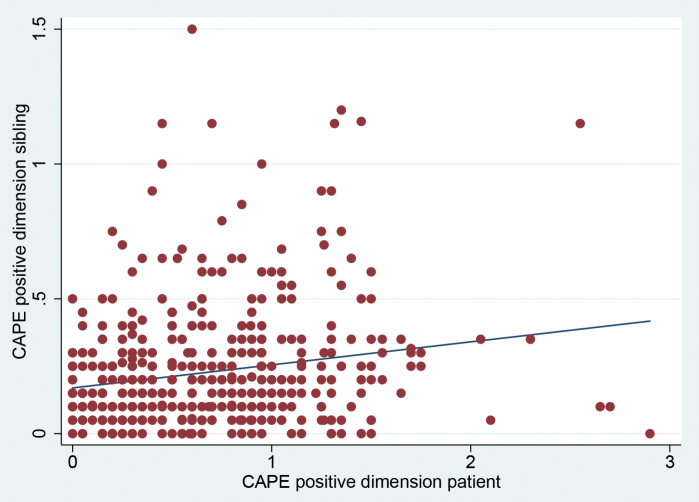
In the unadjusted model of the sibling-patient association in CAPE positive symptoms, there was a significant interaction by urban environment (B interaction = 0.079, 95% CI: 0.021 to 0.137, P = .007, n = 828) (table 2; figure 1). Stratified analyses revealed a strong sibling association in the urban environment (B = 0.077, 95% CI: 0.037 to 0.117, P < .001) and absence of association in the rural environment (B = −0.002, 95% CI: −0.044 to 0.039, P = .920).
Table 2.
Results of Multilevel Random (XTREG) Intercept Regression Analyses in Sib-Pairs (Patients and Siblings), as a Function of Urban Upbringing
| Sib-Pair (Sibling-Patient) Association | Log-Transformed Sib-Pair Association | Sib-Pair Association Corrected for Age, Sex, Ethnicity, and Level of Education | |||||||
|---|---|---|---|---|---|---|---|---|---|
| B (95% CI) | P | n | B (95% CI) | P | n | B (95% CI) | P | n | |
| Measure | |||||||||
| CAPEPOS (total) | 0.079 (0.021 to 0.137) | .007 | 828 | 0.207 (−0.26 to 0.439) | .082 | 828 | 0.076 (0.019 to 0.133) | .009 | 815 |
| CAPEPOS (urban) | 0.077 (0.037 to 0.117) | <.001 | 828 | 0.222 (0.064 to 0.381) | .006 | 828 | 0.073 (0.033 to 0.112) | <.001 | 815 |
| CAPEPOS (rural) | −0.002 (−0.044 to 0.039) | .920 | 828 | −0.0157 (−0.156 to 0.188) | .858 | 828 | −0.004 (−0.045 to 0.038) | .865 | 815 |
Note: B, regression coefficient; 95% CI, 95% confidence interval; P, P value; n, number of observations; CAPEPOS, dimension of positive psychotic experiences of CAPE (Community Assessment of Psychic Experiences).
Fig. 1.
Correlation between patient positive psychotic symptoms and sibling positive psychotic symptoms (left panel in rural environment and right panel in urban environment). CAPE, Community Assessment of Psychic Experiences.
If analyses were limited to the sib-pairs who were concordant for the urban exposure, the interaction was not attenuated (B interaction = 0.087, 95% CI: 0.022 to 0.152, P = .009, n = 661).
To check whether this association was due to outliers, analyses were repeated with the log-transformed CAPE positive symptom score revealing a difference of the same order of magnitude between the sibling association in urban and rural environments (B interaction = 0.207, 95% CI: −0.26 to 0.439, P = .082, n = 828). Stratified analyses revealed a similarly strong sibling association in the urban environment (B = 0.222, 95% CI: 0.064 to 0.381, P = .006) and absence of association in the rural environment (B = −0.0157, 95% CI: −0.156 to 0.188, P = .858).
The association results also remained similar after adjusting for confounders (age, sex, ethnicity, and level of education of both siblings) (table 2).
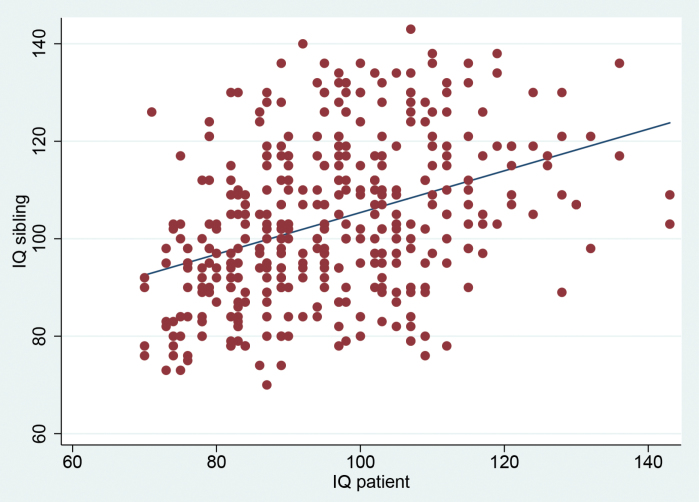
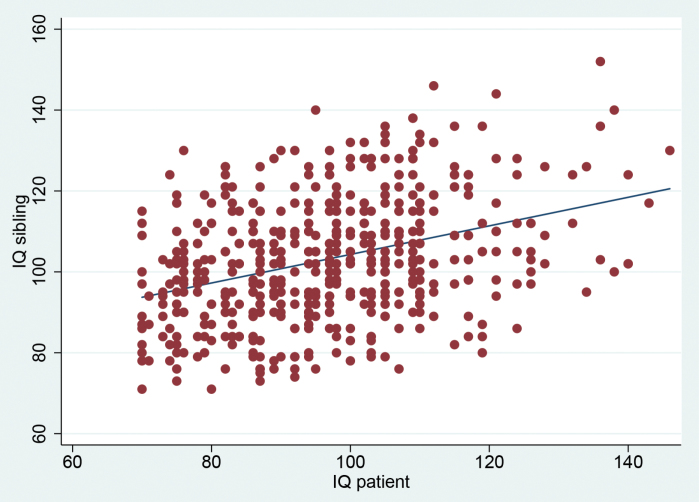
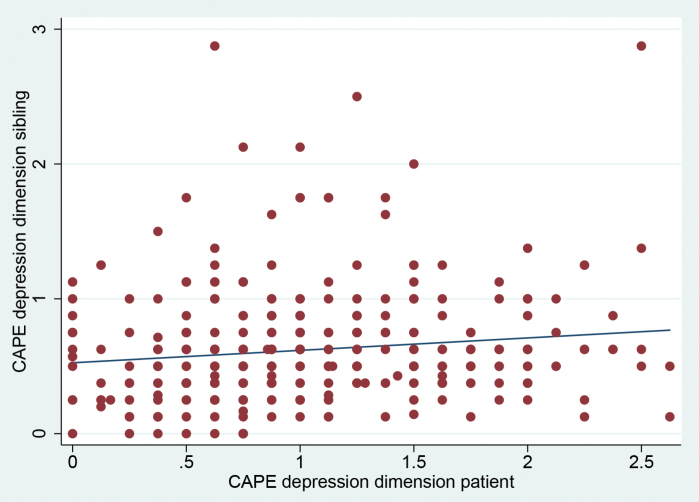
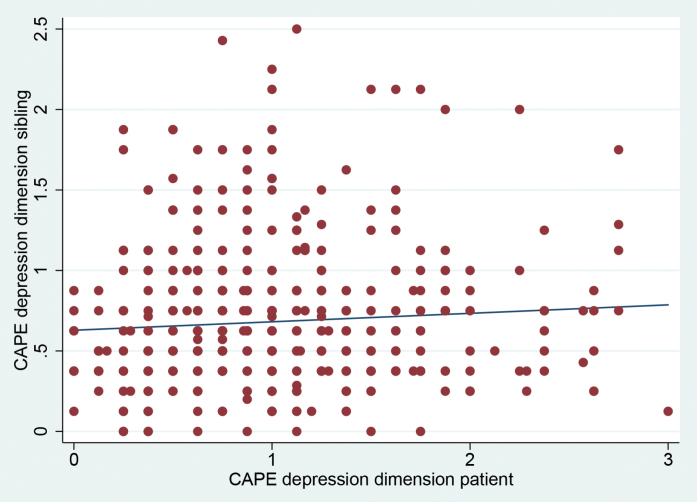
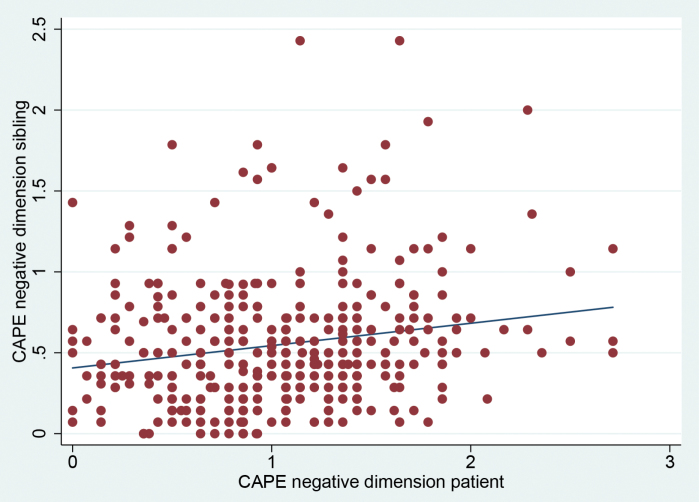
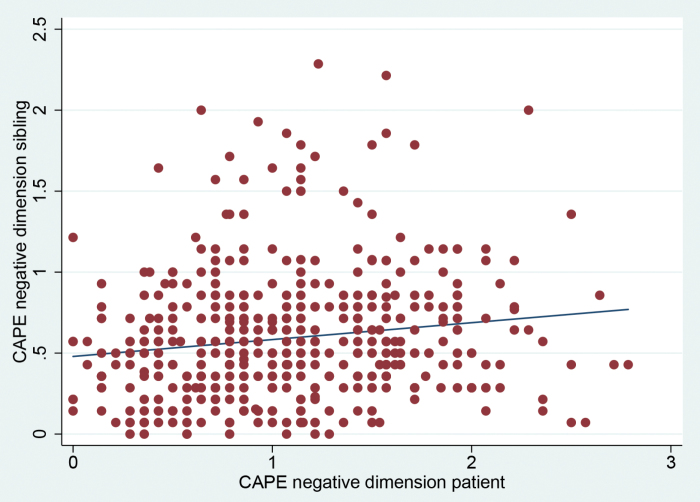
There was no evidence that sibling associations in IQ, CAPE depression, or CAPE negative symptoms were moderated by the urban environment (IQ: B interaction = −0.080, 95% CI: −0.21 to 0.050, P = .235; depression: B interaction = −0.036, 95% CI: −0.134 to 0.062, P = .474; negative symptoms: B interaction = −0.029, 95% CI: −0.131 to 0.073, P = .581) (figures 2 – 4).
Fig. 2.
Correlation between patient and siblings IQ (left panel in rural environment and right panel in urban environment).
Fig. 3.
Correlation between patient and sibling symptoms of depression (left panel in rural environment and right panel in urban environment). CAPE, Community Assessment of Psychic Experiences.
Fig. 4.
Correlation between patient and sibling CAPE negative symptoms (left panel in rural environment and right panel in urban environment). CAPE, Community Assessment of Psychic Experiences.
Discussion
The results show that familial correlation in positive psychotic symptoms was moderated by having lived, during the first 15 years of life, in an urban environment. The results also show that moderation by the urban environment was not present for IQ and depressive or negative symptoms in the same individuals. Thus, urbanicity may act synergistically as an environmental factor with the genetic and/or environmental factors that occasion familial clustering of psychotic disorder, to produce symptoms of psychosis. This synergistic process is specific for the dimension of psychosis associated with “aberrant salience,” or the liability to perceive signal in random noise,24 that does not apply to the expression of depression, motivation, or intelligence. This type of interaction is not exclusive to urbanicity, as a similar interaction was found in the same cohort between genes and cannabis use in the development of psychosis.25,26
The large sample size of this study is a strength. Also, conducting correlation analyses between patients and siblings has certain advantages over case-control studies. This is because in the sibling design there is automatic control for shared circumstances that can influence mental health which can potentially act as confounding factors. Also, given that the environmental exposure of urbanicity was shared between sib-pairs, bias due to differential exposure to the urban environment as a function of genetic risk can be discarded.
Similarly, the results cannot be confounded by main effects of the urban environment on psychosis proneness. First, there was no significant main effect of urban environment in either patients or siblings. Second, the urban exposure was included in the interaction model, thus effectively controlling for urban environment. Third, a main of effect of urban environment on psychosis proneness was not the hypothesis; the hypothesis was that the sib-pair correlation in psychosis proneness would be higher in an urban environment. The sib-pair correlation cannot be confounded by a main effect of urbanicity on psychosis proneness, as both sibs are either “urban” or “rural” in the sensitivity analyses presented.
Results can also not be confounded by a main effect of group on CAPE scores. Patients of course had higher scores than siblings. However, what we analyzed was to what degree a (relatively) higher score in a given patient would be accompanied by a (relatively) higher score in the sibling.
The increased risk associated with the urban environment appears to be specific for psychosis outcomes, and not apply, or apply more weakly, to affective dimensions.27,28 For example, a weak effect or urban environment on depression was found in one study.29 Therefore, the absence of increased familial correlation of depression as a function of the urban environment is conform expectation. To the degree that the urban environment also increases risk for other mental disorders, a similar mechanism of interaction between familial risk and urban environment may not apply.
Similarly, there was no impact of the urban environment on the size of the sibling correlation in CAPE negative symptoms. This is in agreement with a similar dissociation in the pattern of association of positive and negative symptoms in a previous publication.30
Cognitive development may be impacted by urban residence, mediated by levels of deprivation,31 a finding that is supported by evidence of poverty negatively impacting cognitive function.32 One study reported that cognitive function, as an endophenotype of psychotic disorder, interacts with urban environment in shaping risk for later psychotic disorder.6 Another study found that the association between urban environment and psychotic experiences was not mediated by cognitive function.33 All these findings do not contrast with the current study, which tested a different, specific hypothesis, namely that the urban environment interacts with familial risk to impact cognitive function, which was not the case.
The findings should be interpreted in the light of a number of limitations. First, urbanicity is a proxy for hypothesized factors in the urban environment, the precise nature of which remains elusive. Second, there was no main effect of urban environment, while one was expected. This may be due to chance, given that previous research in the Netherlands has reported such associations.8 Third, there was considerable delay between the time of exposure (before age 15 years) and assessment of outcomes in patients and siblings, likely weakening associations. Finally, CAPE measures are self-report, which may again bias findings toward the null.
Funding
Funded in part by the European Community’s Seventh Framework Program under grant agreement no. HEALTH-F2-2009-241909 (Project EU-GEI). The infrastructure for the GROUP study is funded through the Geestkracht program of the (Dutch Health Research Council ZON-MW, grant number 10-000-1001), and matching funds from participating industry (Lundbeck, AstraZeneca, Eli Lilly, Janssen Cilag), universities and mental health care organizations (Amsterdam: Academic Psychiatric Centre of the Academic Medical Center and the mental health institutions: GGZ Ingeest, Arkin, Dijk en Duin, GGZ Rivierduinen, Erasmus Medical Centre, GGZ Noord Holland Noord. Maastricht: Maastricht University Medical Centre and the mental health institutions: GGZ Eindhoven en De Kempen, GGZ Breburg, GGZ Oost-Brabant, Vincent van Gogh voor Geestelijke Gezondheid, Mondriaan, Zuyderland, MetGGZ, Riagg-Virenze Maastricht, Universitair Centrum Sint-Jozef Kortenberg, CAPRI University of Antwerp, PC Ziekeren Sint-Truiden, PZ Sancta Maria Sint-Truiden, GGZ Overpelt, OPZ Rekem. Groningen: University Medical Center Groningen and the mental health institutions: Lentis, GGZ Friesland, GGZ Drenthe, Dimence, Mediant, GGNet Warnsveld, Yulius Dordrecht and Parnassia psycho-medical center [The Hague]. Utrecht: University Medical Center Utrecht and the mental health institutions: Altrecht, GGZ Centraal, Riagg Amersfoort and Delta).
Acknowledgments
Genetic Risk and Outcome of Psychosis (GROUP) Investigators: GROUP investigators are: Berhooz Z. Alizadeha, Agna A. Bartels-Velthuisa, Nico J. van Beverenb,c,d, Richard Bruggemana, Wiepke Cahne, Lieuwe de Haanf, Philippe Delespaulg, Carin J. Meijerf, Inez Myin-Germeysh, Rene S. Kahne, Frederike Schirmbeckf, Claudia J. P. Simonsg,i, Neeltje E. van Harene, Jim van Osg,j, Ruud van Winkelg,h. Affiliations: aUniversity of Groningen, University Medical Center Groningen, University Center for Psychiatry, Groningen, The Netherlands; bAntes Center for Mental Health Care, Rotterdam, The Netherlands; cErasmus MC, Department of Psychiatry, Rotterdam, The Netherlands; dErasmus MC, Department of Neuroscience, Rotterdam, The Netherlands; eUniversity Medical Center Utrecht, Department of Psychiatry, Brain Center Rudolf Magnus, Utrecht, The Netherlands; fAcademic Medical Center, University of Amsterdam, Department of Psychiatry, Amsterdam, The Netherlands; gMaastricht University Medical Center, Department of Psychiatry and Psychology, School for Mental Health and Neuroscience, Maastricht, The Netherlands; hKU Leuven, Department of Neuroscience, Research Group Psychiatry, Center for Contextual Psychiatry, Leuven, Belgium; iGGzE, Institute for Mental Health Care Eindhoven and De Kempen, Eindhoven, The Netherlands; jKing’s College London, King’s Health Partners, Department of Psychosis Studies, Institute of Psychiatry, London, United Kingdom.
We are grateful for the generosity, in terms of time and effort, shown by the patients, their families, and the healthy comparison subjects, and for the continuing collaboration with all the researchers who make the GROUP project possible. Furthermore, we would like to thank all research personnel involved in the GROUP project, in particular: Joyce van Baaren, Erwin Veermans, Ger Driessen, Truda Driesen, Karin Pos, Erna van ‘t Hag, Jessica de Nijs, Atiqul Islam, Wendy Beuken, and Debora Op ‘t Eijnde. The authors have declared that there are no conflicts of interest in relation to the subject of this study.
References
- 1. Vassos E, Pedersen CB, Murray RM, Collier DA, Lewis CM. Meta-analysis of the association of urbanicity with schizophrenia. Schizophr Bull. 2012;38:1118–1123. [DOI] [PMC free article] [PubMed] [Google Scholar]
- 2. Pedersen CB, Mortensen PB. Evidence of a dose-response relationship between urbanicity during upbringing and schizophrenia risk. Arch Gen Psychiatry. 2001;58:1039–1046. [DOI] [PubMed] [Google Scholar]
- 3. Pedersen CB, Mortensen PB. Are the cause(s) responsible for urban-rural differences in schizophrenia risk rooted in families or in individuals? Am J Epidemiol. 2006;163:971–978. [DOI] [PubMed] [Google Scholar]
- 4. Sariaslan A, Fazel S, D’Onofrio BM, et al. Schizophrenia and subsequent neighborhood deprivation: revisiting the social drift hypothesis using population, twin and molecular genetic data. Transl Psychiatry. 2016;6:e796. [DOI] [PMC free article] [PubMed] [Google Scholar]
- 5. van Os J, Kenis G, Rutten BP. The environment and schizophrenia. Nature. 2010;468:203–212. [DOI] [PubMed] [Google Scholar]
- 6. Weiser M, van Os J, Reichenberg A, et al. Social and cognitive functioning, urbanicity and risk for schizophrenia. Br J Psychiatry. 2007;191:320–324. [DOI] [PubMed] [Google Scholar]
- 7. van Os J, Hanssen M, Bak M, Bijl RV, Vollebergh W. Do urbanicity and familial liability coparticipate in causing psychosis? Am J Psychiatry. 2003;160:477–482. [DOI] [PubMed] [Google Scholar]
- 8. van Os J, Pedersen CB, Mortensen PB. Confirmation of synergy between urbanicity and familial liability in the causation of psychosis. Am J Psychiatry. 2004;161:2312–2314. [DOI] [PubMed] [Google Scholar]
- 9. Kendler KS, Eaves LJ. Models for the joint effect of genotype and environment on liability to psychiatric illness. Am J Psychiatry. 1986;143:279–289. [DOI] [PubMed] [Google Scholar]
- 10. Korver N, Quee PJ, Boos HB, Simons CJ, de Haan L; GROUP Investigators Genetic Risk and Outcome of Psychosis (GROUP), a multi-site longitudinal cohort study focused on gene-environment interaction: objectives, sample characteristics, recruitment and assessment methods. Int J Methods Psychiatr Res. 2012;21:205–221. [DOI] [PMC free article] [PubMed] [Google Scholar]
- 11. NIMH. Genetics.Initiative. Family Interview for Genetic Studies (FIGS). Rockville, MD: National Institute of Mental Health; 1992. [Google Scholar]
- 12. American Psychiatric Association. Diagnostic and Statistical Manual of Mental Disorders. 4th ed., text rev. ed. Washington, DC: American Psychiatric Association; 2000. [Google Scholar]
- 13. Andreasen NC, Flaum M, Arndt S. The Comprehensive Assessment of Symptoms and History (CASH). An instrument for assessing diagnosis and psychopathology. Arch Gen Psychiatry. 1992;49:615–623. [DOI] [PubMed] [Google Scholar]
- 14. Wing JK, Babor T, Brugha T, et al. SCAN. Schedules for Clinical Assessment in Neuropsychiatry. Arch Gen Psychiatry. 1990;47:589–593. [DOI] [PubMed] [Google Scholar]
- 15. Konings M, Bak M, Hanssen M, van Os J, Krabbendam L. Validity and reliability of the CAPE: a self-report instrument for the measurement of psychotic experiences in the general population. Acta Psychiatr Scand. 2006;114:55–61. [DOI] [PubMed] [Google Scholar]
- 16. Wing JK, Cooper JE, Sartorius N. The Measurement and Classification of Psychiatric Symptoms. London: Cambridge University Press; 1974. [Google Scholar]
- 17. Andreasen NC. Negative symptoms in schizophrenia. Definition and reliability. Arch Gen Psychiatry. 1982;39:784–788. [DOI] [PubMed] [Google Scholar]
- 18. Selten JP, Sijben NE, van den Bosch RJ, Omloo-Visser J, Warmerdam H. The subjective experience of negative symptoms: a self-rating scale. Compr Psychiatry. 1993;34:192–197. [DOI] [PubMed] [Google Scholar]
- 19. Addington D, Addington J, Maticka-Tyndale E. Assessing depression in schizophrenia: the Calgary Depression Scale. Br J Psychiatry Suppl. 1993:39–44. [PubMed] [Google Scholar]
- 20. Blyler CR, Gold JM, Iannone VN, Buchanan RW. Short form of the WAIS-III for use with patients with schizophrenia. Schizophr Res. 2000;46:209–215. [DOI] [PubMed] [Google Scholar]
- 21. Wechsler D. WAIS-III: Wechsler Adult Intelligence Scale (3rd ed.): Administration and Scoring Manual. San Antonio, TX: Psychological Corporation; 1997. [Google Scholar]
- 22. StataCorp. STATA Statistical Software: Release 14. College Station, TX: StataCorp; 2015. [Google Scholar]
- 23. StataCorp. Stata Longitudinal-Data/Panel-Data Reference Manual Release 14. STATA Statistical Software: Release 14. College Station, TX: StataCorp; 2015. [Google Scholar]
- 24. Kapur S. Psychosis as a state of aberrant salience: a framework linking biology, phenomenology, and pharmacology in schizophrenia. Am J Psychiatry. 2003;160:13–23. [DOI] [PubMed] [Google Scholar]
- 25. van Winkel R; GROUP Investigators Further evidence that cannabis moderates familial correlation of psychosis-related experiences. PLoS One. 2015;10:e0137625. [DOI] [PMC free article] [PubMed] [Google Scholar]
- 26. Genetic Risk and Outcome in Psychosis Investigators. Evidence that familial liability for psychosis is expressed as differential sensitivity to cannabis: an analysis of patient-sibling and sibling-control pairs. Arch Gen Psychiatry. 2011;68:138–147. [DOI] [PubMed] [Google Scholar]
- 27. Kaymaz N, Krabbendam L, de Graaf R, Nolen W, Ten Have M, van Os J. Evidence that the urban environment specifically impacts on the psychotic but not the affective dimension of bipolar disorder. Soc Psychiatry Psychiatr Epidemiol. 2006;41:679–685. [DOI] [PubMed] [Google Scholar]
- 28. Mortensen PB, Pedersen CB, Melbye M, Mors O, Ewald H. Individual and familial risk factors for bipolar affective disorders in Denmark. Arch Gen Psychiatry. 2003;60:1209–1215. [DOI] [PubMed] [Google Scholar]
- 29. Sundquist K, Frank G, Sundquist J. Urbanisation and incidence of psychosis and depression: follow-up study of 4.4 million women and men in Sweden. Br J Psychiatry. 2004;184:293–298. [DOI] [PubMed] [Google Scholar]
- 30. Dominguez MD, Saka MC, can Saka M, Lieb R, Wittchen HU, van Os J. Early expression of negative/disorganized symptoms predicting psychotic experiences and subsequent clinical psychosis: a 10-year study. Am J Psychiatry. 2010;167:1075–1082. [DOI] [PubMed] [Google Scholar]
- 31. Gouin M, Flamant C, Gascoin G, et al. The association of urbanicity with cognitive development at five years of age in preterm children. PLoS One. 2015;10:e0131749. [DOI] [PMC free article] [PubMed] [Google Scholar]
- 32. Mani A, Mullainathan S, Shafir E, Zhao J. Poverty impedes cognitive function. Science. 2013;341:976–980. [DOI] [PubMed] [Google Scholar]
- 33. Stefanis NC, Delespaul P, Smyrnis N, et al. Is the excess risk of psychosis-like experiences in urban areas attributable to altered cognitive development? Soc Psychiatry Psychiatr Epidemiol. 2004;39:364–368. [DOI] [PubMed] [Google Scholar]


