Abstract
Endoplasmic reticulum (ER) stress-mediated pancreatic insulin-producing β-cell dysfunction and death are critical elements in the onset and progression of both type 1 and type 2 diabetes. Here, through cell-based high throughput screening we identified benzamide derivatives as a novel class of β-cell protective agents against ER stress-induced dysfunction and death. Through structure-activity relationship optimization, a 3-(N-piperidinyl)methyl benzamide derivative 13d markedly protects β-cells against ER stress-induced dysfunction and death with near 100% maximum rescue activity and an EC50 value of 0.032 µM. Compound 13d alleviates ER stress in β-cells by suppressing ER stress-mediated activation of all three branches of unfolded protein response (UPR) and apoptotic genes. Finally, we show that 13d significantly lowers blood glucose levels and increases concomitant b-cell survival and number in a streptozotocin-induced diabetic mouse model. Identification of β-cell-protective small molecules against ER stress provides a new promising modality for the treatment of diabetes.
Introduction
Diabetes, a group of metabolic diseases in which blood sugar levels are abnormally high over a prolonged period, has become a serious public health problem with tremendous social and economic burden on society; as of 2015, 415 million people were estimated to have diabetes worldwide.1 The dysfunction and death of insulin-producing pancreatic β-cells are critical elements in the pathogenesis of type 1 (T1D) and type 2 (T2D) diabetes.2, 3 Increasing evidence indicates that endoplasmic reticulum (ER) stress, a condition in which misfolded proteins accumulate in the ER, plays an important role in the decline in pancreatic β-cell function and mass in diabetes.4, 5 Thus, prevention of functional β-cell death by targeting ER stress is a promising therapeutic approach for patients with diabetes. Unfortunately, no existing anti-diabetic drugs are capable of halting the progression of β-cell dysfunction and death.
In T2D, β-cells are forced to synthesize more insulin due to higher metabolic demands of obesity and insulin resistance, which typically exceeds the cellular capacity of the ER for protein folding, and eventually leads to ER stress and β-cell dysfunction and death.3 In addition, the common causes for β-cell dysfunction and death in T2D, including lipotoxicity, glucotoxicity, oxidative stress, amyloid deposition, and insulin mutations, have been known to be associated with unresolvable chronic ER stress.4, 6, 7 In T1D in which β-cells are destroyed by an auto-immune reaction, ER stress has also been implicated, and an ER stress-reducing chemical chaperone has been reported to prevent the onset of T1D in mouse models by protecting β-cell survival.8–10
ER stress induces activation of the unfolded protein response (UPR) through three ER membrane proteins, inositol-requiring protein 1a (IRE1a), PKR-like ER kinase (PERK), and activating transcription factor 6 (ATF6), which act as unfolded protein sensors.4, 6, 11, 12 In unstressed cells, these sensors are maintained in an inactive state through interaction with the protein chaperone binding immunoglobulin protein (BiP). Under ER stress, unfolded and misfolded proteins accumulate in the ER and bind to and sequester BiP, thereby releasing and activating the sensors.13 Upon initial or mild ER stress, IRE1a, PERK, and ATF6 each activate a series of events aimed at restoring ER homeostasis by altering the translation, folding, and post-translational modification of secreted and membrane proteins.11, 12, 14, 15 However, failure to adequately re-establish ER homeostasis eventually triggers cell death, as in the case of chronic or severe ER stress.11, 12, 14–16
Despite of the importance of ER stress in mediating β-cell dysfunction and death in the pathogenesis of diabetes, only a handful of small molecules have so far been reported to exhibit β-cell-protective activities against ER stress.17, 18 A major reason for the scarcity of β-cell-protective small molecules could lie in the unique property of β-cells. β-cells normally produce and rapidly secrete insulin in response to increases in blood glucose levels after food intake. To achieve this, they maintain a very large pool of proinsulin mRNA (~20% of the total cellular mRNA) and increase proinsulin protein synthesis 25-fold upon glucose stimulation.19, 20 This surge in proinsulin synthesis places a heavy burden on the protein-folding capacity of the ER; β-cells are therefore particularly susceptible to ER stress.6 This β-cell property may also in part explain why compounds that protect other cell types from ER stress fail to protect β-cells.21, 22 Furthermore, the existing β-cell-protective small molecules17, 18 yet still suffer from the issue of low potency, often with EC50 values ranging from single- to double-digit µM.
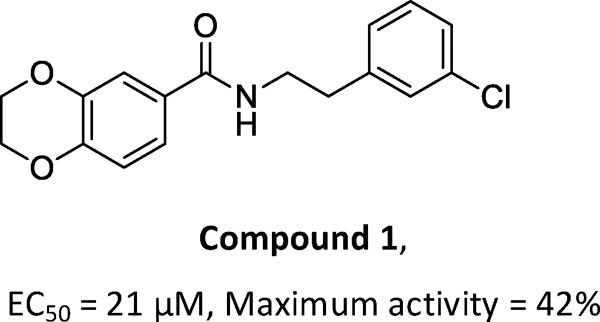
In this study, we used a β-cell survival-based high throughput screening approach to identify small molecules that protect β-cells against ER stress-induced apoptosis, and discovered N-(3-chlorophenethyl)-2,3-dihydrobenzo[b][1,4]dioxine-6- carboxamide (1, Figure 1), a benzamide derivative, as a β-cell-protective small molecule against ER stress, from ~50,000 compounds screened. Although 1 is structurally novel, its weak activity on β-cell-protection (the maximum activity is 42% with an EC50 value at 21 µM) prompted us to initiate a lead optimization campaign and a mechanistic study on the β-cell-protection of this novel class of compounds.
Figure 1. Structure and cell protective effect on INS-1 cells of compound 1.
CHEMISTRY
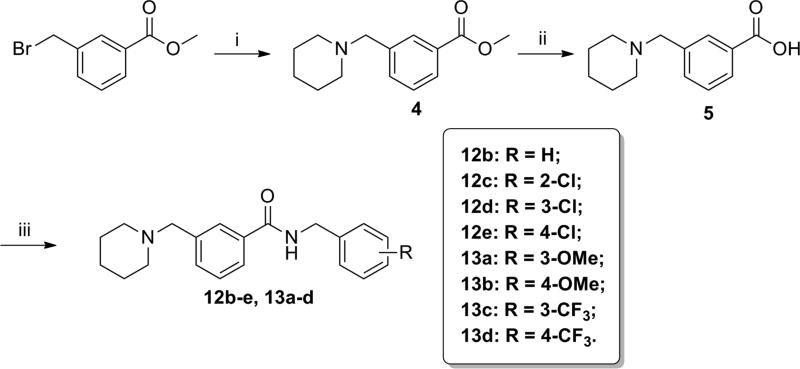
Synthetic routes for the preparation of the target compounds are summarized in Schemes 1–3. The 2-/3-/4-(N-piperidinyl)methyl benzoic acid methyl esters 6, 4, and 2, were synthesized from the corresponding bromomethylbenzoic acid methyl ester and piperidine. After a subsequent hydrolysis step with sodium hydroxide, the (N-piperidinyl)methyl substituted esters were converted to the key acid intermediates 7, 5, and 3. Finally, condensation of these carboxylic acids with a series of substituted benzylamines or phenylethylamines resulted in the desired compounds, 11a–d, 12a–h, and 13a–d.
Scheme 1.
Synthesis of 4-(N-piperidinyl)methyl benzamide derivatives.a aReagents and conditions: (i) piperidine, CH2Cl2, reflux, 75%; (ii) NaOH, MeOH/H2O, rt, 87%; (iii) benzylamines or phenylethylamines, HATU, DIEA, CH2Cl2, rt, 70–80%.
Scheme 3.
Synthesis of 2-(N-piperidinyl)methyl benzamide derivatives.a
aReagents and conditions: (i) piperidine, K2CO3, THF, rt, 76%; (ii) NaOH, MeOH/H2O, rt, 89%; (iii) 4-chlorobenzylamine, HATU, DIEA, CH2Cl2, rt, 73%.
Results and Discussion
A structure-activity-relationship (SAR) study was conducted to improve the weak potency of lead compound 1. Newly synthesized or commercially available compounds were tested for their β-cell-protective activity against ER stress in rat INS-1 β-cells. Treatment of INS-1 β-cells with tunicamycin (Tm), a potent ER stress inducer that inhibits N-linked glycosylation of proteins and causes the accumulation of misfolded proteins, significantly reduced cell viability at 72 h compared with DMSO-treated cells, as measured by an intracellular ATP level-based cell viability assay (Figure 1A). The maximum activities and the concentrations that reach half-maximal activity (EC50) of the compounds were evaluated by the degree of increase in viability of INS-1 cells co-treated with the compounds in the presence of Tm compared with Tm treatment alone. Our initial focus was to explore the right phenyl ring of 1 while keeping the left dihydrobenzodioxine ring intact (Table 1). While removal of the 3-chloro group in the right phenyl ring of 1 (8a) did not markedly affect the EC50 values and maximum activity levels of the resultant compound, the introduction of a methoxy group, such as 2-methoxy (8b), 4-methoxy (8e), and 3,4-dimethoxy (8f), led to less potency in that an increase in the EC50 values and reduction in the maximum activity were observed compared to the parent compound 1. However, replacement with 4-fluorine (8c) and 4-chlorine (8d) on the position 4 in the right phenyl ring appeared to improve the maximum activity levels of these compounds (42% for 1 to 50% for 8c and 51% for 8d) with a similar EC50 values.
Figure 1.
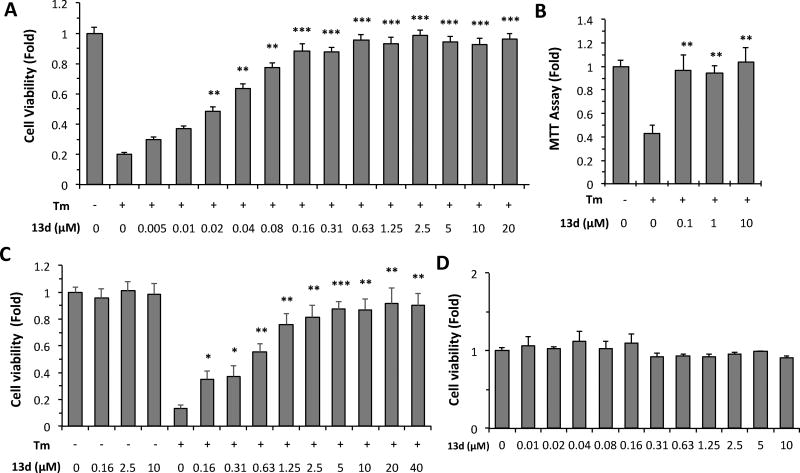
Protective effects of 13d on the viability of INS-1 cells after Tm treatment. (A, B) INS-1 cells were treated with or without Tm (0.1 µg/mL) in the presence of 13d or DMSO for 72 h. Cell viability was determined by intracellular ATP assay (A) or MTT assay (B). (C) βTC6 cells were treated with or without Tm (0.3 µg/mL) in the presence of 13d or DMSO for 72 h. The cell viability was determined by the intracellular ATP level. (D) INS-1 cells were treated with 13d or DMSO for 72 h. The cell viability was determined by the intracellular ATP level. Results in A-C are expressed as the fold change compared with that of no Tm treatment (set to 1.0). The result in D is expressed as the fold-change compared to no 13d treatment (set to 1.0). Results in all panels are the means of 3 replicate wells and are representative of 3 independent experiments. Error bars indicate standard deviation (SD). * P < 0.05, ** P < 0.01, and *** P < 0.001 compared with Tm treated alone.
Table 1.
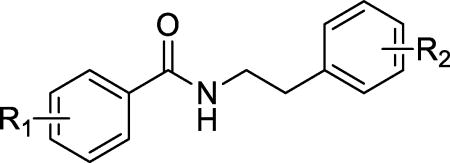
Activity of N-benzylbenzamide derivatives 8a–8h on the survival of INS-1 cells treated with Tm.a
| ||||
|---|---|---|---|---|
|
| ||||
| Compd | R1 | R2 | Maximum activity (% rescue)a |
EC50 (µM)b |
| 1 |

|
3-Cl | 42% ± 12% | 21 ± 5.7 |
| 8a |

|
H | 47% ± 9% | 19 ± 6.9 |
| 8b |

|
2-OMe | 29% ± 6% | >30 |
| 8c |

|
4-F | 50% ± 11% | 21 ± 3.2 |
| 8d |

|
4-Cl | 51% ± 17% | 15 ± 1.6 |
| 8e |

|
4-OMe | 26% ± 8% | >30 |
| 8f |

|
3,4-Di-OMe | 5% ± 7% | >30 |
| 8g |
|
3-Cl | 41% ± 14% | 25 ± 5.2 |
| 8h | 3,4-Di-OMe | 3-Cl | 46% ± 17% | 24 ± 2.1 |
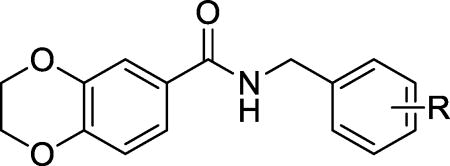
We then investigated the consequence of modifying the middle linker region, with the ethylene linker shortened to a methylene linker. We found that the methylene derivatives with modifications at position 2 (2-chlorine (9a) and 2-bromo (9b)) exhibited similar activity to that of hit compound 1. However, the methylene derivatives with modifications at positions 3 and 4, such as 3-chlorine (9c), 3-bromo (9d), 4-chlorine (9e), and 3,4-di-chlorine (9f), exhibited significantly improved EC50 values and maximum activity compared to the ethylene linker derivatives (Table 2 vs. Table 1). Of note, compound 9e improved its EC50 value over its ethylene counterpart 8d by almost 6-fold (EC50 2.8 µM for 9e vs. 15 µM for 8d) and the maximum activity (69% for 9e vs. 51% for 8d). Thus, the methylene group appeared to be a preferable linker.
Table 2.
Activity of N-benzylbenzamide derivatives 9a–9f on the survival of INS-1 cells treated with Tm.
| |||
|---|---|---|---|
|
| |||
| Compd | R | Maximum activity (% rescue) |
EC50(µM) |
| 9a | 2-Cl | 43% ± 12% | 25 ± 6.9 |
| 9b | 2-Br | 38% ± 14% | 25 ± 2.1 |
| 9c | 3-Cl | 57% ± 11% | 9.5 ± 1.2 |
| 9d | 3-Br | 69% ± 9% | 5.5 ± 0.7 |
| 9e | 4-Cl | 69% ± 12% | 2.8 ± 0.5 |
| 9f | 3,4-Di-Cl | 68% ± 10% | 3.6 ± 0.9 |
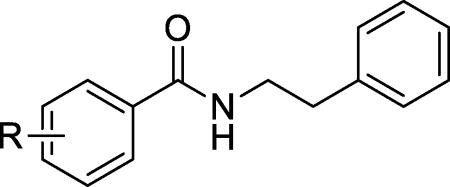
Next, we shifted our SAR study to the left phenyl ring. Since removal of the 3-chloro group on the right ring did not affect the potency (8a vs. 1), we kept the right phenyl ring unsubstituted. The resulting compounds with various substituents at the left phenyl ring are listed in Table 3. Most derivatives exhibited similar or reduced maximum activity or EC50 values compared with the dihydrobenzodioxine derivative 8a. However, the 4-(N-piperidinyl)methyl group derivative (10l) exhibited significantly improved maximum activity (87% for 10l vs. 47% for 8a) and a similar EC50 value (21 µM for 10l vs. 19 µM for 8a). In contrast, introduction of a 4-(N-pyrrolidinyl)methyl group (10k) resulted in a reduced maximum activity (31%). Taken together, these results demonstrate that the 4-(N-piperidinyl)methyl group rendered favorable activity to the scaffold.
Table 3.
Activity of N-phenethylbenzamide derivatives 10a–10p on the survival of INS-1 cells treated with Tm.
| |||
|---|---|---|---|
|
| |||
| Compd | R | Maximum activity (% rescue) |
EC50 (µM) |
| 10a | 2-Me | 6% ± 5% | - |
| 10b | 2-S-iPr | 30% ± 8% | >30 |
| 10c | 3-F | <0 | - |
| 10d | 3-NO2 | <0 | - |
| 10e | 3-NH2 | <0 | - |
| 10f | 3-OEt | 49% ± 11% | 26 ± 4.5 |
| 10g | 3-NHSO2Me | 24% ± 8% | 25 ± 2.1 |
| 10h | 4-Me | 25% ± 5% | 20 ± 5.4 |
| 10i | 4-O-propargyl | 54% ± 8% | >30 |
| 10j | 4SO2-NMe2 | 37% ± 6% | 19 ± 2.1 |
| 10k | 4-(N-pyrrolidinyl)methyl | 31% ± 7% | 11 ± 1.9 |
| 10l | 4-(N-piperidinyl)methyl | 87% ± 9% | 21 ± 3.5 |
| 10m | 3,4-Di-Cl | 42% ± 11% | 17 ± 6.1 |
| 10n | 3-Me-4-OMe | 56% ± 8% | 15 ± 3.2 |
| 10o | 2,3,4-trifluoro | 23% ± 6% | 9.9 ± 2.1 |
| 10p | 2,3,4,5-tetrafluoro | <0 | - |
As we observed more favorable activity of the methylene middle linker than ethylene derivatives in compounds with dihydrobenzodioxine ring for the left phenyl moiety, we investigated whether methylene middle linker exhibits similar advantage in the 4-(N-piperidinyl)methyl background. As summarized in Table 4, all the derivatives (11a–11d) exhibited significant maximum activity levels (all greater than 70%) regardless of the middle linker region. However, the derivatives with methylene middle linker exhibited significant improvements on the EC50 values over the ethylene derivatives (11c vs. 11a and 11d vs. 11b). In particular, the EC50 value of methylene derivative with 3,4-di-chlorine substitution in the right phenyl ring (11d) improved by 13-fold compared to that of the corresponding ethylene derivative 11b (EC50 1.8 µM for 11d vs. 24 µM for 11b). These results indicate that the combination of the 4-(N-piperidinyl)methyl moiety in the left phenyl ring and the methylene middle linker confers the compound favorable activity on β-cell protection.
Table 4.
Activity of 4-(N-piperidinyl)methyl benzamide derivatives 10l, 11a–11d on the survival of INS-1 cells treated with Tm.

| ||||
|---|---|---|---|---|
|
| ||||
| Compd | n | R | Maximum activity (% rescue) |
EC50 (µM) |
| 10l | 2 | H | 87% ± 6% | 21 ± 3.5 |
| 11a | 2 | 4-Cl | 82% ± 10% | 21 ± 4.2 |
| 11b | 2 | 3,4-Di-Cl | 71% ± 11% | 24 ± 2.7 |
| 11c | 1 | 4-Cl | 77% ± 7% | 9.5 ± 1.1 |
| 11d | 1 | 3,4-Di-Cl | 78% ± 10% | 1.8 ± 0.2 |
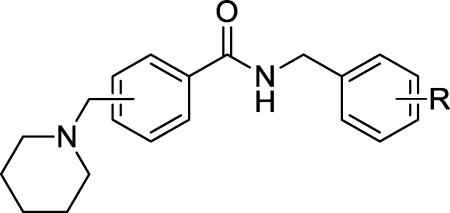
We next investigated whether the position of (N-piperidinyl)methyl group in the left phenyl ring affects β-cell-protective activity while keeping the methylene middle linker. A series of derivatives (12a–12h, 13a–13d) were subsequently synthesized and these are summarized in Table 5. Clearly, substitution of (N-piperidinyl)methyl group at position 3 (12b–12e) showed significant improvements over positions 2 and 4 (12a, and 12f–12h) in both maximum activity and EC50 values. Furthermore, we noticed that among the 3-(N-piperidinyl)methyl derivatives (12c–12e), substitutions with chlorine at meta and para positions in the right-hand phenyl ring (12d and 12e) improved the EC50s over the ortho-substituted derivative 12c. We finally examined whether the electron status in the right phenyl ring influences the potency on the 3-(N-piperidinyl)methyl derivatives. We therefore substituted the compounds with the electron-donating group -OMe (13a and 13b) and the electron-withdrawing group -CF3 (13c and 13d) at the meta- and para- positions on the right-hand phenyl ring. The electron-withdrawing groups, -CF3 (13c and 13d) and -Cl (12d and 12e) at the meta- and para- positions significantly exhibited more favorable EC50s compared to their electron-donating group (-OMe) counterparts (13a and 13b). In particular, the compound with the substitution of the strong electron-withdrawing CF3 in the paraposition (13d) exhibited the most potent property with a near 100% maximum activity and an EC50 at 0.032 µM. We therefore chose 13d for further characterization of its mechanism of action in promoting β-cell survival and function against ER stress.
Table 5.
Activity of (N-piperidinyl)methyl benzamide derivatives 12a–12h, 13a–d on the survival of INS-1 cells treated with Tm.
| ||||
|---|---|---|---|---|
|
| ||||
| Compd | Substitution position of (N-piperidinyl)methyl |
R | Maximum activity (% rescue) |
EC50 (µM) |
| 12a | 2 | 4-Cl | 73% ± 13% | 6.9 ± 1.2 |
| 12b | 3 | H | 95% ± 8% | 0.35 ± 0.06 |
| 12c | 3 | 2-Cl | 93% ± 7% | 2.04 ± 0.18 |
| 12d | 3 | 3-Cl | 90% ± 11% | 0.41 ± 0.06 |
| 12e | 3 | 4-Cl | 93% ± 13% | 0.24 ± 0.06 |
| 12f | 4 | 2-Cl | 87% ± 15% | 13 ± 1.6 |
| 12g | 4 | 3-Cl | 80% ± 9% | 2.2 ± 0.3 |
| 12h | 4 | 3-Br | 81% ± 12% | 4.9 ± 0.7 |
| 13a | 3 | 3-OMe | 92% ± 10% | 0.96 ± 0.16 |
| 13b | 3 | 4-OMe | 93% ± 5% | 1.12 ± 0.21 |
| 13c | 3 | 3-CF3 | 91% ± 14% | 0.25 ± 0.04 |
| 13d | 3 | 4-CF3 | 97% ± 8% | 0.03 ± 0.01 |
In the above SAR studies, we used the measurement of the intracellular ATP level as a surrogate assay for cell viability. We observed that compound 13d rescued the viability of INS-1 β-cells under Tm treatment in a dose-dependent manner and that 13d retained maximum β-cell-protective activity within a wide range of concentrations from 0.16~20 µM (Figure 1A). To confirm the authenticity of 13d’s protective effect on β-cell viability (not simply an increase in ATP-specific measurement), we used the MTT assay, which measures the activity of NAD(P)H-dependent cellular oxidoreductase enzymes, as an orthogonal method to measure cell viability. As shown in Figure 1B, Tm treatment reduced MTT reading in INS-1 cells compared to that of DMSO treatment, and co-treatment with 13d restored the viability of INS-1 cells. To determine whether the protective effect of 13d on b-cells is specific to INS-1 cells, another β-cell line, bTC6, was used. As expected, Tm induced a reduction in viability in βTC6 cells, and co-treatment with 13d rescued the viability of βTC6 cells in a dose-dependent manner, as assessed by the intracellular ATP level (Figure 1C). In addition, compound 13d on its own had no effect on β-cell viability in both cell lines (Figure 1C, 1D). Taken together, these results indicate that compound 13d protects β-cells against ER stress.
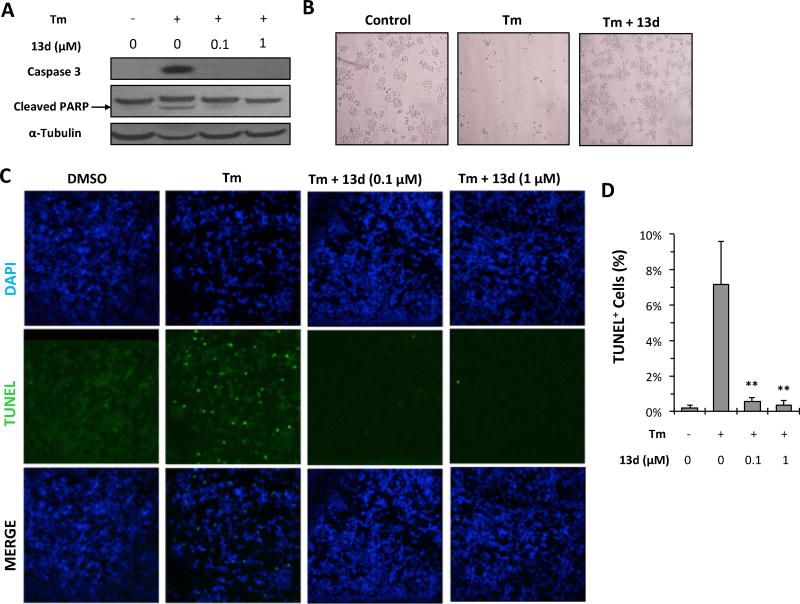
To determine whether the increase in β-cell viability following treatment with 13d is caused by a suppression of apoptotic cell death, several apoptosis-related makers were measured. First, levels of cleaved caspase-3 and cleaved PARP were assayed by Western blotting. Caspase-3, a member of executioner caspases activated by cleavage, plays essential roles in initiating apoptotic signaling and executing the final stages of cell death, whereas the nuclear enzyme poly (ADP-ribose) polymerase (PARP) plays an important role in a number of cellular processes involving DNA repair and cell death. Under normal condition, caspase 3 exists as inactive proenzyme. However, upon severe ER stress, caspase 3 undergoes proteolytic cleavage to produce two subunits that dimerize to form the active enzyme, which in turns cleaves PARP. Hence, appearance of the cleaved forms of both caspase-3 and PARP is an indication of apoptosis.23, 24 Tm treatment for 24 h significantly induced both cleaved caspase-3 and cleaved PARP protein levels in INS-1 cells (Figure 2A). However, 13d co-treatment completely or significantly diminished Tm-induced cleavage of both caspase-3 and PARP (Figure 2A). Consistent with this, significantly more viable INS-1 cells were observed with Tm and 13d co-treatment than with Tm alone (Figure 2B). A further assessment of apoptotic INS-1 cell death was performed using TUNEL assays to detect nuclear DNA fragmentation (a consequence of cell apoptosis) in situ. Tm treatment resulted in a significant increase in TUNEL-positive cells (7% TUNEL-positive cells compared to less than 0.2% in control group), while co-treatment with Tm and 13d remarkably reduced the TUNEL-positive cells (0.5%) (Figures 2C and 2D). Taken together, these results demonstrate that 13d can suppress Tm-induced β-cell apoptosis.
Figure 2.
Compound 13d protects INS-1 cells against Tm-induced apoptosis. (A) INS-1 cells were treated with or without Tm (0.1 µg/mL) in the presence of 13d at indicated concentrations or DMSO for 24 h. Cleaved caspase-3 and PARP were determined by Western blotting. α-Tubulin was used as a loading control. The data shown are representative of 3 independent experiments. (B) INS-1 cells were treated with or without Tm (0.1 µg/mL) in the presence of 13d (0.1 µM) or DMSO for 48 h, and live-cell phase-contrast images were acquired (magnification 10×). The images shown are representative of 3 independent experiments. (C) TUNEL staining of INS-1 cells. INS-1 cells were treated with 0.1 µg/mL of Tm with or without compound 13d for 24 h before TUNEL staining. DAPI was used as a nuclear marker. Magnification is 20×. The images shown are representative of 3 independent experiments. (D) Quantification of TUNEL staining from 20 fields of images. ** P < 0.01 compared with Tm treatment alone.
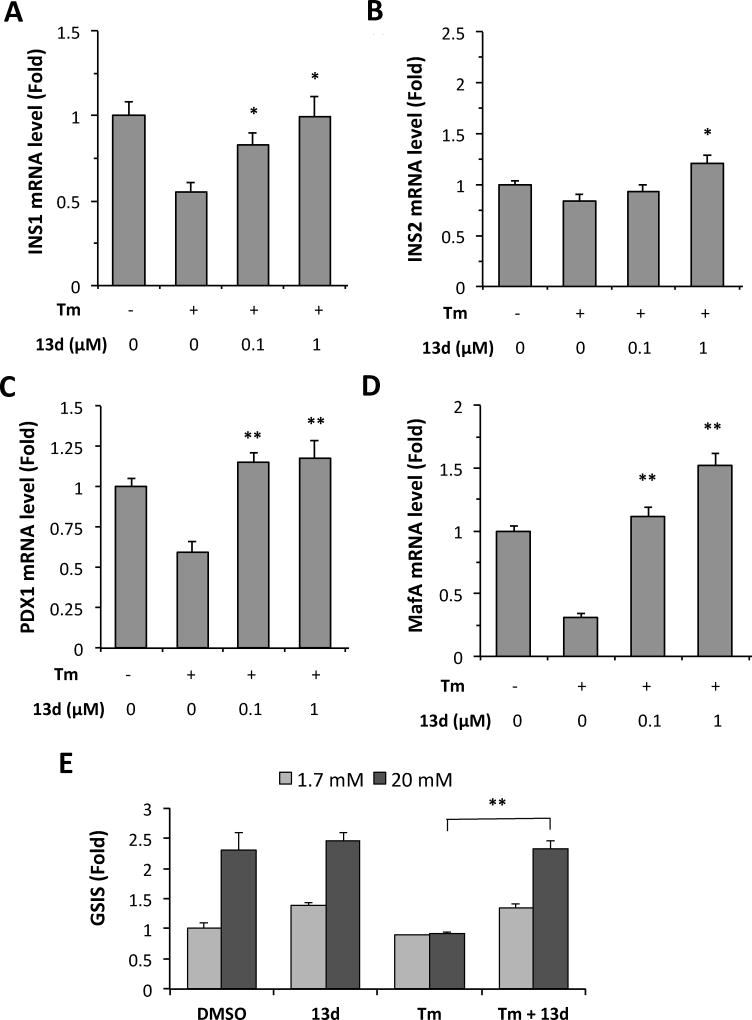
In addition to β-cell apoptosis, ER stress also leads to β-cell dysfunction, namely, the impairment of biosynthesis and secretion of insulin. First, we examined whether compound 13d reverses the Tm-suppressed mRNA levels of insulin genes. As expected, Tm treatment of INS-1 cells decreased the mRNA levels of both insulin genes, INS1 and INS2, but this reduction was completely rescued by 13d (Figures 3A and 3B). Second, we examined whether compound 13d affects the expression of β-cell transcription factors PDX1 and MafA, which control β-cell identity and the expression of insulin genes.25, 26 Tm treatment decreased the levels of PDX1 and MafA mRNA expression levels in INS-1 cells, however, these decreases were completely rescued by 13d co-treatment (Figures 3C and 3D). Next, we investigated whether compound 13d re-establishes Tm-impaired glucose-stimulated insulin secretion (GSIS). As shown in Figure 3E, Tm treatment abolished the insulin secretion caused by high concentration of glucose treatment (20 mM) in INS-1 cells. Addition of 13d significantly rescued the GSIS in Tm-treated cells. Taken together, these data demonstrate that 13d restores ER stress-impaired b-cell survival and function.
Figure 3.
Compound 13d reversed Tm-suppressed β-cell dysfunction. (A–D) INS-1 cells were treated with or without Tm (0.1 µg/mL) in the presence of 13d at indicated concentrations or DMSO for 24 h. The mRNA levels of INS1 (A), INS2 (B), PDX1 (C), and MafA (D), were analyzed by qRT-PCR. Relative mRNA levels were normalized against the housekeeping gene Cyclophilin A using the comparative CT method. The results are the means of 3 replicate wells and are representative of 3 independent experiments. * P < 0.05 and ** P < 0.01 compared with Tm treatment alone. Bars indicate SD. (E) Insulin secretion by INS-1 cells incubated with 1.7 mM and 20 mM glucose in the presence or absence of Tm (0.1 µg/mL) and 13d. Secreted insulin was measured by ELISA after 24 h treatment. * P < 0.05. The amount of insulin secreted in response to 1.7 mM glucose in the absence of Tm was set to 1.0 and was normalized with total protein concentration.
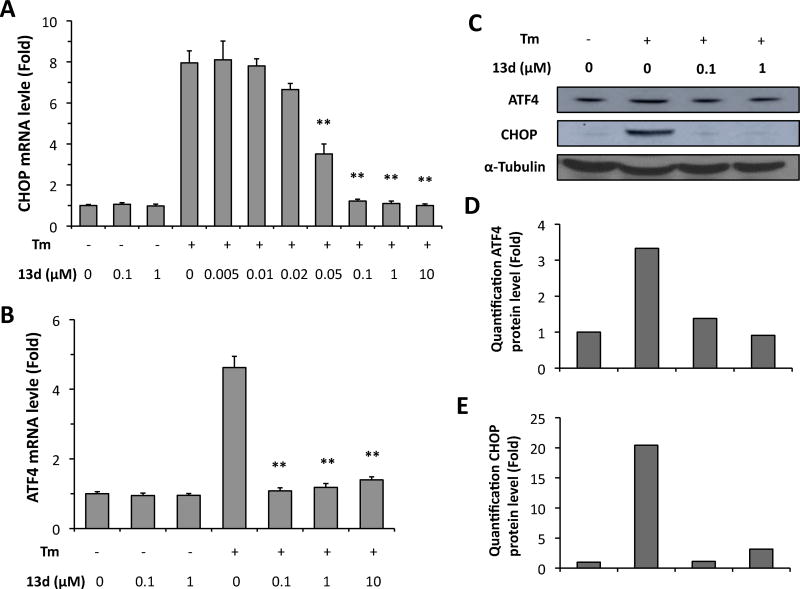
Having established that compound 13d restores ER stress-impaired b-cell survival and function, we next investigated the mechanism of action by which 13d protects β-cells against ER stress. Chronic or severe ER stress activates all three branches of the UPR, PERK, IRE1a, and ATF6, leading to eventual cell death. First, we determined the effect of 13d on the activation of the PERK pathway in β-cells under ER stress. PERK activation phosphorylates eukaryotic translation initiator factor 2α (eIF2α), which in turn allows for the up-regulation of activating transcription factor 4 (ATF4) and of the pro-apoptotic gene C/EBP-homologous protein (CHOP).4, 8, 11, 27 Thus, we used ATF4 and CHOP expression levels as markers of PERK pathway activation. Tm treatment of INS-1 cells significantly increased the mRNA levels of both ATF4 and CHOP, whereas co-treatment with 13d almost completely abolished the Tm-induced increase in both mRNA levels (Figures 4A and 4B). In addition, after treatment with Tm for 8 h, CHOP mRNA level increased 7-fold compared with the control group, and co-treatment with compound 13d inhibited Tm-induced CHOP expression with an IC50 value of 0.037 µM (Figure 4A). Moreover, this IC50 value was almost equal to the EC50 value of 13d for cell survival (Table 5). In addition, 13d had no effect on the mRNA levels of ATF4 and CHOP on its own (Figure 4A and 4B). Finally, consistent with the results on ATF4 and CHOP mRNA levels, 13d significantly suppressed Tm-induced increase in the protein levels of both ARF4 and CHOP (Figure 4C–E). These results indicate that 13d inhibits the activation of PERK-ATF4-CHOP pathway of the UPR under ER stress.
Figure 4.
Compound 13d inhibits Tm-induced ATF4 and CHOP up-regulation in INS-1 cells. (A, B) INS-1 cells were treated with or without Tm (0.1 µg/mL) in the presence of 13d or DMSO for 8 h. ATF4 (A) and CHOP (B) mRNA levels were analyzed by qRT-PCR. Relative mRNA levels were normalized against the housekeeping gene Cyclophilin A using the comparative CT method. The results were expressed as the fold-increase over mRNA levels in untreated control cells and are the means of 3 replicate wells and representative of 3 independent experiments. ** P < 0.01 compared with Tm treatment alone. Bar indicates SD. (C–E) INS-1 cells were treated with or without Tm (0.1 µg/mL) in the presence of 13d or DMSO for 8 hATF4 and CHOP protein levels were determined by Western bloting (C). α-Tubulin was used as an internal control. Quantification of ATF4 (D) and CHOP (E) protein levels was analyzed by ImageJ program, which was normalized by α-Tubulin protein level. The data shown are representative of 3 independent experiments.
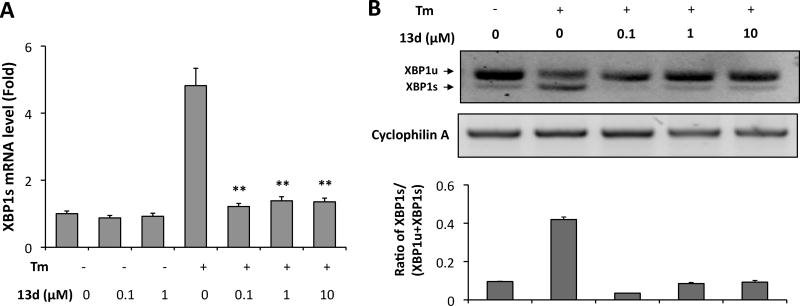
Next, we determined the effect of 13d on the activation of IRE1α in β-cells under ER stress. Activation of the IRE1α leads to cleavage of X-box binding protein-1 (XBP1) mRNA and this generates a spliced form (XBP1s) that is translated into a potent transcription factor that controls the expression of UPR genes involved in ER protein folding and degradation.6, 12, 27 We therefore used XBP1 splicing as a marker for the activation of the IRE1α pathway and determined the effect of 13d on IRE1α-mediated XBP1 splicing in INS-1 cells in the presence of Tm. As shown in Figure 5A, Tm markedly increased the level of XBP1s mRNA in INS-1 cells, but this increase was abolished by 13d co-treatment, as measured by qRT-PCT using XBP1 splicing-specific primers. Similarly, an electrophoretic separation of spliced and unspliced forms of XBP1 after RT-PCR amplification of total XBP1 mRNA revealed that 13d inhibits the Tm-induced generation of XBP1s mRNA (Figure 5B). These results indicate that 13d inhibits Tm-induced activation of IRE1a-XBP1 pathway.
Figure 5.
Compound 13d inhibits Tm-induced XBP1s mRNA expression in INS-1 cells. INS-1 cells were treated with or without Tm (0.1 µg/mL) in the presence of 13d or DMSO for 8 h. (A) XBP1s mRNA levels were analyzed by qRT-PCR. Relative mRNA levels were normalized against the housekeeping gene Cyclophilin A using the comparative CT method. ** P < 0.01 compared with Tm treatment alone. Bars indicate SD. (B) XBP1 mRNA levels were analyzed by RT-PCR and the products were resolved by agarose gel electrophoresis. The full-length (unspliced, XBP1u) and spliced (XBP1s) forms of XBP1 mRNA are indicated. Cyclophilin A mRNA was used as a loading control. Quantification was analyzed by ImageJ program shown at the bottom. The data shown are representative of 3 independent experiments.
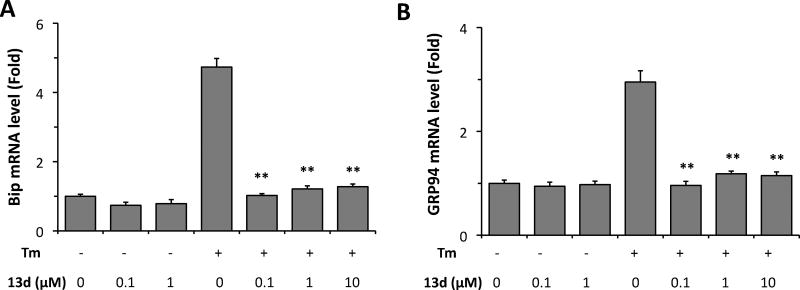
We then investigated the effects of 13d on the activation of ATF6 in β-cells under ER stress. Activated ATF6 acts as a homodimer or as an ATF6–XBP1s heterodimer to control the up-regulation of select UPR target genes including the chaperone proteins BiP and GRP94.12, 27 Therefore, these two chaperone proteins were evaluated in the INS-1 cells in the presence of Tm. Both Bip and GRP94 mRNAs were up-regulated by treatment with Tm, while co-treatment with Tm and compound 13d almost completely reversed these increases (Figure 6A and 6B).
Figure 6.
Compound 13d decreases Bip and GRP94 mRNA levels induced by Tm. INS-1 cells were treated with or without Tm (0.1 µg/mL) in the presence of 13d or DMSO for 8 h. Bip (A) and GRP94 (B) mRNA levels were analyzed by qRT-PCR. Relative mRNA levels were normalized against the housekeeping gene Cyclophilin A using the comparative CT method. The results are the means of 3 replicate wells and representative of 3 independent experiments. ** P < 0.01 compared with Tm treatment alone. Error bars indicate SD.
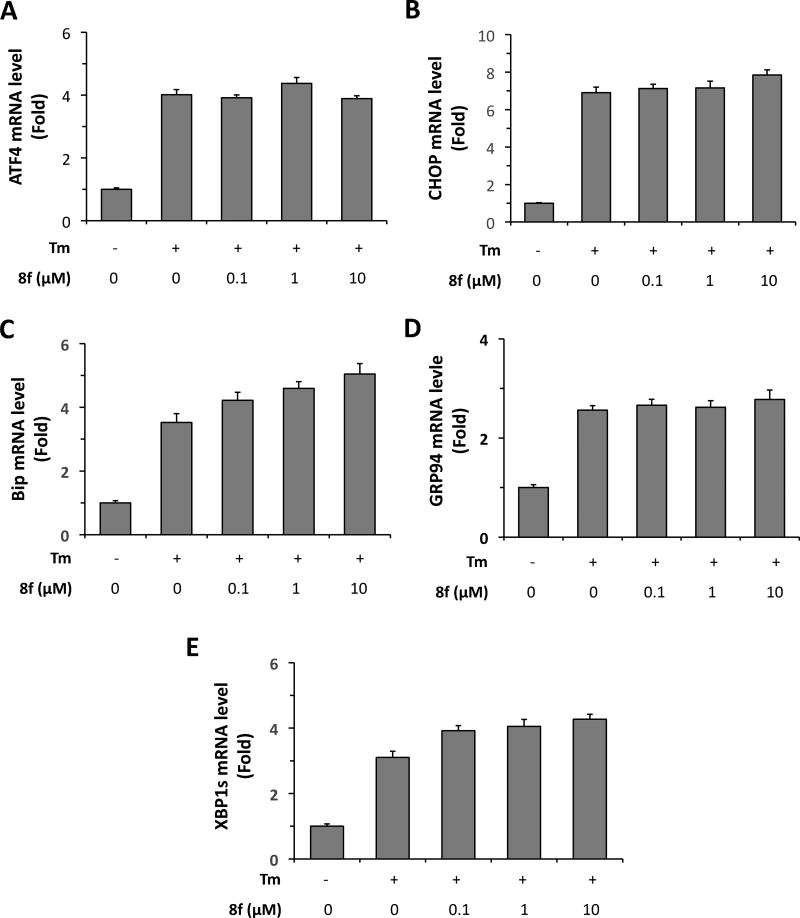
Thus far, our observations that 13d protected β-cells against ER stress-induced cell death and dysfunction and that 13d inhibited ER stress-mediated activation of all three UPR pathways revealed a strong correlation between the β-cell protective effect of 13d and its suppression of ER stress response. If 13d protects β-cells through the inhibition of ER stress response, a structurally similar but β-cell-inactive analog of 13d would be expected to possess no inhibitory effect on ER stress-induced UPR response. Indeed, we observed that as a negative control, the β-cell-inactive analog 8f had no effect on the UPR pathways. As shown in Figure 7, 8f co-treatment had no obvious effect on the mRNA levels of ATF4, CHOP, Bip, GRP94 or XBP1s. These results together support the notion that 13d protects β-cell survival by alleviating ER stress.
Figure 7.
Inactive compound 8f does not decrease ER stress related mRNA levels induced by Tm. INS-1 cells were treated with or without Tm (0.1 µg/mL) in the presence of 8f or DMSO for 8 h. ATF4 (A), CHOP (B), Bip (C), GRP94 (D), and XBP1s (E) mRNA levels were analyzed by qRT-PCR. Relative mRNA levels were normalized against the housekeeping gene Cyclophilin A using the comparative CT method. The results are the means of 3 replicate wells and representative of 3 independent experiments. Error bars indicate SD.
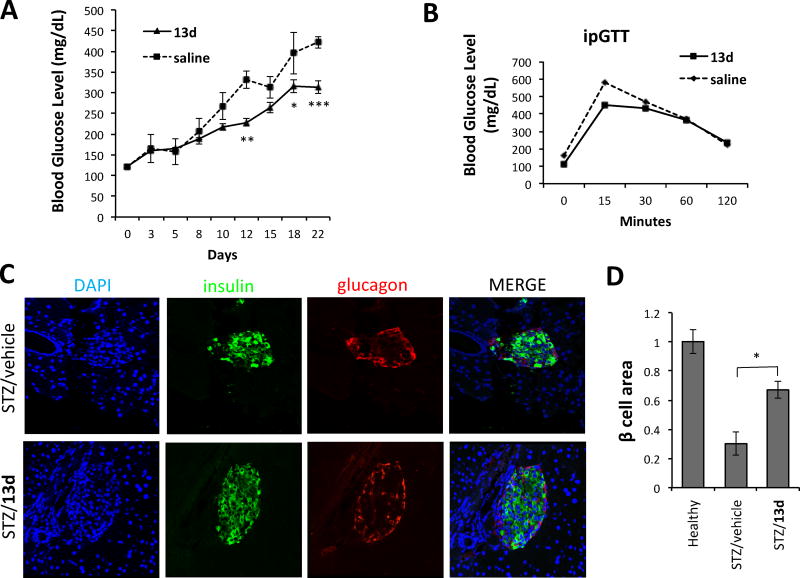
We finally evaluated the in vivo efficacy of 13d using a streptozotocin (STZ)-induced diabetic mouse model. STZ induces ER stress in b-cells in addition to the increase in reactive oxygen species (ROS) production and DNA alkylation.28, 29 C57BL/6 mice injected intraperitoneally with low dose STZ (50 mg/kg) once daily for 5 consecutive days develop diabetes; blood glucose levels increased gradually within a week of STZ treatment. Co-treatment with 13d (5 mg/kg) lowered the glucose levels significantly in a time-dependent manner (314 mg/dL (13d) vs. 422 mg/dL (vehicle) after 3 weeks of treatment) (Figure 8A). The intraperitoneal glucose tolerance testing on overnight fasted animals showed lower blood glucose levels at 15, and 30 min in mice co-treated with STZ and 13d, compared to vehicle-treated STZ group (Figure 8B).
Figure 8.
Anti-diabetic effect of 13d in the STZ-induced diabetic mouse model. (A) Fasting blood glucose levels were measured in STZ-injected mice treated with vehicle control (n = 6) or 13d (n = 7). C57BL/6J mice were injected intraperitoneally once daily for 5 days with STZ (50 mg/kg body weight) and with either vehicle (n = 6 mice) or 13d (5 mg/kg body weight; n = 7 mice). Injections of vehicle or 13d alone were then continued for 2 more weeks. (B) Glucose tolerance test. Blood glucose levels measured at indicated time points after intraperitoneal injection of glucose (2g/kg body weight). (C) Pancreases were sectioned and slides were stained with anti-insulin antibody (green, b-cell marker), anti-glucagon antibody (red, a-cell marker), and DAPI (blue). Slides were imaged with an Olympus FV1000 confocal microscope. Representative images are shown in (C). (D) Quantification of total islet area per section and b-cell number per islet. Total area of all islets per section calculated for a total of six sections using insulin-positive cells to demarcate islets. Data are the means ± SEM of six sections from three mice. *p < 0.05 **p < 0.01, and ***p < 0.001 by Student’s t-test.
To evaluate whether 13d treatment influences the survival of b-cells in STZ animals, histology on pancreatic sections was analyzed. We observed that 13d-treated mice had more than double the total pancreatic islet b-cell area compared to vehicle-treated mice (67.4 ± 5.9% for STZ + 13d vs. 30.2 ± 7.9% for STZ + saline, Figures 8C and 8D). In addition, 13d had no obvious effect on the average number of a-cells between vehicle and 13d groups (Figure 8C). These results indicate that 13d ameliorates STZ-induced diabetes in mice by preserving b-cell survival.
Conclusion
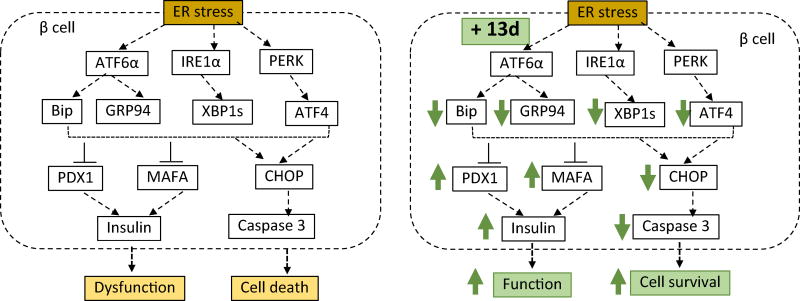
We discovered and optimized 3-(N-piperidinyl)methyl benzamide derivatives as potent agents that suppress ER stress-induced β-cell death and dysfunction. Our lead optimization has led to the identification of the 3-(N-piperidinyl)methyl benzamide analog 13d with near 100% β-cell-protective activity and an EC50 of 0.032 µM against ER stress. Importantly, we showed that 13d significantly lowers blood glucose levels and increases b-cell survival in an STZ-induced diabetic mouse model. In addition, we demonstrated that 13d alleviates ER stress/UPR response by inhibiting Tm-induced up-regulation of all three branches of unfolded protein response (UPR) and apoptosis. Figure 9 proposes a model of signaling events leading to the protective effect of 13d in β-cells against ER stress-induced dysfunction and cell death.
Figure 9.
Proposed model of signaling pathways involved in 13d-mediated β-cell-protective effects against ER stress. ER stress induces activation of three branches of UPR (ATF6, IRE1a, and PERK), leading to up-regulation of Bip, GRP4, XBP1s, ATF4, and CHOP. These events result in the reduction in the expression of PDX1, MAFA and insulin genes, leading to β-cell dysfunction, and the eventual activation of caspase 3 and cell apoptosis. Compound 13d protects β-cells against ER stress-mediated dysfunction and death by attenuating ER stress through up-regulating PDX1, MAFA and insulin genes and down-regulating ATF4, XBP1s, Bip, GRP94, CHOP, and caspase 3.
Our current work has unraveled compound 13d as a representative of a new β-cell-protective chemotype containing a 3-(N-piperidinyl)methyl benzamide skeleton with a near 100% maximum protection activity and an EC50 value of ~30 nM. Studies on the pharmacokinetic properties of 13d are ongoing as part of our program to develop novel chemotypes as β-cell-protective leads for further anti-diabetic drug development.
EXPERIMENTAL SECTION
1. Chemistry
The reagents were purchased and used without further purification. 1H NMR and 13C NMR spectra were recorded on a Bruker AC300 or a Bruker AC400 NMR spectrometer with tetramethylsilane as an internal reference. ESI-MS spectra were obtained on a Krats MS 80 mass spectrometer. Column chromatography was performed on silica gel (200−300 mesh). The purity of synthesized final compounds was determined by HPLC. Compounds 1, 8a–h, 9a–f, and 10a–p were purchased from ChemBridge. The structures and purities were confirmed using NMR and HPLC. The purities of all these compounds are more than 95%.
General procedure for compounds 3, 5 and 7. After the bromomethylbenzoic acid methyl ester (1 mmol) was dissolved in 4 mL of THF, piperidine (119 µL, 1.2 mmol) and K2CO3 (276 mg, 2 mmol) were added to the solution. The mixed solution was stirred at room temperature until the reaction was completed. The solution was poured into water (10 mL) and extracted with ethyl acetate (10 mL × 3). The combined organic layer was washed with brine, dried over anhydrous sodium sulfate, filtered, and concentrated to afford the desired (N-piperidinyl)methyl benzoic acid methyl esters 2, 4 and 6. The crude ester was added to a mixed solution of H2O (2 mL) and methanol (2 mL) with sodium hydroxide (60 mg, 1.5 mmol). The solution was stirred at room temperature overnight. After the methanol was evaporated under vacuum, the pH of the residue aqueous layer was adjusted to 5. The formed precipitate was filtered, washed with cold water, and dried under vacuum to afford the desired product. 4-(N-piperidinyl)methyl benzoic acid (3). The title compound was obtained as a white solid from 4-bromomethyl benzoic acid methyl ester in 65% yield.29
3-(N-piperidinyl)methyl benzoic acid (5) The title compound was obtained as a white solid from 3-bromomethyl benzoic acid methyl ester in 59% yield. 1H NMR (400 MHz, DMSO-d6): δ 10.78 (s, 1H), 8.17 (s, 1H), 8.01 (m, 2H), 7.59 (m, 1H), 4.35 (s, 2H), 3.32 (m, 2H), 3.17 (m, 2H), 2.53 (s, 2H), 1.80 (m, 6H).
2-(N-piperidinyl)methyl benzoic acid (7) The title compound was obtained as a white solid from 2-bromomethyl benzoic acid methyl ester in 68% yield. 1H NMR (400 MHz, CDCl3): δ 8.18 (dd, 1H, J = 6.0, 1.2 Hz), 7.46 (m, 1H), 7.40 (m, 1H), 7.15 (d, J = 6.0 Hz), 3.84 (s, 2H), 3.15 (m, 2H), 2.36 (m, 2H), 1.82 (m, 2H), 1.60 (m, 4H).
General procedure for compounds 11a–11f, 11i–11j, and 12a–12h. To a solution of compound 3, 5 or 7 (1 mmol) in anhydrous dichloromethane (5 mL), corresponding benzylamines or phenylethylamines (1.2 mmol), HATU (1.5 mmol), and DIEA (2mmol) were added. The mixed solution was stirred at room temperature. After the reaction was completed, H2O (5 mL) was added to the solution. The organic layer was separated and washed with brine, dried over anhydrous sodium sulfate, filtered, concentrated, and purified by flash column chromatography to afford the desired product.
(11a). The title compound was obtained as a solid from 3 and 4-chlorophenylethylamine according to the general procedure in 61% yield. 1H NMR (400 MHz, DMSO-d6): δ 8.53 (s, 1H), 7.89 (m, 2H), 7.42 (m, 2H), 7.35 (m, 2H), 7.26 (m, 2H), 3.48 (m, 4H), 2.84 (m, 2H), 2.43 (m, 2H), 1.54-1.24 (m, 8H). 13C NMR (100 MHz, DMSO-d6): δ 166.41, 139.07, 131.20, 131.03, 128.69, 127.61, 52.83, 34.80. LC-MS (ESI+): 357 (M + H)+.
(11b). The title compound was obtained as a solid from 3 and 3,4-dichlorophenylethylamine according to the general procedure in 81% yield. 1H NMR (400 MHz, DMSO-d6): δ 9.52 (br, 1H), 8.58 (m, 1H), 7.83 (m, 2H), 7.54 (m, 4H), 7.24 (m, 1H), 4.25 (s, 2H), 3.52 (m, 2H), 2.86 (m, 3H), 1.75-.163 (m, 7H). 13C NMR (100 MHz, DMSO-d6): δ 141.36, 131.25, 131.22, 130.80, 129.73, 129.16, 127.78, 34.38. LC-MS (ESI+): 391 (M + H)+.
(11c). The title compound was obtained as a solid from 3 and 4-chlorobenzylamine according to the general procedure in 78% yield. 1H NMR (400 MHz, DMSO-d6): δ 9.02 (br, 1H), 7.84 (m, 2H), 7.60 (m, 3H), 7.38 (m, 6H), 4.46 (s, 2H), 3.47 (m, 2H), 2.31 (m, 2H), 1.49-1.39 (m, 6H). 13C NMR (100 MHz, DMSO-d6): δ 166.61, 139.30, 131.72, 129.54, 129.03, 128.67, 127.62, 54.36, 42.44, 26.00, 23.89. LC-MS (ESI+): 343 (M + H)+.
(11d). The title compound was obtained as a solid from 3 and 3,4-dichlorobenzylamine according to the general procedure in 63% yield. 1H NMR (400 MHz, DMSO-d6): δ 9.78 (br, 1H), 9.23 (m, 1H), 7.97 (m, 2H), 7.60 (m, 3H), 7.32 (m, 1H), 4.48 (s, 2H), 4.33 (s, 2H), 2.90 (s, 2H), 1.78-1.24 (br, 6H). 13C NMR (100 MHz, DMSO-d6): δ 166.18, 141.32, 131.70, 131.33, 130.97, 129.79, 129.74, 128.14, 52.40, 42.21, 22.88, 21.71. LC-MS (ESI+): 379 (M + H)+.
(12a). The title compound was obtained as a solid from 7 and 4-chlorobenzylamine according to the general procedure in 78% yield. 1H NMR (400 MHz, DMSO-d6): δ 10.35 (br, 1H), 7.69 (m, 1H), 7.41-7.30 (m, 7H), 4.48 (d, 2H, J = 6.4 Hz), 3.46 (s, 2H), 2.21 (m, 4H), 1.29 (m, 6H). 13C NMR (100 MHz, DMSO-d6): δ 168.30, 139.01, 137.29, 132.10, 132.03, 130.21, 129.96, 128.82, 128.06, 61.51, 53.32, 42.74, 40.67, 40.46, 40.25, 40.04, 39.83, 39.62, 25.74, 24.19. LC-MS (ESI+): 343 (M + H)+.
(12b). The title compound was obtained as a solid from 5 and benzylamine according to the general procedure in 71% yield. 1H NMR (400 MHz, DMSO-d6): δ 9.15 (m, 1H), 7.99 (m, 2H), 7.63 (m, 1H), 7.56 (m, 1H), 7.47 (m, 1H), 7.38 (m, 1H), 7.30 (m, 2H), 4.56 (s, 2H), 4.16 (s, 2H), 2.93 (br, 4H), 1.67 (br, 4H), 1.48 (br, 2H). 13C NMR (100 MHz, DMSO-d6): δ 171.11, 144.77, 139.95, 133.85, 133.51, 132.50, 132.01, 58.72, 47.88, 28.12, 27.18. LC-MS (ESI+): 309 (M + H)+.
(12c). The title compound was obtained as a solid from 5 and 2-chlorobenzylamine according to the general procedure in 66% yield. 1H NMR (400 MHz, DMSO-d6): δ 9.15 (m, 1H), 7.99 (m, 2H), 7.63 (m, 1H), 7.56 (m, 1H), 7.47 (m, 1H), 7.38 (m, 1H), 7.30 (m, 2H), 4.56 (s, 2H), 4.16 (s, 2H), 2.93 (br, 4H), 1.67 (br, 4H), 1.48 (br, 2H). 13C NMR (100 MHz, DMSO-d6): δ 166.06, 136.21, 134.48, 131.96, 130.51, 130.43, 129.51, 129.13, 128.68, 128.64, 128.59, 127.54, 127.14, 78.82, 78.69, 52.32, 51.73, 40.09, 22.13. LC-MS (ESI+): 343 (M + H)+.
(12d). The title compound was obtained as a solid from 5 and 3-chlorobenzylamine according to the general procedure in 72% yield. 1H NMR (400 MHz, DMSO-d6): δ 10.10 (br, 1H), 9.32 (s, 1H), 8.00 (m, 2H), 7.68 (m, 1H), 7.57 (m, 1H), 7.37 (m, 4H), 4.51 (s, 2H), 4.35 (s, 2H), 3,32 (m, 2H), 2.89 (br, 4H), 1.68 (m, 5H), 1.35 (m, 1H). 13C NMR (100 MHz, DMSO-d6): δ 165.90, 142.11, 134.67, 134.10, 132.94, 130.53, 130.13, 130.02, 128.84, 127.11, 126.71, 125.98, 58.78, 51.78, 42.21, 22.31, 21.24. LC-MS (ESI+): 343 (M + H)+.
(12e). The title compound was obtained as a solid from 5 and 4-chlorobenzylamine according to the general procedure in 75% yield. 1H NMR (400 MHz, DMSO-d6): δ 9.11 (m, 1H), 7.88 (m, 2H), 7.63 (m, 1H), 7.51 (m, 2H), 7.39 (m, 4H), 4.47 (m, 2H), 3.37 (m, 2H), 2.66 (m, 2H), 1.58 (m, 6H), 1.25 (m, 2H). 13C NMR (100 MHz, DMSO-d6): δ 166.54, 139.16, 134.87, 131.80, 129.63, 128.89, 128.70, 52.73, 42.54, 39.40, 23.51, 22.54. LC-MS (ESI+): 343 (M + H)+.
(12f). The title compound was obtained as a solid from 3 and 2-chlorobenzylamine according to the general procedure in 72% yield. 1H NMR (400 MHz, DMSO-d6): δ 9.31 (br, 1H), 9.12 (m, 1H), 8.01 (m, 2H), 7.62 (m, 2H), 7.47 (m, 1H), 7.33 (m, 3H), 4.56 (m, 2H), 4,34 (s, 2H), 2.88 (m, 2H), 1.82 (m, 2H), 1.63 (m, 3H) 1.38 (m, 1H). 13C NMR (100 MHz, DMSO-d6): δ 166.24, 136.69, 132.50, 131.79, 129.66, 129.17, 129.13, 128.23, 127.64, 59.04, 52.46, 41.13, 22.86, 21.72. LC-MS (ESI+): 343 (M + H)+.
(12g). The title compound was obtained as a solid from 3 and 3-chlorobenzylamine according to the general procedure in 81% yield. 1H NMR (400 MHz, DMSO-d6): δ 9.05 (m, 1H), 7.85 (m, 2H), 7.41-7.27 (m, 6H), 4.47 (m, 2H), 3.40 (m, 2H), 2.33 (m, 4H), 1.40 (m, 6H). 13C NMR (100 MHz, DMSO-d6): δ 166.62, 142.83, 133.41, 130.65, 127.67, 127.50, 127.15, 126.38, 54.29, 42.60. LC-MS (ESI+): 343 (M + H)+.
(12h). The title compound was obtained as a solid from 3 and 3-bromobenzylamine according to the general procedure in 65% yield. 1H NMR (400 MHz, DMSO-d6): δ 9.04 (m, 1H), 7.84 (m, 2H), 7.50-7.29 (m, 6H), 4.46 (m, 2H), 3.46 (s, 2H), 2.31 (m, 4H), 1.50-1.38 (m, 6H). 13C NMR (100 MHz, DMSO-d6): δ 166.64, 143.13, 142.85, 133.16, 130.96, 130.41, 130.05, 129.02, 127.62, 126.79, 122.05, 62.88, 54.40, 42.55, 26.05, 24.44. LC-MS (ESI+): 389 (M + H)+.
(13a). The title compound was obtained as a solid from 5 and 3-methoxybenzylamine according to the general procedure in 72% yield. 1H NMR (400 MHz, CDCl3): δ 7.78 (m, 1H), 7.74 (m, 1H), 7.46 (m, 1H), 7.38 (m, 1H), 7.29 (m, 1H), 6.97 (m, 1H), 6.92 (m, 1H), 6.84 (m, 1H), 6.65 (s, 1H), 4.62 (d, 2H, J = 6.0 Hz), 3.81 (s, 3H), 3.60 (s, 2H), 3,49 (s, 2H), 2.49 (br, 4H), 1.55 (m, 3H), 1.37 (m, 1H). 13C NMR (100 MHz, DMSO-d6): δ 166.22, 159.24, 141.30, 134.20, 131.63, 129.30, 128.05, 127.70, 125.69, 119.37, 112.95, 111.97, 62.61, 54.91, 53.85, 42.53, 25.47, 23.93. LC-MS (ESI+): 339 (M + H)+.
(13b). The title compound was obtained as a solid from 5 and 4-methoxybenzylamine according to the general procedure in 68% yield. 1H NMR (400 MHz, DMSO-d6): δ 9.27 (br, 1H), 9.07 (m, 1H), 8.03 (d, 1H, J = 6.0 Hz), 7.97 (d, 1H, J = 6.0 Hz), 7.64 (d, 1H, J = 6.0 Hz), 7.58 (d, 1H, J = 6.0 Hz), 7.26 (m, 2H), 6.90 (m, 2H), 4.43 (d, 2H, J = 4.8 Hz), 4.33 (d, 2H, J = 3.6 Hz),3.46 (s, 3H), 3.32 (m, 2H), 2.89 (m, 2H), 1.68 (m, 2H), 1.63 (m, 3H), 1.35 (m, 1H). 13C NMR (100 MHz, DMSO-d6): δ 165.55, 158.22, 134.98, 134.02, 131.41, 130.67, 129.93, 128.79, 128.67, 127.87, 113.67, 58.86, 55.05, 51.91, 42.13, 22.38, 21.24. LC-MS (ESI+): 339 (M + H)+.
(13c). The title compound was obtained as a solid from 5 and 3-trifluoromethyl benzylamine according to the general procedure in 68% yield. 1H NMR (400 MHz, DMSO-d6): δ 9.13 (m, 1H), 7.79 (m, 2H), 7.66 (m, 4H), 7.44 (m, 2H), 4.56 (d, 2H, J = 4.4 Hz), 3.46 (s, 2H), 2.31 (br, 4H), 1.49 (m, 4H), 1.37 (m, 2H). 13C NMR (100 MHz, DMSO-d6): δ 166.40, 141.23, 139.02, 133.96, 131.77, 131.45, 129.37, 128.13, 127.63, 125.70, 123.76, 123.73, 123.51, 123.48, 62.61, 53.88, 42.24, 25.50, 23.96. LC-MS (ESI+): 377 (M + H)+.
(13d). The title compound was obtained as a solid from 5 and 4-trifluoromethyl benzylamine according to the general procedure in 74% yield. 1H NMR (400 MHz, DMSO-d6): δ 9.15 (m, 1H), 7.80 (m, 2H), 7.70 (m, 2H), 7.54 (m, 2H), 7.41 (m, 2H), 4.56 (s, 2H), 3.45 (s, 2H), 2.31 (br, 4H), 1.49 (m, 4H), 1.38 (m, 2H). 13C NMR (100 MHz, DMSO-d6): δ 166.35, 144.61, 139.00, 133.92, 131.78, 128.12, 127.87, 127.69, 125.73, 125.19, 125.17, 125.14, 125.10, 62.64, 53.89, 42.32, 35.49, 23.96. LC-MS (ESI+): 377 (M + H)+.
2. Cell culture
INS-1 cells were cultured in RPMI 1640 (Corning, NY, USA) supplemented with 10% FBS (Atlanta Biologicals, Norcross, GA), HEPES (10 mM, Life Technologies, CA, USA), sodium pyruvate (1 mM, Corning), 2-mercaptoethanol (50 µM, Sigma, St Louis, MO, USA) and antibiotics (100 UI/mL penicillin and 100 µg/mL streptomycin, Corning). βTC6 cells were cultured in DMEM (Corning) with 15% FBS, sodium pyruvate (1 mM, Corning), non-essential amino acids (1 mM, Thermo, IL, USA), GlutaMAX (1 mM, Life Technologies) and antibiotics (100 UI/mL penicillin and 100 µg/mL streptomycin). All cells were grown at 37 °C in a humidified 5% CO2 atmosphere.
3. Cell survival assay
INS-1 cells or βTC6 cells were seeded at 3 × 10³ cells/well in a 384-well plate and treated with compounds at the indicated concentrations. After 3 d treatment, the medium was aspirated and 20 µL/well of CellTiter-Glo reagent (Promega, WI, USA) was added for the detection of intracellular ATP levels. Cell viability was measured with an EnVision multilabel plate reader (PerkinElmer, MA, USA). Three replicate wells per condition were performed in each experiment and three independent experiments were performed.
4. RNA isolation, RT-PCR and qRT-PCR
INS-1 cells were seeded at 4 × 10⁵ cells/well in 6-well plates and treated with compounds for the indicated times. Total RNA was extracted using TRIzol reagent (Invitrogen, Carlsbad, CA) according to the manufacturer’s protocol, and 2 µg of total RNA was reverse transcribed using a Superscript kit (Invitrogen). Real-time PCR was performed in 96-well format using SYBR Select Master Mix (Applied Biosystems, Foster City, CA) with an ABI 7500 PCR system (Applied Biosystems). Relative mRNA levels were normalized against the housekeeping gene Cyclophilin A and were determined by DDCt calculated from the difference in DCt values between the target gene and Cyclophilin A with and without treatment, based on comparative CT (cycle threshold) method. Comparisons were performed by two-tailed paired Student’s t-test to obtain P values. Three replicate wells per condition were performed in each experiment and three independent experiments were performed. The primer sequences used were: Rat CHOP: F, 5’-GAAATCGAGCGCCTGACCAG-3’ and R, 5’-GGAGGTGATGCCAACAGTTCA-3’. Rat ATF4: F, 5’-TCCTGAACAGCGAAGTGTTG-3’ and R, 5’- GTGTCTGAGGCACTGACCAA-3’. Rat Bip: F, 5’-CTATTCCTGCGTCGGTGTATT-3’ and R, 5’-GGTTGGACGTGAGTTGGTTCT-3’. Rat GRP94: F, 5’- TCCCCCTTAATGTTTCCCGTG-3’ and R, 5’-TAGCCCTTCTTCAGAAGCCTC-3’. Rat XBP1s: F, 5’- CTGAGTCCGAATCAGGTGCAG-3’ and R, 5’- ATCCATGGGAAGATGTTCTGG-3’. Rat XBP1 for regular PCR (XBP1u and XBP1s): F, 5’-GCTTGTGATTGAGAACCAGG-3’, R, 5’-GAAAGGGAGGCTGGTAAGGAAC-3’. Rat Ins1: F, 5’- GTCCTCTGGGAGCCCAAG-3’ and R, 5’- ACAGAGCCTCCACCAGG-3’. Rat Ins2: F, 5’- ATCCTCTGGGAGCCCCGC-3’ and R, 5’- AGAGAGCTTCCACCAAG-3’. Rat PDX1: F, 5’-GAGGACCCGTACAGCCTACA-3’ and R, 5’- CGTTGTCCCGCTACTACGTT-3’. Rat MafA: F, 5’- AGCGGTCATATTTTCGCAAC-3’ and R, 5’- CTCTACAGGGAGCAGCGAAC-3’. Rat Cyclophilin A: F, 5’-GGTGACTTCACACGCCATAA-3’ and R, 5’-CTTCCCAAAGACCACATGCT-3’.
5. Western blotting
INS-1 cells were seeded in 60-mm dishes at 8 × 10⁵ cells/dish and treated for the indicated times. Cells were then washed with PBS and lysed with lysis buffer (Cell Signaling Technology, Danvers, MA) containing EDTA (Thermo, IL) and phosphatase inhibitors (Thermo). Aliquots of 20 µg total protein were separated on 7% SDS-PAGE gels (Life Technologies) and transferred to PVDF membranes (Life Technologies). The membranes were probed with primary antibodies followed by the appropriate HRP-conjugated secondary antibodies (goat anti-rabbit IgG and goat anti-mouse IgG, 1:3000; Santa Cruz Biotechnology, CA, USA). Blots were then developed. Three independent experiments were performed. The primary antibodies and dilutions used were: CHOP (1:1000, MA1-250, Thermo), ATF4 (1:1000, 10835-1-AP, ProteinTech Group, IL, USA), cleaved caspase 3 (1:1000, 9661, Cell Signaling Technology, MA, USA), PARP (1:1000, 9542L, Cell Signaling Technology), and α-tubulin (1:3000, SC-8035, Santa Cruz Biotechnology).
6. MTT assay
INS-1 cells or βTC6 cells were seeded at 3 × 10³ cells/well in a 384-well plate and treated with compounds at the indicated concentrations. After 3 d treatment, the medium was aspirated and 10 µl of MTT reagent (Cayman Chemical, MI, USA, prepared according to manufacturer’s instruction) to each well was added and mixed gently for one minute on an orbital shaker. The cells were then incubated for three hours at 37 °C in a CO2 incubator. After incubation, add 100 µl of crystal dissolving solution to each well, and incubate for 4 hours in a 37 °C CO2 incubator. Viability will be measured for the absorbance to each sample at 570 nm using EnVision multilabel plate reader (PerkinElmer, MA, USA). Three replicate wells per condition were performed in each experiment and three independent experiments were performed.
7. Glucose-stimulated insulin secretion
INS-1 or primary human islet cells were plated in 96-well plates. The second day, Tm and test compound were added and maintained for 24 h (INS-1) or 48 h (human islets). Cells were then incubated in fresh KRBH buffer (115 mM NaCl, 5 mM KCl, 24 mM NaHCO3, 2.5 mM CaCl2, 1 mM MgCl2, 10 mM HEPES, 2% w/v BSA, pH 7.4) containing 2.5 mM glucose for 1 h. Cells were incubated for an additional hour in KRBH buffer containing 2.5, 25 (for INS-1 cells), or 20 (for human islets) mM glucose. The secreted insulin was measured with insulin ELISA kits (for mouse insulin from Millipore and for human insulin from LifeTech). Cells were lysed with RIPA buffer (50 mM Tris HCl pH 7.4, 1% NP-40, 0.25% sodium deoxycholate, 150 mM NaCl), and total cellular protein was determined with a Bradford protein assay. The secreted insulin levels were corrected for total protein. Three replicate wells per condition were performed in each experiment and three independent experiments were performed.
8. Immunofluorescent and TUNEL Staining
Primary human islets were washed with PBS and fixed with 4% paraformaldehyde for 30 min. Fixed cells were then blocked in 5% normal donkey serum for 30 min. 50 islets per condition were used in each experiment and three independent experiments were performed. Polyclonal guinea pig anti-insulin (A0564, Dako, 1:500 dilution) was used as primary antibody. Donkey Cy3 anti-guinea pig IgG was used as the secondary antibody. TUNEL staining was performed with In Situ Cell Death Detection Kit-Fluorescein (Roche) according to the manufacturer’s instructions. DAPI was used for nuclear counter-staining. Images were taken with an Olympus FV1000 confocal microscope.
9. Animal study
All procedures involving animals were performed in accordance with the protocol approved by the University of Oklahoma Health Science Center Institutional Animal Care and Use Committee (IACUC). C57BL/6 mice were obtained from The Jackson Laboratory (Bar Harbor, Maine) and maintained on a 12 h light (6:00 AM-6:00 PM)-12 h dark (6:00 PM-6:00 AM) cycle at an ambient temperature of 21°C. Mice were given free access to water and food. All experiments were performed with age-matched male mice. Compounds were dosed approximately 3~4 hours before the initiation of the dark cycle (2~3 PM during the light cycle). For streptozotocin (STZ)-induced diabetic model, ten-week-old C57BL/6 mice were injected intraperitoneally (i.p.) once daily for five days with STZ (dissolved in Na-Citrate Buffer; 50 mg/kg) and either 13d (5 mg/kg body weight; 2 mg/ml in 10% DMSO in saline buffer; n = 7 mice) or vehicle (n = 6 mice). Injections of vehicle or 13d alone were then continued for 2 more weeks. Every third day, animals were fasted for 5 h and blood was obtained by tail snip. Blood glucose levels were measured using a glucometer (Nova Statstrip Xpress; Data Science International, St. Paul, MN). At the end of the treatment period, mice were sacrificed and the pancreases were removed, fixed in formalin, and paraffin-embedded. Tissue blocks were serially sectioned at intervals of 100 µm and 6 sections were stained with an anti-insulin antibody (A0564, 1:500 dilution; Dako), anti-glucagon antibody (G2654, 1:500 dilution; Sigma), and DAPI (0.5 µg/ml). Insulin-positive cells were used to demarcate islets, and the total islet area was measured with an Olympus FV1000 confocal microscopy and quantified with Image-J histogram software.
10. Statistical analysis
Data are presented as means ± SD unless specified. Comparisons were performed by two-tailed paired Student’s t-test. A P value of <0.05 was considered statistically significant.
Supplementary Material
Scheme 2.
Synthesis of 3-(N-piperidinyl)methyl benzamide derivatives.a
aReagents and conditions: (i) piperidine, CH2Cl2, reflux, 71%; (ii) NaOH, MeOH/H2O, rt, 83%; (iii) benzylamines or phenylethylamines, HATU, DIEA, CH2Cl2, rt, 75–85%.
Acknowledgments
This work was supported by Oklahoma Center for the Advancement of Science and Technology and National Institutes of Health (GM103636, DK108887) to W.W.
ABBREVIATIONS USED
- ER
endoplasmic reticulum
- UPR
unfolded protein response
- INS-1 cell
rat insulinoma cell line
- Tm
tunicamycin
- SAR
structure-activity relationship
- EC50
half maximal effective concentration
- THF
tetrahydrofuran
- DIEA
N,N-diisopropylethylamine
- RT-PCR
reverse transcription polymerase chain reaction
- TUNEL
Terminal deoxynucleotidyl transferase dUTP nick end labeling
- PARP
Poly(ADP-ribose) polymerase
- PERK
PKR-like ER kinase
- eIF2α
eukaryotic translation initiator factor 2α
- ATF4
activating transcription factor 4
- CHOP
C/EBP homologous protein
- XBP1
X-box binding protein 1
- ATF6
activating transcription factor 6
- FBS
fetal bovine serum
- PDX1
pancreatic and duodenal homeobox 1
- MafA
v-maf musculoaponeurotic fibrosarcoma oncogene family, protein A
- INS1
insulin 1
- INS2
insulin 2
Footnotes
The authors declare no competing financial interests.
The purities of the synthesized final compounds and molecular formula strings of compounds. This material is available free of charge via the Internet at http://pubs.acs.org.
References
- 1.Vetere A, Choudhary A, Burns SM, Wagner BK. Targeting the Pancreatic Beta-Cell to Treat Diabetes. Nat. Rev. Drug Discovery. 2014;13:278–289. doi: 10.1038/nrd4231. [DOI] [PubMed] [Google Scholar]
- 2.Donath MY, Halban PA. Decreased Beta-Cell Mass in Diabetes: Significance, Mechanisms and Therapeutic Implications. Diabetologia. 2004;47:581–589. doi: 10.1007/s00125-004-1336-4. [DOI] [PubMed] [Google Scholar]
- 3.Prentki M, Nolan CJ. Islet Beta Cell Failure in Type 2 Diabetes. J. Clin. Invest. 2006;116:1802–1812. doi: 10.1172/JCI29103. [DOI] [PMC free article] [PubMed] [Google Scholar]
- 4.Fonseca SG, Gromada J, Urano F. Endoplasmic Reticulum Stress and Pancreatic Beta-Cell Death. Trends Endocrinol. Metab.: TEM. 2011;22:266–274. doi: 10.1016/j.tem.2011.02.008. [DOI] [PMC free article] [PubMed] [Google Scholar]
- 5.Scheuner D, Kaufman RJ. The Unfolded Protein Response: A Pathway That Links Insulin Demand with Beta-Cell Failure and Diabetes. Endocr. Rev. 2008;29:317–333. doi: 10.1210/er.2007-0039. [DOI] [PMC free article] [PubMed] [Google Scholar]
- 6.Back SH, Kaufman RJ. Endoplasmic Reticulum Stress and Type 2 Diabetes. Annu. Rev. Biochem. 2012;81:767–793. doi: 10.1146/annurev-biochem-072909-095555. [DOI] [PMC free article] [PubMed] [Google Scholar]
- 7.Senft D, Ronai ZA. Upr, Autophagy, and Mitochondria Crosstalk Underlies the Er Stress Response. Trends Biochem. Sci. 2015;40:141–148. doi: 10.1016/j.tibs.2015.01.002. [DOI] [PMC free article] [PubMed] [Google Scholar]
- 8.Eizirik DL, Cardozo AK, Cnop M. The Role for Endoplasmic Reticulum Stress in Diabetes Mellitus. Endocr. Rev. 2008;29:42–61. doi: 10.1210/er.2007-0015. [DOI] [PubMed] [Google Scholar]
- 9.Tersey SA, Nishiki Y, Templin AT, Cabrera SM, Stull ND, Colvin SC, Evans-Molina C, Rickus JL, Maier B, Mirmira RG. Islet Beta-Cell Endoplasmic Reticulum Stress Precedes the Onset of Type 1 Diabetes in the Nonobese Diabetic Mouse Model. Diabetes. 2012;61:818–827. doi: 10.2337/db11-1293. [DOI] [PMC free article] [PubMed] [Google Scholar]
- 10.Engin F, Yermalovich A, Nguyen T, Hummasti S, Fu W, Eizirik DL, Mathis D, Hotamisligil GS. Restoration of the Unfolded Protein Response in Pancreatic Beta Cells Protects Mice against Type 1 Diabetes. Sci. Transl. Med. 2013;5:211ra156. doi: 10.1126/scitranslmed.3006534. [DOI] [PMC free article] [PubMed] [Google Scholar]
- 11.Papa FR. Endoplasmic Reticulum Stress, Pancreatic Beta-Cell Degeneration, and Diabetes. Cold Spring Harbor Perspect. Med. 2012;2:a007666. doi: 10.1101/cshperspect.a007666. [DOI] [PMC free article] [PubMed] [Google Scholar]
- 12.Hetz C, Chevet E, Harding HP. Targeting the Unfolded Protein Response in Disease. Nat. Rev. Drug Discovery. 2013;12:703–719. doi: 10.1038/nrd3976. [DOI] [PubMed] [Google Scholar]
- 13.Bertolotti A, Zhang Y, Hendershot LM, Harding HP, Ron D. Dynamic Interaction of Bip and Er Stress Transducers in the Unfolded-Protein Response. Nat. Cell Biol. 2000;2:326–332. doi: 10.1038/35014014. [DOI] [PubMed] [Google Scholar]
- 14.Schroder M, Kaufman RJ. Er Stress and the Unfolded Protein Response. Mutat. Res. 2005;569:29–63. doi: 10.1016/j.mrfmmm.2004.06.056. [DOI] [PubMed] [Google Scholar]
- 15.Walter P, Ron D. The Unfolded Protein Response: From Stress Pathway to Homeostatic Regulation. Science. 2011;334:1081–1086. doi: 10.1126/science.1209038. [DOI] [PubMed] [Google Scholar]
- 16.Tabas I, Ron D. Integrating the Mechanisms of Apoptosis Induced by Endoplasmic Reticulum Stress. Nat. Cell Biol. 2011;13:184–190. doi: 10.1038/ncb0311-184. [DOI] [PMC free article] [PubMed] [Google Scholar]
- 17.Duan H, Lee JW, Moon SW, Arora D, Li Y, Lim HY, Wang W. Discovery, Synthesis, and Evaluation of 2,4-Diaminoquinazolines as a Novel Class of Pancreatic Beta-Cell-Protective Agents against Endoplasmic Reticulum (Er) Stress. J. Med. Chem. 2016;59:7783–7800. doi: 10.1021/acs.jmedchem.6b00041. [DOI] [PMC free article] [PubMed] [Google Scholar]
- 18.Tran K, Li Y, Duan H, Arora D, Lim HY, Wang W. Identification of Small Molecules That Protect Pancreatic Beta Cells against Endoplasmic Reticulum Stress-Induced Cell Death. ACS Chem. Biol. 2014;9:2796–2806. doi: 10.1021/cb500740d. [DOI] [PMC free article] [PubMed] [Google Scholar]
- 19.Van Lommel L, Janssens K, Quintens R, Tsukamoto K, Vander Mierde D, Lemaire K, Denef C, Jonas JC, Martens G, Pipeleers D, Schuit FC. Probe-Independent and Direct Quantification of Insulin Mrna and Growth Hormone Mrna in Enriched Cell Preparations. Diabetes. 2006;55:3214–3220. doi: 10.2337/db06-0774. [DOI] [PubMed] [Google Scholar]
- 20.Schuit FC, In't Veld PA, Pipeleers DG. Glucose Stimulates Proinsulin Biosynthesis by a Dose-Dependent Recruitment of Pancreatic Beta Cells. Proc. Natl. Acad. Sci. U. S. A. 1988;85:3865–3869. doi: 10.1073/pnas.85.11.3865. [DOI] [PMC free article] [PubMed] [Google Scholar]
- 21.Ladriere L, Igoillo-Esteve M, Cunha DA, Brion JP, Bugliani M, Marchetti P, Eizirik DL, Cnop M. Enhanced Signaling Downstream of Ribonucleic Acid-Activated Protein Kinase-Like Endoplasmic Reticulum Kinase Potentiates Lipotoxic Endoplasmic Reticulum Stress in Human Islets. J. Clin. Endocrinol. Metab. 2010;95:1442–1449. doi: 10.1210/jc.2009-2322. [DOI] [PubMed] [Google Scholar]
- 22.Cnop M, Ladriere L, Hekerman P, Ortis F, Cardozo AK, Dogusan Z, Flamez D, Boyce M, Yuan J, Eizirik DL. Selective Inhibition of Eukaryotic Translation Initiation Factor 2 Alpha Dephosphorylation Potentiates Fatty Acid-Induced Endoplasmic Reticulum Stress and Causes Pancreatic Beta-Cell Dysfunction and Apoptosis. J. Biol. Chem. 2007;282:3989–3997. doi: 10.1074/jbc.M607627200. [DOI] [PubMed] [Google Scholar]
- 23.Slee EA, Harte MT, Kluck RM, Wolf BB, Casiano CA, Newmeyer DD, Wang HG, Reed JC, Nicholson DW, Alnemri ES, Green DR, Martin SJ. Ordering the Cytochrome C-Initiated Caspase Cascade: Hierarchical Activation of Caspases-2, -3, -6, -7, -8, and-10 in a Caspase-9-Dependent Manner. J. Cell Biol. 1999;144:281–292. doi: 10.1083/jcb.144.2.281. [DOI] [PMC free article] [PubMed] [Google Scholar]
- 24.Herceg Z, Wang ZQ. Functions of Poly(Adp-Ribose) Polymerase (Parp) in DNA Repair, Genomic Integrity and Cell Death. Mutat. Res. 2001;477:97–110. doi: 10.1016/s0027-5107(01)00111-7. [DOI] [PubMed] [Google Scholar]
- 25.Rutter GA, Pullen TJ, Hodson DJ, Martinez-Sanchez A. Pancreatic Beta-Cell Identity, Glucose Sensing and the Control of Insulin Secretion. Biochem. J. 2015;466:203–218. doi: 10.1042/BJ20141384. [DOI] [PubMed] [Google Scholar]
- 26.Kataoka K, Han SI, Shioda S, Hirai M, Nishizawa M, Handa H. Mafa Is a Glucose-Regulated and Pancreatic Beta-Cell-Specific Transcriptional Activator for the Insulin Gene. J. Biol. Chem. 2002;277:49903–49910. doi: 10.1074/jbc.M206796200. [DOI] [PubMed] [Google Scholar]
- 27.Wang S, Kaufman RJ. The Impact of the Unfolded Protein Response on Human Disease. J. Cell Biol. 2012;197:857–867. doi: 10.1083/jcb.201110131. [DOI] [PMC free article] [PubMed] [Google Scholar]
- 28.Ahn C, An B-S, Jeung E-B. Streptozotocin Induces Endoplasmic Reticulum Stress and Apoptosis Via Disruption of Calcium Homeostasis in Mouse Pancreas. Mol. Cell. Endocrinol. 2015;412:302–308. doi: 10.1016/j.mce.2015.05.017. [DOI] [PubMed] [Google Scholar]
- 29.Zhang R, Kim JS, Kang KA, Piao MJ, Kim KC, Hyun JW. Protective Mechanism of Kiom-4 in Streptozotocin-Induced Pancreatic Beta-Cells Damage Is Involved in the Inhibition of Endoplasmic Reticulum Stress. Evid. Based Complement Alternat. Med.: eCAM. 2011;2011 doi: 10.1155/2011/231938. [DOI] [PMC free article] [PubMed] [Google Scholar]
Associated Data
This section collects any data citations, data availability statements, or supplementary materials included in this article.


