

Abstract
In patients with chronic hepatitis C virus (HCV) infection, viral hijacking of the host-cell biosynthetic pathways is associated with altered lipid metabolism, which contributes to disease progression and may influence antiviral response. We investigated the molecular interplay among four key regulators of lipid homeostasis [microRNA (miR)-122, miR-24, miR-223, and proprotein convertase subtilisin/kexin type 9 (PCSK9)] in HCV-infected patients (n = 72) who achieved a treatment-based viral cure after interferon-based therapy with first-generation direct-acting antivirals. Real-time PCR was used to quantify microRNA plasma levels, and ELISA assays were used to determine plasma concentrations of PCSK9. We report that levels of miR-24 and miR-223 significantly increased in patients achieving sustained virologic response (SVR), whereas the levels of miR-122, a liver-specific cofactor for HCV infection, decreased in these patients. PCSK9 concentrations were significantly increased in SVRs, suggesting that PCSK9 may help impede viral infection. The modulatory effect of PCSK9 on HCV infection was also demonstrated in the context of HCV-infected Huh-7.5.1 cells employing recombinant human PCSK9 mutants. Together, these results provide insights into a novel coordinated interplay among three important molecular players in lipid homeostasis — circulating miR-24, miR-223 and PCSK9 — whose regulation is affected by HCV infection and treatment-based viral cure.
Keywords: Hepatitis C virus, Antiviral therapy, miR-24, miR-122, miR-223, Proprotein convertase subtilisin/kexin type 9
Highlights
-
•
Our study implicates an effect of CHC infection on lipid homeostasis via modulation of circulating regulatory markers.
-
•
Differential levels of circulating regulators of lipid metabolism (miR-24, miR-223, PCSK9) are associated with SVRs.
-
•
Wild type, loss-of-function and gain-of-function mutants showed PCSK9 could inhibit HCV replication in human hepatoma cells.
The hepatitis C virus (HCV)-related disease burden continues to increase as the infected population develops more serious liver diseases. Interestingly, cholesterol and lipid metabolism are dysregulated in HCV-infected patients, suggesting that lipid regulatory molecules could play a role in the development and progression of HCV-associated liver diseases. The relationships among four molecules that regulate lipid metabolism were examined in plasma samples from patients undergoing treatment for chronic HCV infection. This research identified correlations among these molecules and treatment success suggesting that differential levels of circulating regulators of lipid metabolism may be associated either with treatment outcome or liver disease progression.
1. Introduction
Cholesterol and lipid homeostasis are maintained through tightly controlled and complex molecular feedback mechanisms that involve coordinated regulation of major metabolic pathways (Goldstein et al., 2006). Disruption of cholesterol and lipid homeostasis can lead to a wide range of pathologies, including hyperlipidemia, atherosclerosis, and other metabolic disorders (LaRosa et al., 1990, Maxfield and Tabas, 2005). For instance, increasing evidence of viral hijacking of host cholesterol and lipid metabolic pathways by human enveloped viruses such as hepatitis C virus (HCV) is now uncovering an important and underappreciated intimate connection between virus, host lipids, and pathogenesis of viral disease. Specifically, HCV establishes chronic infection in approximately 75% of infected individuals and is a major cause of cirrhosis, end-stage liver disease, and hepatocellular carcinoma (Chen and Morgan, 2006).
Aside from the established effect of chronic HCV (CHC) infection on liver injury, CHC infection is also associated with host lipid metabolism dysregulation that may contribute to steatosis, which can further increase the risk of liver fibrosis (reviewed in Bassendine et al., 2013, Felmlee et al., 2013). Interestingly, several epidemiological studies have reported that CHC infection is associated with hypolipidemia (Serfaty et al., 2001, Corey et al., 2009) that usually resolves with successful HCV treatment, returning to baseline in those who achieve a sustained virological clearance; however, it persists in people who fail treatment (Corey et al., 2009). Furthermore, many successfully treated patients experience low-density lipoprotein (LDL) and cholesterol rebound to levels associated with an increased risk of developing coronary disease (Corey et al., 2009). Taken together, these clinical and experimental studies underline the complexity of the HCV-induced metabolic changes during CHC infection and their potential impacts on treatment outcome. However, remaining elusive is the identity of the key molecular players in lipid homeostasis, those circulating microRNAs and proteins whose regulation is affected by CHC infection and associated with treatment-based viral cure.
MicroRNAs (miRNAs) are small (18–24 nucleotides) non-coding RNAs that regulate gene expression at the post-transcriptional level (He and Hannon, 2004). They regulate key biological processes and can contribute to the pathogenesis of various diseases (He and Hannon, 2004). Circulating miRNAs also serve as stable plasma biomarkers for many disorders (Cortez and Calin, 2009, Wittmann and Jack, 2010) and are promising targets for novel therapeutic strategies (Janssen et al., 2013; Lindow and Kauppinen, 2012).
In regard to lipid metabolic control, miRNAs have recently been found to modulate cholesterol and lipid homeostasis. For example, in vivo inhibition of a liver-specific miRNA, miR-122, significantly lowers plasma cholesterol levels in both mice and non-human primates (Esau et al., 2006, Lanford et al., 2010). Besides having an important role in cholesterol homeostasis, miR-122 is required for efficient HCV replication (Jopling et al., 2005), and an miR-122 antagonist has been shown in a human clinical trial to have strong antiviral effects (Janssen et al., 2013). Another hepatic microRNA, miR-223, coordinates cholesterol homeostasis by targeting several key genes involved in regulating cholesterol biosynthesis and the influx and efflux process of cells (Vickers et al., 2014). In addition, several miRNAs from the miR-23 cluster have been reported to be involved in the regulation of lipid metabolism, including miR-27 (Vickers et al., 2013, Singaravelu et al., 2014, Shirasaki et al., 2013) and miR-24 (Ng et al., 2014). Interestingly, miR-223 and miR-24 are lipoprotein-associated miRNAs (Michell and Vickers, 2016, Vickers et al., 2011, Wagner et al., 2013) and are abundant in the liver (Vickers et al., 2014; Ng et al., 2014) and platelets (Landry et al., 2009, Willeit et al., 2013).
Convergent lines of experimental evidence support the potential roles of circulating microRNAs during CHC virus infection and their implications in the clinical outcomes of anti-HCV therapy. For example, expression profiling of circulating microRNAs revealed that serum levels of miR-122 and miR-34a may represent non-invasive biomarkers of diagnosis in patients with CHC (Cermelli et al., 2011), and transcriptomic analysis of CHC identified candidate microRNAs controlling the altered cholesterol pathways in chronic viral hepatitis (Selitsky et al., 2015). In addition, miRNA microarray profiling in liver biopsies of CHC patients prior to interferon (IFN)-based anti-HCV treatment showed that specific miRNAs correlated with treatment outcome. Expression levels of 9 miRNAs were significantly different between the sustained virologic responders (SVR) and non-responder (NR) groups, suggesting that expression patterns of these hepatic miRNAs are associated with the therapeutic outcome in CHC patients (Murakami et al., 2010).
Another important circulating regulator of lipid metabolism and a key modulator of cardiovascular health is proprotein convertase subtilisin/kexin type 9 (PCSK9) (Seidah et al., 2014). PCSK9 is secreted into the plasma by the liver and regulates cholesterol and lipid homeostasis, predominantly by promoting degradation of the low-density lipoprotein receptor (LDLR) via endosomal and lysosomal pathways (Seidah et al., 2014). Reducing the concentration or activity of PCSK9 correlates with increased concentration of LDLR on the cell surface, which increases the clearance of LDL particles from the circulation and reduces plasma LDL concentration. Also, circulating concentrations of PCSK9 directly correlate with LDL and total cholesterol concentrations (Seidah et al., 2014, Alborn et al., 2007, Dubuc et al., 2010). Because of the ability of PCSK9 to enhance degradation of HCV co-receptors such as LDLR (Seidah et al., 2014), a protective role of PCSK9 in HCV infection was recently proposed (Labonte et al., 2009, Seidah, 2016).
In this study, we investigated the molecular interplay among four key regulators of lipid homeostasis [miR-122, miR-24, miR-223, and PCSK9] in a well-characterized cohort of 94 patients with CHC, treated with pegylated interferon (PEG-IFN)-based combination therapy with the first-generation direct-acting antivirals, to help uncover the complexity of the HCV-induced lipid metabolic changes during CHC infection and their impacts on treatment outcome. We examined the correlation among the plasma levels of circulating miR-122, miR-24, miR-223, and liver-enriched PCSK9 with the cohort's clinical parameters. We also evaluated the impact of treatment-based viral cure of CHC infection on these four circulating regulatory molecules of lipid homeostasis and unraveled that differential levels of circulating regulators of lipid metabolism may be associated either with treatment outcome or liver disease progression. Importantly, our findings support further investigation of human metabolic pathways as predictors of progressive liver disease and treatment outcome in patients with chronic hepatitis C virus infection.
2. Materials and Methods
2.1. Patient Samples
Stored plasma samples (− 86 °C) from 94 patients with CHC were retrospectively analyzed. All patient samples were randomly collected at an outpatient clinic. All projects and associated methods involving the human plasma samples were approved by the University of British Columbia's Research Ethics Board [certificate # H13-01770], with a signed informed consent provided by all volunteers.
Patients were treated with interferon-based antiviral therapy that included PEG-IFN-alpha and ribavirin (RBV) with/without a potent oral HCV protease inhibitor (direct-acting antiviral, DAA) [either boceprevir (BOC) or telaprevir (TPV)] for 24–48 weeks (Fig. 1a). For some of the patients, the specific information on the DAA used in combination therapy was not provided. Consequently, no stratified analysis according to DAA is presented in this study.
Fig. 1.

Cohort overview and study design for miRNA analysis. a) Plasma samples were collected from a cohort of 94 patients chronically infected with HCV. All patients were treated with interferon-based antiviral therapy that included pegylated interferon-alpha (PEG-IFN) and ribavirin (RBV) with/without an oral HCV protease inhibitor [boceprevir (BOC)/telaprevir (TPV)] for 24–48 weeks [Treatment Week (TW) 24-TW48]. Plasma samples were collected before [Week 0 (W0)], during treatment (TW4-TW24/TW48), and after treatment [Follow-Up Week: (FUW)] at the indicated time points (FUW12/FUW24). b) Circulating levels of plasma miR-122, miR-24, and miR-223 were quantified by quantitative real-time PCR after total RNA isolation. MicroRNA levels were normalized to a non-human spike-in control [Caenorhabditis elegans miR-39 (cel-miR-39)]. Clinical relevance of circulating levels of plasma miR-122, miR-24, and miR-223 in CHC infection and their impacts on treatment outcome were evaluated using various statistical models (see Materials and methods).
Patients were classified as sustained virologic responders (SVRs) when HCV RNA was not detected at 12 and 24 weeks after the end of therapy. Relapsers were patients who were negative for HCV RNA at the end of therapy but HCV RNA positive at either 12 or 24 weeks after the end of therapy. Non-responders (NRs) were patients with detectable HCV RNA at all time points during and at the end of therapy. Human plasma samples were collected and evaluated at baseline before therapy (week 0: W0) as well as during therapy (Treatment Week: TW) [weeks 4 (TW4), 8 (TW8), 12 (TW12), 24 (TW24), and 48 (TW48)], and after therapy (Follow-Up Week: FUW) [12 (FUW12) or 24 (FUW24)] weeks post-treatment]. A cohort overview is summarized in Fig. 1a.
HCV RNA was quantified using the COBAS AmpliPrep/COBAS Taqman® HCV-Test from Roche Molecular Systems. FibroScan® testing was performed at the clinic before treatment initiation to determine the degree of liver fibrosis. Routine blood parameters were measured at sample collection time points. APRI (AST to platelet ratio index) scores were calculated using the formula: (aminotransferase (AST) level [U/L]/AST upper limit of normal [U/L]/platelet count [109/L]) × 100, where 40 U/L was used as AST upper limit of normal (Lin et al., 2011, Chou and Wasson, 2013).
FIB-4 values were calculated using the formula: age (years) × AST level [U/L]/(platelet count [109/L] × √ ALT [U/L]), where ALT stands for alanine aminotransferase (Sterling et al., 2006). Patients co-infected with hepatitis B virus or HIV-1 were excluded from the study. Data from patients receiving long-lasting, lipid-modulating drugs (Table 1: 3% of CHC patients) or metformin therapy for diabetes (Table 1: 6% of CHC patients) were included.
Table 1.
Patient demographics and baseline biochemical characteristics.
| Characteristic (mean ± SEM) | SVR (n = 39) | Relapsers (n = 9) | Non-responders (n = 24) | SVR vs Non-SVR |
|---|---|---|---|---|
| Epidemiology | P value | |||
| Sex, male/female | 22/17 | 4/5 | 15/9 | – |
| Age, yr | 52 ± 1.8 | 59 ± 1.4 | 56 ± 1.2 | 0.03 |
| Weight, kg | 82 ± 3.6 | 83 ± 7.5 | 88 ± 3.9 | 0.39 |
| HCV genotype 1/2/3 | 34/3/2 | 7/1/1 | 22/0/2 | – |
| HCV treatment, PEG-IFN + RBV ± DAA | 34/5 | 6/3 | 21/3 | – |
| Statins or fibrates, no. | 2 | 0 | 0 | – |
| Metformin, no. | 3 | 0 | 1 | – |
| Laboratory results | ||||
| ALT (U/L) | 85 ± 8.8 | 100 ± 23.3 | 121 ± 19.1 | 0.09 |
| AST (U/L) | 65 ± 6.7 | 87 ± 16 | 99 ± 15 | 0.03 |
| Hemoglobin (g/L) | 144 ± 2.6 | 143 ± 3.2 | 138 ± 3.6 | 0.19 |
| WBC (× 109/L) | 6.4 ± 0.3 | 5.9 ± 0.8 | 5.6 ± 0.5 | 0.16 |
| Platelets (× 109/L) | 203 ± 11.9 | 144 ± 18.4 | 161 ± 21.4 | 0.02 |
| Neutrophils (× 103/mm3) | 3.4 ± 0.3 | 3.2 ± 0.5 | 2.8 ± 0.3 | 0.19 |
| HCV RNA, (× 106 IU/mL) | 2.8 ± 1.1 | 2.6 ± 0. 97 | 1.7 ± 0.29 | 0.46 |
| Liver injury scores | ||||
| APRI score | 1.0 ± 0.2 | 2.1 ± 0.8 | 1.7 ± 0.3 | 0.032 |
| FIB-4 score | 2.4 ± 0.4 | 4.4 ± 0.98 | 4 ± 0.6 | 0.01 |
| Fibroscan, kPA | 10 ± 1.2 n = 28 | 19 ± 7.3 n = 5 | 17 ± 1.8 n = 17 | 0.003 |
| MicroRNAs (ΔCt) | ||||
| miR-122 | 5.4 ± 0.3 | 6.1 ± 0.5 | 5.2 ± 0.4 | 0.95 |
| miR-24 | 6.4 ± 0.3 | 6.8 ± 0.7 | 6.9 ± 0.3 | 0.24 |
| miR-223 | 4.6 ± 0.4 | 5.3 ± 0.8 | 5.4 ± 0.4 | 0.15 |
ALT, alanine transaminase; AST, aspartate transaminase; WBC, white blood cells; HCV, hepatitis C virus. MicroRNA levels are reported as ΔCts after normalizing to spike-in RNA. P-values are for comparison between SVRs and non-SVRs (relapsers + non-responders). P-values were calculated using the parametric two-tailed t-test. P-values < 0.05 were considered significant. Note: There is an inverse correlation between ΔCt and miRNA expression level: Lower ΔCt values are associated with increased miRNA expression.
2.2. Detection of Circulating miRNAs
The experimental design is summarized in Fig. 1b. We initially performed a pilot study where we tested the plasma levels of miR-122, miR-24, miR-155, miR-196b, miR-224, miR-223, miR-33a, and miR-33b. We selected these eight microRNAs based on the cumulative experimental evidence at the time we initiated this study; that evidence supported (i) their roles as regulators of lipid homeostasis [miR-122 (Esau et al., 2006); miR-24 (Ng et al., 2014); miR-223 (Vickers et al., 2014); miR-33 (Rayner et al., 2010)]; (ii) their disregulation during CHC [miR-122 (Cermelli et al., 2011); miR-155 (Bala et al., 2012); miR-224 (Lendvai et al., 2014); miR-33 (Lendvai et al., 2014)]; or (iii) their anti-HCV activity [miR-122 (Jopling et al., 2005); miR-196 (Hou et al., 2010, Kałużna, 2014)]. The results of our pilot study revealed that plasma levels of miR-122, miR-223, and miR-24 were robustly detected by qRT-PCR in our clinical samples. Because we observed efficient and reliable detection of miR-122, miR-223 and miR-24 in those clinical samples using our PCR platform, we decided to focus on these three circulating microRNAs for our study presented in this manuscript.
Total RNA was extracted from plasma with the miRNeasy Serum/Plasma kit (Qiagen, Hilden, Germany) according to the manufacturer's protocol. Complimentary DNA (cDNA) was synthesized using the miScript II RT kit (Qiagen) according to the manufacturer's instructions with the following modifications: The cDNA was diluted 1:10 in RNase-Free water and miRNAs were detected using the miScript SYBR® Green PCR kit (Qiagen). MicroRNAs were detected with Ce_miR-39_1, miR-24-3p, miR-223-3p, and miR-122a-5p miScript Primer assays (Qiagen). MicroRNA levels were presented as ΔCt in the analyses where miRNA levels were normalized to the reference spike-in RNA but without baseline normalization (Fig. 2, Table 1, Table 2, Table 3). MicroRNA levels were also normalized using miR-39 spike-in RNA via the 2− ΔΔCt method when normalized to baseline levels (Fig. 3) (Loveday et al., 2015). Importantly, there is an inverse correlation between ΔCt and miRNA level: Lower ΔCt values are associated with increased miRNA level.
Fig. 2.

Circulating miR-24 and miR-223 levels in plasma show a strong positive linear relationship in all CHC patients and negatively correlate with liver injury and liver fibrosis. (a–c) Graphs representing the negative linear relationship between miR-24 and miR-223 levels and liver injury scores [APRI (a) and FIB-4 (b)], and the robust, positive linear relationship between miR-122 and APRI scores (a), and miR-122 and HCV virus load (c). The slopes and ordinates values (see Supplementary Tables 2–4) of the plots presented in panels (a–c) were estimated by applying a mixed model analysis to our clinical data sets as described in the Materials and methods section. (d–e) Spearman's correlation plot of circulating miR-223 and miR-24 levels (d), miR-24 and miR-122 levels (e), and miR-223 and miR-122 levels (f) in all CHC patients. The rhos value observed (rhos = 0.91, p-value < 0.0001) is indicative of a very strong, positive monotonic correlation between circulating levels of miR-24 and miR-223 (d). In contrast, both miR-24 or miR-223 weakly correlated with miR-122 levels (rhos = 0.33, p-value < 0.0001) (e) and (rhos = 0.31, p-value < 0.0001) (f), respectively. Note: There is an inverse correlation between ΔCt and miRNA expression level: Lower ΔCt values are associated with increased miRNA expression.
Table 2.
Correlations of circulating miR-122, miR-24, and miR-223 with biochemical parameter.
| ΔCt (miR-122) |
ΔCt (miR-24) |
ΔCt (miR-223) |
||||
|---|---|---|---|---|---|---|
| rhos | P value | rhos | P value | rhos | P value | |
| AST | − 0.544 | < 0.0001 | 0.14 | 0.002 | 0.15 | 0.0009 |
| ALT | − 0.618 | < 0.0001 | 0.077 | 0.087 | − 0.069 | 0.128 |
| HGB | − 0.202 | < 0.0001 | − 0.27 | < 0.0001 | − 0.298 | < 0.0001 |
| Platelets | 0.094 | 0.039 | − 0.389 | < 0.0001 | − 0.45 | < 0.0001 |
| WBC | − 0.035 | 0.444 | − 0.298 | < 0.0001 | − 0.358 | < 0.0001 |
| Neutrophils | 0.473 | 0.296 | − 0.273 | < 0.0001 | − 0.33 | < 0.0001 |
| APRI score | − 0.419 | < 0.0001 | 0.3 | < 0.0001 | 0.329 | < 0.0001 |
| FIB-4 score | − 0.193 | < 0.0001 | 0.354 | < 0.0001 | 0.4 | < 0.0001 |
Note: There is an inverse correlation between ΔCts and miRNA expression level: Lower ΔCt values are associated with increased miRNA expression. Correlation analysis was performed on all samples.
Table 3.
ANOVA model analysis of the change in microRNA levels after treatment completion in SVRs and relapsers.
| MicroRNA/liver test | Treatment status | Difference in means | Standard error | P value | Lower 95% confidence limit | Upper 95% confidence limit |
|---|---|---|---|---|---|---|
| ΔCt (miR-122) | SVR | 1.255 | 0.282 | < 0.0001 | 0.698 | 1.813 |
| Relapse | − 1.273 | 0.872 | 0.165 | − 3.132 | 0.586 | |
| ΔCt (miR-24) | SVR | − 1.151 | 0.283 | < 0.0001 | − 1.71 | − 0.591 |
| Relapse | − 0.608 | 0.850 | 0.486 | − 2.419 | 1.204 | |
| ΔCt (miR-223) | SVR | − 1.365 | 0.357 | 0.0002 | − 2.072 | − 0.658 |
| Relapse | − 0.440 | 1.021 | 0.672 | − 2.616 | 1.735 | |
| APRI score | SVR | − 0.605 | 0.159 | 0.0002 | − 0.920 | − 0.290 |
| Relapse | − 0.365 | 0.883 | 0.685 | − 2.247 | 1.517 | |
| FIB-4 score | SVR | − 0.675 | 0.395 | 0.090 | − 1.457 | 0.106 |
| Relapse | 0.485 | 1.299 | 0.714 | − 2.283 | 3.253 |
Note: There is an inverse correlation between ΔCt and miRNA expression level: Lower ΔCt values are associated with increased miRNA expression.
Fig. 3.
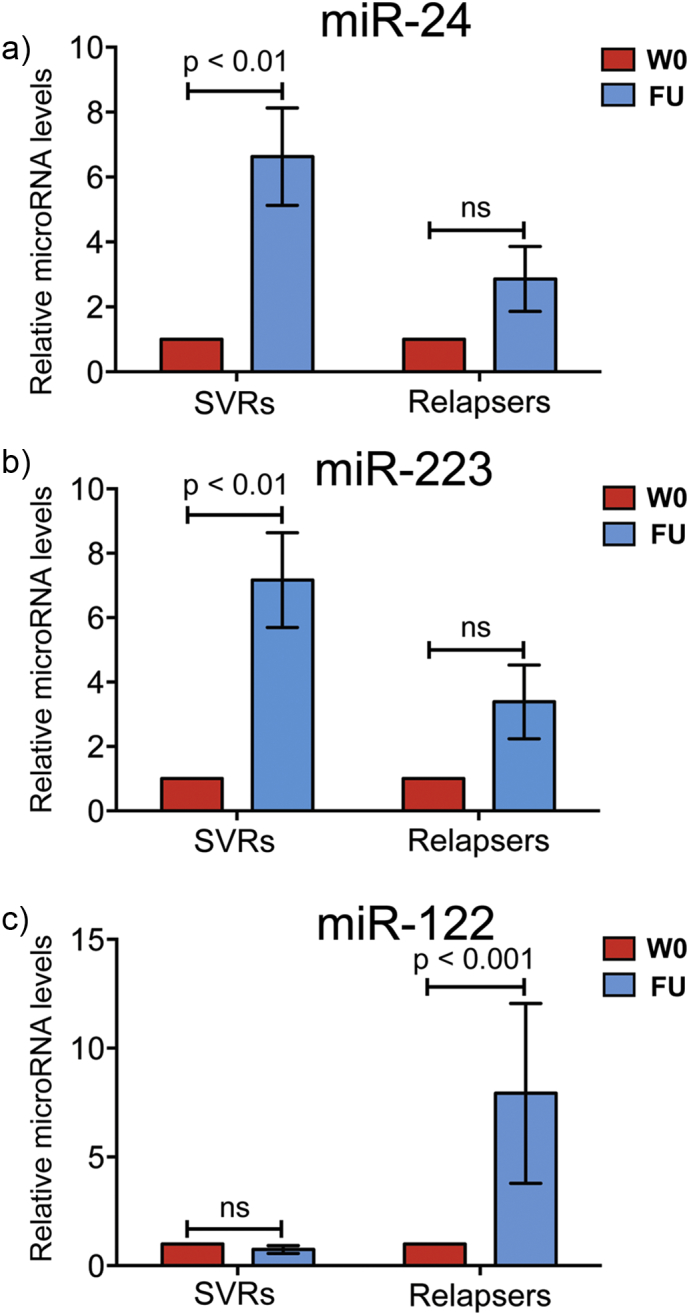
Circulating miR-24 and miR-223 plasma levels, not miR-122, significantly increase in patients who have achieved SVR. Two-way analysis of variance (ANOVA) was used to determine if plasma levels of miR-24, miR-223, and miR-122 were specifically dysregulated for the SVRs and relapsers after antiviral treatment [follow-up: (FU)] when normalized to individual baseline levels before treatment (W0). The results revealed a specific dysregulation of plasma miR-24 and miR-223 levels with SVRs, characterized by a significant 6- and 7-fold increase in circulating miR-24 and miR-223 levels, respectively (a-b) after antiviral treatment. In contrast, results of our analyses revealed that plasma miR-122 levels were specifically dysregulated for the relapsers, with a significant 8-fold increase in its circulating levels after antiviral treatment (c). Abundance of each circulating miRNA was measured in paired samples of HCV patients before (baseline: W0) and after antiviral treatment (FU). Data were normalized to individual baseline levels before treatment, expressed as the fold change and analyzed based on treatment outcomes. Data are shown as means ± SEM and compared with the two-way ANOVA. ns = non-significant.
2.3. PCSK9 ELISA
Plasma PCSK9 concentrations were determined using CircuLex human PCSK9 ELISA kits in accordance with the manufacturer's instructions (MBL, Woburn, MA, USA).
2.4. Cell Culture and HCV Infection
Human hepatoma Huh-7.5.1 cells were kindly provided by Dr. Francis Chisari (Scripps Research Institute, La Jolla, CA, USA). Cultured cells were grown in Dulbecco's modified Eagle medium (DMEM) supplemented with 1% penicillin/streptomycin, glutamine, non-essential amino acids, and HEPES, and 10% fetal bovine serum (FBS) (Gibco/Invitrogen, Burlington, ON, Canada) or 10% lipoprotein-depleted serum (LPDS) (Biomedical Technologies Inc., Stoughton, MA, USA). Recombinant his-tagged, wild-type (wt) human PCSK9 (wt-PCSK9), gain-of-function PCSK9-D374Y, and loss-of-function PCSK9-R194A were obtained from Circulex at MBL International (Woburn, MA, USA). HCV RNA and infectious HCV stocks were produced and titered as described previously (Kato et al., 2003, Olmstead et al., 2012). Briefly, a plasmid containing the cDNA of an HCV consensus clone isolated from a Japanese patient with fulminant hepatitis (JFH-1) (GenBank accession number AB047639) (Kato et al., 2003) cloned behind a T7 promoter (pJFH-1; a generous gift from Dr. Takaji Wakita, National Institute of Infectious Diseases, Tokyo, Japan) was used to generate genomic HCV RNA and infectious HCV stocks as previously described in (Olmstead et al., 2012).
Infectious HCV stocks were used to infect human hepatoma Huh-7.5.1 cells for PCSK9-based studies. Intracellular HCV infection levels in PCSK9-treated cells were determined using Cellomics High Content Screening (HCS) Reader (Thermo Scientific) (Olmstead et al., 2012).
2.5. Statistical Analysis
Statistical analysis was performed using SAS version 9.2 and GraphPad Prism version 6.0 (GraphPad Software Inc., La Jolla, CA). Data are presented as mean ± standard error of the mean (SEM). Data were analyzed by Spearman's correlation t-test, Welch's t-test for unpaired comparison, and Bonferroni's multiple comparison test.
Model 1: Response 1 = Response 2 + patient intercept (random) + patient slope (random)
where yijk denotes the i-th observation of patient j of the response (Response 1), xij is the covariate (Response 2), and ϵij is the error term.
Model 1 looks at the relationship between Response 1 and Response 2, allowing a different intercept and slope for each patient. Response 1 is defined as miRNA ΔCt response (i.e., separate models for each miRNA investigated), and Response 2 is defined as APRI, FIB-4 score, HCV viral load, and other liver function scores (i.e., separate models for each relationship).
Model 2: Response = covariate
where yi denotes the i-th observation, xi is an indicator variable for treatment status, α1 denotes the differences in response between before and after treatment, and ϵi is the error term.
Model 2 is an ANOVA that looks at the difference in mean response between patients before and after treatment. Responses assessed were ΔCt for each miRNA and APRI and FIB-4 scores for each patient outcome group (SVRs and relapsers).
A more detailed description of the materials and methods used can be found in Supplementary information.
3. Results
3.1. Study Design and Cohort Characteristics
This longitudinal study included 94 participants with CHC, including 57 achieving SVR, 10 relapsers, and 27 NRs to anti-HCV therapy, who were followed for an average of 60 to 72 weeks before, during, and after treatment (Fig. 1a and Supplementary Table 1). Participants without plasma samples (n = 22) at baseline (week 0) were excluded from analysis of baseline clinical parameters associated with SVRs and non-SVRs (relapsers + NRs) and from paired analysis of circulating miRNAs before and after treatment in SVRs and relapsers. This yielded 39 SVRs, 9 relapsers, and 24 NRs for analysis (n = 72). The majority of the CHC participants were treated with PEG-IFN-based combination therapy with the first-generation direct-acting antivirals (DAAs; i.e., boceprevir and telaprevir) [Table 1: 61/72 (85%)], and these participants were mostly infected with HCV genotype 1 (GT1) [Table 1: 63 GT1 (88%), 4 GT2 (5%), and 5 GT3 (7%)].
The demographics of the SVRs, relapsers, and NRs as well as baseline clinical parameters and pertinent medications are shown in Table 1. In agreement with a previous study, in our cohort, older patients, patients with lower platelet counts, and patients with a higher degree of liver injury and fibrosis based on APRI, FIB-4, and Fibroscan scores were less likely to achieve SVR (Shirakawa et al., 2008). It is of particular interest that in our cohort, the baseline levels of plasma miR-122, miR-24, and miR-223 did not differ significantly between SVR and non-SVR patients (Table 1). In addition, there was no significant difference in circulating miR-122, miR-24, and miR-223 levels in SVRs, relapsers, or NRs at any time during treatment compared to baseline levels (Supplementary Fig. 1a–i).
3.2. Correlation between Levels of miR-122, miR-24, miR-223, and Clinical Parameters in CHC Patients
It is important to note here that we used ΔCt values to perform the analysis presented in this study; lower ΔCt values are associated with increased miRNA expression (inverse correlation). Initially, the Spearman's correlation coefficients (rhos) were calculated to measure the correlation between circulating plasma levels of miR-122, miR-24, and miR-223 and the biochemical parameters in all CHC patients (Table 2). For the liver-specific miR-122, we observed rhos values indicative of a moderate, positive monotonic correlation between its circulating plasma levels and liver aminotransferase concentration [ΔCt (miR-122): AST (rhos = − 0.54); ALT (rhos = − 0.62)] and APRI score [ΔCt (miR-122): APRI (rhos = − 0.42)]. In contrast, we observed a weak, negative monotonic correlation between the levels of circulating miR-24 and miR-223 and APRI score [ΔCt (miR-24), rhos = 0.30; ΔCt (miR-223), rhos = 0.33], or levels of circulating miR-24 and miR-223 and FIB-4 score [ΔCt (miR-24), rhos = 0.35; ΔCt (miR-223), rhos = 0.40]. Moreover, there was a weak to moderate positive monotonic correlation between miR-24 and platelets [ΔCt (miR-24), rhos = − 0.39], and miR-223 and platelets [ΔCt (miR-223), rhos = − 0.45], respectively.
Thus, the initial Spearman's correlation analysis presented in Table 2 showed a positive correlation between miR-122, predominantly expressed in the liver, and clinical parameters associated with liver functions (AST and ALT) and liver injury (APRI). On the contrary, negative correlations were observed between the circulating levels of plasma miR-24 and miR-223 and liver injury scores (APRI and FIB-4). Interestingly, the circulating levels of miR-24 and miR-223, two platelet-enriched miRNAs (24), showed a positive correlation with platelets.
To investigate this further, we next performed a mixed-model analysis to determine the relationship between miR-122, miR-24, and miR-223 and the clinical parameters reported in this study (Supplementary Tables 2–4). A detailed description of the statistical models is presented under Materials and methods (Model 1). By applying the mixed model to our clinical data sets, we demonstrated a robust, positive linear relationship between miR-122 and APRI scores (Fig. 2a), and miR-122 and HCV virus load (Fig. 2c). Consistent with the Spearman's correlation analysis, we observed a negative linear relationship between miR-24 and miR-223 and liver injury scores [APRI (Fig. 2a) and FIB-4 (Fig. 2b)]. Additionally, positive, linear relationships were confirmed between circulating levels of miR-24 and miR-223 and platelet count (Supplementary Tables 2 and 4).
Because we observed very similar correlations between miR-24 and miR-223 with the clinical parameters studied in our cohort, we next investigated a possible relationship between these two miRNAs by calculating their Spearman's correlation coefficient. The rhos value observed (rhos = 0.91, p-value < 0.0001) is indicative of a positive monotonic correlation between circulating levels of miR-24 and miR-223 (Fig. 2d). On the contrary, both miR-24 or miR-223 weakly correlated with miR-122 levels (rhos = 0.33, p-value < 0.0001) (Fig. 2e) and (rhos = 0.31, p-value < 0.0001) (Fig. 2F), respectively. Finally, association between miR-24 and miR-223 was further confirmed using our linear mixed model. The results presented in Supplementary Tables 2 and 4 demonstrate a significant, positive linear relationship between circulating plasma levels of miR-24 and miR-223 in all CHC patients.
3.3. Circulating miR-24 and miR-223 Plasma Levels Significantly Increase in Patients Achieving SVR
To help uncover the complexity of the HCV-induced metabolic changes during CHC infection and their impacts on treatment outcome, we investigated the molecular interplay among miR-122, miR-24, and miR-223 in the HCV-infected patients who achieved SVR or not after interferon-based combination therapy (Fig. 3).
To perform this analysis, the circulating levels of plasma miR-122, miR-24, and miR-223 were measured in paired samples of HCV patients before (baseline) and after antiviral treatment. Data were normalized to the miRNA baseline levels for each patient before treatment (week 0: W0) and analyzed based on treatment outcomes (SVRs and relapsers).
The data were first analyzed using a two-way analysis of variance (ANOVA) (Fig. 3). The results revealed a specific dysregulation of plasma miR-24 and miR-223 levels in SVRs, characterized by a significant 6- and 7-fold increase in circulating miR-24 and miR-223 levels, respectively (Fig. 3a–b) after antiviral treatment (Follow-up = FU). On the contrary, results of our analyses revealed that plasma miR-122 (but not miR-24 and miR-223) levels were dysregulated in the relapsers, with a significant 8-fold increase in its circulating levels after FU (Fig. 3c). Importantly, the results presented in Supplementary Fig. 2 demonstrate that the elevated signals reported in Fig. 3a for miR-24 and in Fig. 3b for miR-223 in SVRs at follow-up (FU) relative to W0 are not driven by just a few of the results in the patients we investigated but by the large majority of those SVR patients [see Supplementary Fig. 2a (miR-24); Supplementary Fig. 2b (miR-223].
To explore further the possible clinical significance of the data shown in Fig. 3, an ANOVA model was fitted to the data (Model 2). This model was applied to analyze the difference in circulating miRNA levels and APRI and FIB-4 scores before and after treatment, specifically, the mean level at baseline compared to the mean level across the follow-up time points tested (Table 3). This analysis demonstrated a statistically significant difference in circulating levels of miR-223, miR-24, and miR-122 after treatment compared to baseline in SVRs but not in relapsers. As in the earlier analysis, miR-223 and miR-24 plasma levels increased after treatment [ΔCt (miR-24), ΔCt change = − 1.15, p-value < 0.0001; ΔCt (miR-223), ΔCt change = − 1.37, p-value = 0.0002] in patients achieving SVR. Plasma levels of miR-122 decreased after treatment [ΔCt (miR-122), ΔCt change = 1.26, p-value < 0.0001] in patients achieving SVR, which was not significant based on the previous two-way ANOVA presented in Fig. 3c, where data were normalized to individual baseline levels.
Finally, an ANOVA model analysis was also performed on the APRI and FIB-4 scores, and as previously reported (Martinez et al., 2011), APRI scores significantly decreased (APRI score change = − 0.61, p-value = 0.0002) in patients achieving SVR compared to their pre-treatment status (Table 3) but not in relapsers. Thus, the results of ANOVA (Model 2) showed differential miRNA levels depending on the outcomes of the antiviral therapy. Importantly, while miR-122 levels decreased, miR-24 and miR-223 levels significantly increased after SVR compared to mean baseline levels (Table 3).
3.4. Plasma PCSK9 Concentrations Significantly Increase in HCV-Infected Patients who Have Achieved SVR
To further examine the impact of HCV clearance on lipid homeostasis in HCV-infected patients who achieved SVR, we next examined plasma PCSK9 concentrations by ELISA. PCSK9 is secreted into the plasma by the liver, and this liver-enriched protein regulates cholesterol and lipid homeostasis (Seidah et al., 2014, Seidah, 2016).
Using a paired t-test (two-tailed), we compared the mean of PCSK9 concentrations for SVRs (Fig. 4a) and relapsers (Fig. 4b) before (W0) and after treatment (i.e., FU). We found that PCSK9 concentrations were significantly upregulated (p = 0.002) in plasma samples from SVR patients but not from relapsers (Fig. 4a–b), suggesting that circulating PCSK9 may impede viral infection. We did not observe significant differences in baseline plasma PCSK9 concentrations between SVRs, relapsers, or NRs (Fig. 4c); however, there was a non-significant increase in PCSK9 concentrations in both relapsers and NRs compared to patients achieving SVR. Interestingly, using Spearman's correlation, we observed a positive, significant correlation between plasma PCSK9 concentrations and circulating plasma levels of miR-24 [ΔCt (miR-24), rhos = − 0.24, p-value = 0.0174] (Supplementary Table 5). Importantly, the results presented in Supplementary Fig. 2c demonstrate that the elevated signal reported in Fig. 4a for PCSK9 in SVRs at follow-up (FU) relative to W0 is not driven by just a few of the results in patients we investigated but by the large majority of those SVR patients.
Fig. 4.
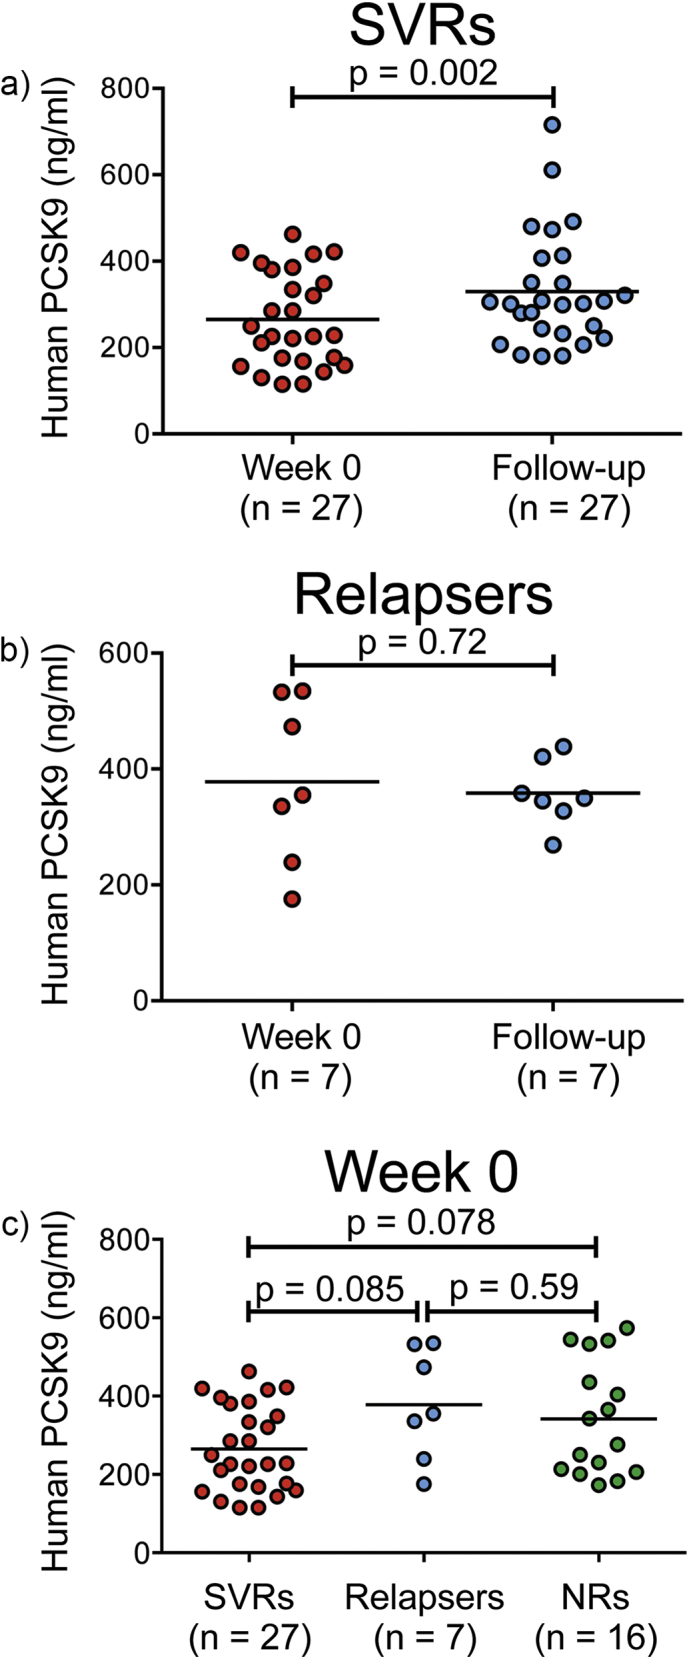
Plasma PCSK9 concentrations significantly increase in HCV-infected patients who achieved SVR. A paired dependent t-test was used to determine differences associated with plasma PCSK9 concentrations before and after treatment for SVRs (a) and relapsers (b). PCSK9 levels were significantly higher (p = 0.002) in plasma samples from SVRs (a) but not from relapsers (b). No significant differences were observed in baseline plasma PCSK9 concentrations between SVRs, relapsers, or non-responders (NRs) (c). The straight line in the data represents mean, and data were compared using a two-tailed paired t-test [(a) and (b)] and with a one-way ANOVA (c). Results are reported as the average of two technical replicates.
3.5. Human PCSK9 and Gain-of-Function Mutant PCSK9-D374Y Inhibit HCV Infection in Human Hepatoma Cells
To explore further the hypothesis that circulating PCSK9 levels may impede HCV infection in SVRs, we tested the effect of extracellularly applied human PCSK9 on HCV infection in human hepatoma Huh-7.5.1 cells. More specifically, we evaluated the modulatory effect of increasing PCSK9 concentration on HCV infection by employing recombinant human wild-type PCSK9 (wt-PCSK9) (Qian et al., 2007, Lagace et al., 2006) and PCSK9 gain- and loss-of-function mutants (Fig. 5a–b) in a robust cell culture model of HCV (JFH-1) infection (Kato et al., 2003, Olmstead et al., 2012).
Fig. 5.

Extracellularly applied recombinant PCSK9 and the gain-of-function mutant PCSK9-D374Y but not the loss-of-function PCSK9-R194A variant inhibit HCV infection in Huh-7.5.1 cells. a) PCSK9 is a secreted protein highly expressed in the liver where it plays an important role as a post-translational regulator of LDLR levels. It is biosynthesized as a preproprotein that contains a prodomain, catalytic domain, and cysteine-histidine-rich domain (CHRD). The PCSK9 catalytic triad contains aspartate 186 (D186), histidine 226 (H226), and serine 386 (S386). b) Gain-of-function mutations such as D374Y in PCSK9 have been associated with hypercholesterolemia due to lower levels of LDLR (10 × higher affinity for LDLR) and reduced clearance of plasma LDL. Loss-of-function PCSK9 mutations (R194A) are conversely associated with abnormally low circulating cholesterol levels due to increased LDLR abundance (lower affinity for LDLR) on the surface of liver cells. (c–d) Huh-7.5.1 cells grown in LPDS-supplemented media were treated with varying concentrations of recombinant (r) PCSK9 (r-PCSK9) or PCSK9-D374Y (r-D374Y), or (e) 25 μg/mL PCSK9-R194A (r-R194A), for 8 h. Treated cells were infected with HCV [multiplicity of infection [(MOI) = 0.5] and cells were fixed 48 h post-infection. Cells probed with HCV core-specific antibodies and stained with Hoechst dye to visualize cell nuclei were counted using Cellomics HCS to determine the percentage of total HCV-infected cells (Olmstead et al., 2012). Representative images are shown acquired at 10 × magnification objective (Cellomics HCS) (c). The EC50 values for recombinant PCSK9 and PCSK9-D374Y mutant were calculated based on the dose response (d). Values are expressed as relative HCV infection in treated cells compared to untreated cells, which are set to 1. Results (mean ± SEM) from 3 independent experiments are shown (c–e).
Huh-7.5.1 cells were pre-treated for 8 h with increasing concentrations of recombinant wt-PCSK9 (r-PCSK9, from 0.15 μg/mL to 25 μg/mL) prior to HCV infection (Fig. 5c–d). The human hepatoma cells were pre-treated with r-PCSK9 to allow the degradation of mature LDLR (Romagnuolo et al., 2015), an entry factor for HCV virions (Owen et al., 2009). Under these experimental conditions, 25 μg/mL of r-PCSK9 robustly inhibited HCV infection (98.6% or 42-fold) with a median effective concentration (EC50) value of 4.63 ± 0.06 μg/mL (Fig. 5d). In contrast, when Huh-7.5.1 cells were pretreated with 25 μg/mL of the recombinant loss-of-function mutant PCSK9-R194A (r-R194A) (Fig. 5b), no significant reduction in intracellular levels of HCV core protein was detected compared to control cells (Fig. 5e). Because PCSK9-R194A has a decreased ability to degrade LDLRs when compared to PCSK9-wt in human hepatoma cells (Cameron et al., 2008) and because biochemical studies have confirmed the key role of PCSK9 R194 residue in binding the EGF-A repeats of LDLR (Bottomley et al., 2009), taken together these results on loss- and gain-of-function PCSK9 variants suggest that inhibition of HCV infection in Huh-7.5.1 cells by r-PCSK9 and r-D374Y (Fig. 5) is mediated through an LDLR-dependent mechanism.
To confirm these results, we tested the modulatory effect of the gain-of-function mutant PCSK9-D374Y (Naoumova et al., 2005) on HCV infection. As shown in Fig. 5b, an extra contact is formed between PCSK9 and LDLR at neutral pH when D374 is mutated to Y374 (Cunningham et al., 2007, Fisher et al., 2007). The result of this natural mutation (D374Y) is a 10-fold increase in LDLR turnover by PCSK9-D374Y compared to wt-PCSK9 (Lagace et al., 2006). As expected, following pretreatment of Huh-7.5.1 cells with r-D374Y for 8 h, the number of HCV core-positive cells markedly decreased (Fig. 5c–d). The calculated EC50 value for r-D374Y inhibition of HCV infection under these experimental conditions was 0.66 ± 0.05 μg/mL (Fig. 5d). Interestingly, the calculated ratio between the two reported EC50 values in this study for the anti-HCV activities of wt-PCSK9 and PCSK9-D374Y (~ 7 fold) is closely related to the fold increase (~ 10 fold) in LDLR turnover for wt-PCSK9 and PCSK9-D374Y previously reported (Lagace et al., 2006).
Hence, our results support our hypothesis that circulating PCSK9 levels may impede HCV infection through an LDLR-dependent mechanism (Labonte et al., 2009). Future studies are needed to investigate the effect of circulating loss- and gain-of-function PCSK9 variants in vivo on other receptor targets, such as CD81 and VLDLR (Seidah, 2016) that are also considered entry factors for HCV (Pileri et al., 1998, Ujino et al., 2016).
4. Discussion
Although numerous experimental and clinical results point to an intimate connection between HCV-induced lipid metabolic changes, viral disease progression, and antiviral response, the identity of the key regulators of lipid homeostasis involved and how these circulating regulatory molecules are affected by HCV infection and treatment-based viral cure remain unclear.
In this longitudinal study, we investigated the molecular interplay among four key regulators of lipid homeostasis (miR-122, miR-24, miR-223, and PCSK9) in HCV GT1-infected patients who had achieved a treatment-based viral cure with an IFN-based combination therapy with the first-generation DAAs. We examined potential correlations between miR-122, miR-24, and miR-223, and PCSK9 with the cohort's clinical parameters. We evaluated whether treatment-based viral cure of CHC infection is associated with a coordinated interplay among these four circulating regulatory molecules of lipid homeostasis in order to unravel candidate biomarkers for a treatment-based viral cure of CHC infection and potential therapeutic targets to prevent the progression of HCV-associated liver diseases.
We report that levels of miR-24 and miR-223 specifically increase in patients who achieved SVR whereas the levels of miR-122, a cofactor for HCV infection, decreased in these patients. Interestingly, plasma PCSK9 concentrations were significantly increased in the HCV-infected patients who achieved SVR, suggesting that circulating PCSK9 may impede viral infection. The modulatory effect of PCSK9 on HCV infection was further demonstrated employing recombinant human wild-type PCSK9 and PCSK9 gain- and loss-of-function mutants in a robust cell culture model of HCV infection (Olmstead et al., 2012). Together, these results provide insights into a coordinated interplay among three important molecular players in lipid homeostasis—circulating miR-24, miR-223, and PCSK9—whose regulation is affected by HCV infection and treatment-based viral cure. In addition, circulating miR-24, miR-223 and PCSK9 may represent potential therapeutic targets to prevent the progression of HCV-associated liver disease that may continue to develop even after patients achieve SVR (Chung and Baumert, 2014).
First, we identified a > 6- and 7-fold increase in the plasma levels of circulating miR-24 and miR-223, respectively, in patients who achieved SVR after treatment compared to the baseline level but not in relapsers. The observed increase in miR-24 and miR-223 likely reflects potential antiviral functions of these miRNAs in SVRs and/or a physiological response to viral clearance. A potential role of miR-24 in the host antiviral responses for patients who achieved SVR is supported in part by several lines of evidence reported by Liu and collaborators (Liu et al., 2010) using cell-based systems of HCV infection. The authors demonstrated that miR-24 was down-regulated post-HCV infection in JFH-1 HCV-infected-hepatocytes, and they reported a 2-fold decrease in intracellular HCV RNA abundance after the transfection of miR-24 mimic into cell culture-derived HCV (HCVcc)-infected Huh7.5.1 cells (Liu et al., 2010).
Alternately, the dysregulation of circulating levels of miR-24 during HCV infection in cellulo (Liu et al., 2010) or in vivo upon treatment-induced viral cure of HCV (this study) may affect pathways and targets of biological relevance in liver-cell/tissue homeostasis. One such example is the TGF-β signaling pathway, a validated target of miR-24 (Loveday et al., 2015, Dogar et al., 2011), which plays a causal role in pathological fibrosis (Matsuzaki et al., 2007). Since circulating miR-24 plasma levels significantly increase in SVRs, this could lead to the suppression of TGF-β expression and reduced hepatic fibrosis in these patients (Giannelli et al., 2016). Similarly, the increase in circulating miR-223 might suggest improved liver outcomes following viral cure; a recent study showed that miR-223 levels were significantly lower in the sera and liver biopsies of hepatocellular carcinoma patients compared to healthy volunteers (Bhattacharya et al., 2016). Interestingly, we observed an excellent correlation between plasma levels of circulating miR-24 and miR-223 (rhos = 0.91, p-value < 0.0001), suggesting an intimate connection between these two microRNAs that could be due to common mechanistic pathways and/or target genes.
Since SVRs have increased LDL and cholesterol from baseline compared to non-SVR patients (Corey et al., 2009, Meissner et al., 2015), upregulated levels of circulating miR-24 and miR-223 in SVR patients could be directly associated with an upregulation in the levels of lipoprotein that serve as carriers of these miRNAs. Both miR-24 and miR-223 are lipoprotein-associated miRNAs (Michell and Vickers, 2016, Vickers et al., 2011, Wagner et al., 2013), while miR-223 is the most abundant miRNA occurring in high-density lipoprotein and LDL (Wagner et al., 2013). Furthermore, both high-density lipoprotein-associated miR-223 and miR-24 are the most regulated miRNAs in atherosclerosis with a > 3000-fold and 65-fold increase, respectively, in human familial hypercholesterolemia (Vickers et al., 2011).
Second, we established that plasma PCSK9 levels increased in SVRs after the end of treatment compared to baseline levels. Increase in circulating PCSK9 levels is normally associated with the reduction of LDLR protein in the liver, resulting in higher levels of LDL cholesterol in plasma (Abifadel et al., 2003). Therefore, the higher PCSK9 concentration in SVRs supports previous studies showing that patients who achieved SVR had increased LDL and cholesterol from baseline compared to non-SVRs with both interferon-based and interferon-free therapies (Corey et al., 2009, Meissner et al., 2015). Overall, these results indicate that increase in circulating PCSK9 levels in SVRs is correlated with increased levels of miR-223 and miR-24 as a result of dynamic lipidome-wide changes upon viral cure. Interestingly, these dynamic changes in lipid-associated molecules observed in SVRs also include an increased level of circulating lipoprotein that serves as one of the carrier candidates for miR-223 and miR-24 in the blood (Michell and Vickers, 2016, Vickers et al., 2011, Wagner et al., 2013).
Third, the modulatory effect of PCSK9 on HCV infection was further demonstrated when employing recombinant human wild-type PCSK9 and PCSK9 gain- and loss-of-function mutants in a robust cell culture model of HCV infection. We confirmed that extracellular recombinant wt-PCSK9 inhibits HCV infection. Furthermore, we demonstrated that a gain-of-function PCSK9 mutant (r-D374Y) is much more efficient in inhibiting HCV (EC50 = 0.66 ± 0.05 μg/mL) than wt-PCSK9 (EC50 = 4.63 ± 0.06 μg/mL); this was particularly evident at lower and more physiologically relevant concentrations previously shown to range between 0.033 μg/mL and 3 μg/mL (Lakoski et al., 2009). These results have important implications as a variety of PCSK9 mutations found within the human population may have profound impact on the levels of liver LDLR and may influence host susceptibility to HCV infection and treatment outcomes (Seidah, 2016). HCV particles are associated with lipoprotein components and are termed lipoviroparticles; they interact with the LDLR to promote viral uptake into hepatocytes (Owen et al., 2009).
The findings of our studies are consistent with a previous report showing that stable overexpression of PCSK9 could be used to render Huh-7 cells resistant to HCV infection and that increased extracellular PCSK9 has a suppressive role in HCV infection (Labonte et al., 2009).
Finally, our results showed a decrease in plasma levels of miR-122 after treatment compared to baseline levels in SVRs and increase in plasma levels after treatment in relapsers. Interestingly, the decrease in circulating miR-122 in patients who achieved SVR and the increase in relapsers also correlate with the levels of liver transaminases (Table 2). Our results are consistent with previous studies (van der Meer et al., 2013, Köberle et al., 2013) and underline that the plasma level of miR-122, a liver-specific miRNA acting as a key host factor for HCV replication, is a potential biomarker of HCV cure.
The primary limitation of our studies is that it was conducted on CHC patients with mostly GT1 infection (85% of CHC participants); thus, we cannot generalize the clinical significance of our findings to other prevalent HCV genotypes (GT2 and GT3) around the world. Other limitations of this study include the small number of paired samples before and after treatment in relapsers, and the lack of after-treatment samples in non-responders for measuring changes in circulating miRNA levels and PCSK9. In addition, some patients were receiving lipid-modulating agents, which could have affected plasma miRNAs and PCSK9 levels though the number of these patients was low (3% of CHC patients). Finally, in this cohort, patients were not instructed to fast before blood draws, so lipid levels between patients and between samples collected at different time points of treatment might vary precluding our ability to perform comparative lipidomic analysis of our clinical samples. Such analysis might have provided additional insights into potential association and/or correlation of HCV-induced lipid metabolic changes with four key regulators of lipid homeostasis [miR-122, miR-24, miR-223, and PCSK9] in HCV-infected patients who achieved SVR or did not.
5. Conclusion
Our study indicates an effect of CHC infection on lipid homeostasis via modulation of circulating regulatory markers. Mechanisms of the development of progressive liver disease in HCV-infected patients who achieve a treatment-based viral cure are unclear, but these mechanisms are important to understand for developing appropriate treatment, especially in individuals with late-stage liver fibrosis who remain at ongoing risk of cirrhosis and hepatocellular carcinoma even after they are cured by treatment (Chung and Baumert, 2014). Our data suggest that differential levels of circulating regulators of lipid metabolism may be associated either with treatment outcome or liver disease progression, and these data support further investigation of human metabolic pathways as predictors of progressive liver disease and treatment outcome. Finally, since human PCSK9 is one of the predicted miR-24 target genes (Seidah et al., 2014), the results of our study suggest an intricate interplay between circulating miR-24 and PCSK9 in hepatitis C-infected patients who achieve a treatment-based viral cure. Future studies will be required to explore further the potentially important link between circulating miR-24 and PCSK9 in SVRs, including the cellular origin of circulating miR-24 molecules and their major transport vehicles.
Acknowledgments
Acknowledgements
We would like to thank Darrel Cook and Lori Lee Walston for help with clinical samples and data. Also, we thank Dr. Francis Chisari (Scripps Research Institute, La Jolla, CA, USA) for Huh-7.5.1 cells, Dr. Jill Kelly for proofreading our manuscript, and Steven McArthur for generating EC50 curves in Igor Pro.
Funding Sources
This work was supported by a Canadian Institutes of Health Research (CIHR) grant (MOP-84462) and QIAGEN Sciences LLC (No 14-0810) to FJ. AH acknowledges generous support from a Canadian Network on Hepatitis C (CanHepC) scholarship. ADO acknowledges generous support form a Michael Smith Foundation for Health Research (MSFHR) junior graduate student award. The sponsors (CIHR, QIAGEN Sciences LLC, CanHepC, and MSFHR) had no role in the design and conduct of the study.
Conflict of Interest Statement
The co-authors and corresponding author declare no conflicts of interest. Paul Steven is an employee of QIAGEN Manchester Ltd.
Author Contributions
AH, ADO, and FJ conceived and designed the experiments. ET and MK provided access to the clinical samples and associated biochemical parameters reported in this study. AH performed the microRNA profiling and PCSK9 quantification presented in Fig. 1, Fig. 2, Fig. 3, Fig. 4. ADO evaluated the anti-HCV activity of PCSK9 in cultured cells shown in Fig. 5C–D. AH, ADO, PS, MK, ET, and FJ analyzed the data. AH and FJ wrote the paper. All authors reviewed the results and approved the final version of the manuscript.
Footnotes
Supplementary data to this article can be found online at http://dx.doi.org/10.1016/j.ebiom.2017.08.020.
Contributor Information
Anastasia Hyrina, Email: ahyrina@mail.ubc.ca.
Andrea D. Olmstead, Email: Andrea.Olmstead@bccdc.ca.
Paul Steven, Email: paul.steven@qiagen.com.
Mel Krajden, Email: Mel.Krajden@bccdc.ca.
Edward Tam, Email: etam@laircentre.com.
François Jean, Email: fjean@mail.ubc.ca.
Appendix A. Supplementary data
Supplementary material
References
- Abifadel M., Varret M., Rabes J.P., Allard D., Ouguerram K., Devillers M., Cruaud C. Mutations in PCSK9 cause autosomal dominant hypercholesterolemia. Nat. Genet. 2003;34:154–156. doi: 10.1038/ng1161. [DOI] [PubMed] [Google Scholar]
- Alborn W.E., Cao G., Careskey H.E., Qian Y.W., Subramaniam D.R., Davies J., Conner E.M. Serum proprotein convertase subtilisin kexin type 9 is correlated directly with serum LDL cholesterol. Clin. Chem. 2007;53:1814–1819. doi: 10.1373/clinchem.2007.091280. [DOI] [PubMed] [Google Scholar]
- Bala S., Tilahun Y., Taha O., Alao H., Kodys K., Catalano D., Szabo G. Increased microRNA-155 expression in the serum and peripheral monocytes in chronic HCV infection. J. Transl. Med. 2012;10:151. doi: 10.1186/1479-5876-10-151. [DOI] [PMC free article] [PubMed] [Google Scholar]
- Bassendine M.F., Sheridan D.A., Bridge S.H., Felmlee D.J., Neely R.D. Lipids and HCV. Semin. Immunopathol. 2013;35:87–100. doi: 10.1007/s00281-012-0356-2. [DOI] [PubMed] [Google Scholar]
- Bhattacharya S., Steele R., Shrivastava S., Chakraborty S., Di Bisceglie A.M., Ray R.B. Serum miR-30e and miR-223 as novel noninvasive biomarkers for hepatocellular carcinoma. Am. J. Pathol. 2016;186:242–247. doi: 10.1016/j.ajpath.2015.10.003. [DOI] [PMC free article] [PubMed] [Google Scholar]
- Bottomley M.J., Cirillo A., Orsatti L., Ruggeri L., Fisher T.S., Santoro J.C., Cummings R.T., Cubbon R.M., Lo Surdo P., Calzett a A., Noto A., Baysarowich J., Mattu M., Talamo F., De Francesco R., Sparrow C.P., Sitlani A., Carfí A. Structural and biochemical characterization of the wild type PCSK9 EGF (AB) complex and natural familial hypercholesterolemia mutants. J. Biol. Chem. 2009;284:1313–1323. doi: 10.1074/jbc.M808363200. [DOI] [PubMed] [Google Scholar]
- Cameron J., Holla Ø.L., Berge K.E., Kulseth M.A., Ranheim T., Leren T.P., Laerdah J.K. Investigations on the evolutionary conservation of PCSK9 reveal a functionally important protrusion. FEBS J. 2008;275:4121–4133. doi: 10.1111/j.1742-4658.2008.06553.x. [DOI] [PubMed] [Google Scholar]
- Cermelli S., Ruggieri A., Marrero J.A., Ioannou G.N., Beretta L. Circulating microRNAs in patients with chronic hepatitis C and non-alcoholic fatty liver disease. PLoS One. 2011;6 doi: 10.1371/journal.pone.0023937. [DOI] [PMC free article] [PubMed] [Google Scholar]
- Chen S.L., Morgan T.R. The natural history of hepatitis C virus (HCV) infection. Int. J. Med. Sci. 2006;3:47–52. doi: 10.7150/ijms.3.47. [DOI] [PMC free article] [PubMed] [Google Scholar]
- Chou R., Wasson N. Blood tests to diagnose fibrosis or cirrhosis in patients with chronic hepatitis C virus infection: a systematic review. Ann. Intern. Med. 2013;158:807–820. doi: 10.7326/0003-4819-158-11-201306040-00005. [DOI] [PubMed] [Google Scholar]
- Chung R.T., Baumert T.F. Curing chronic hepatitis C: the arc of a medical triumph. N. Engl. J. Med. 2014;370:1576–1578. doi: 10.1056/NEJMp1400986. [DOI] [PubMed] [Google Scholar]
- Corey K.E., Kane E., Munroe C., Barlow L.L., Zheng H., Chung R.T. Hepatitis C virus infection and its clearance alter circulating lipids: implications for long-term follow-up. Hepatology. 2009;50:1030–1037. doi: 10.1002/hep.23219. [DOI] [PMC free article] [PubMed] [Google Scholar]
- Cortez M.A., Calin G.A. MicroRNA identification in plasma and serum: a new tool to diagnose and monitor diseases. Expert. Opin. Biol. Ther. 2009;9:703–711. doi: 10.1517/14712590902932889. [DOI] [PubMed] [Google Scholar]
- Cunningham D., Danley D.E., Geoghegan K.F., Griffor M.C., Hawkins J.L., Subashi T.A., Varghese A.H. Structural and biophysical studies of PCSK9 and its mutants linked to familial hypercholesterolemia. Nat. Struct. Mol. Biol. 2007;14:413–419. doi: 10.1038/nsmb1235. [DOI] [PubMed] [Google Scholar]
- Dogar A.M., Towbin H., Hall J. Suppression of latent transforming growth factor (TGF)-beta1 restores growth inhibitory TGF-beta signaling through microRNAs. J. Biol. Chem. 2011;286:16447–16458. doi: 10.1074/jbc.M110.208652. [DOI] [PMC free article] [PubMed] [Google Scholar]
- Dubuc G., Tremblay M., Pare G., Jacques H., Hamelin J., Benjannet S., Boulet L. A new method for measurement of total plasma PCSK9: clinical applications. J. Lipid Res. 2010;51:140–149. doi: 10.1194/jlr.M900273-JLR200. [DOI] [PMC free article] [PubMed] [Google Scholar]
- Esau C., Davis S., Murray S.F., Yu X.X., Pandey S.K., Pear M., Watts L. miR-122 regulation of lipid metabolism revealed by in vivo antisense targeting. Cell Metab. 2006;3:87–98. doi: 10.1016/j.cmet.2006.01.005. [DOI] [PubMed] [Google Scholar]
- Felmlee D.J., Hafirassou M.L., Lefevre M., Baumert T.F., Schuster C. Hepatitis C virus, cholesterol and lipoproteins: impact for the viral life cycle and pathogenesis of liver disease. Viruses. 2013;5:1292–1324. doi: 10.3390/v5051292. [DOI] [PMC free article] [PubMed] [Google Scholar]
- Fisher T.S., Lo Surdo P., Pandit S., Mattu M., Santoro J.C., Wisniewski D., Cummings R.T. Effects of pH and low density lipoprotein (LDL) on PCSK9-dependent LDL receptor regulation. J. Biol. Chem. 2007;282:20502–20512. doi: 10.1074/jbc.M701634200. [DOI] [PubMed] [Google Scholar]
- Giannelli G., Mikulits W., Dooley S., Fabregat I., Moustakas A., ten Dijke P., Portincasa P. The rationale for targeting TGF-beta in chronic liver diseases. Eur. J. Clin. Investig. 2016;46:349–361. doi: 10.1111/eci.12596. [DOI] [PubMed] [Google Scholar]
- Goldstein J.L., DeBose-Boyd R.A., Brown M.S. Protein sensors for membrane sterols. Cell. 2006;124:35–46. doi: 10.1016/j.cell.2005.12.022. [DOI] [PubMed] [Google Scholar]
- He L., Hannon G.J. MicroRNAs: small RNAs with a big role in gene regulation. Nat. Rev. Genet. 2004;5:522–531. doi: 10.1038/nrg1379. [DOI] [PubMed] [Google Scholar]
- Hou W., Tian Q., Zheng J., Bonkovsky H.L. MicroRNA-196 represses Bach1 protein and hepatitis C virus gene expression in human hepatoma cells expressing hepatitis C viral proteins. Hepatology. 2010;51:1494–1504. doi: 10.1002/hep.23401. [DOI] [PMC free article] [PubMed] [Google Scholar]
- Janssen H.L., Reesink H.W., Lawitz E.J., Zeuzem S., Rodriguez-Torres M., Patel K., van der Meer A.J. Treatment of HCV infection by targeting microRNA. N. Engl. J. Med. 2013;368:1685–1694. doi: 10.1056/NEJMoa1209026. [DOI] [PubMed] [Google Scholar]
- Jopling C.L., Yi M., Lancaster A.M., Lemon S.M., Sarnow P. Modulation of hepatitis C virus RNA abundance by a liver-specific MicroRNA. Science. 2005;309:1577–1581. doi: 10.1126/science.1113329. [DOI] [PubMed] [Google Scholar]
- Kałużna E.M. MicroRNA-155 and microRNA-196b: promising biomarkers in hepatitis C virus infection? Rev. Med. Virol. 2014;24:169–185. doi: 10.1002/rmv.1785. [DOI] [PubMed] [Google Scholar]
- Kato T., Date T., Miyamoto M., Furusaka A., Tokushige K., Mizokami M., Wakita T. Efficient replication of the genotype 2a hepatitis C virus subgenomic replicon. Gastroenterology. 2003;125:1808–1817. doi: 10.1053/j.gastro.2003.09.023. [DOI] [PubMed] [Google Scholar]
- Köberle V., Waidmann O., Kronenberger B., Andrei A., Susser S., Füller C., Perner D., Zeuzem S., Sarrazin C., Piiper A. Serum microRNA-122 kinetics in patients with chronic hepatitis C virus infection during antiviral therapy. J. Viral Hepat. 2013;20:530–535. doi: 10.1111/jvh.12075. [DOI] [PubMed] [Google Scholar]
- Labonte P., Begley S., Guevin C., Asselin M.C., Nassoury N., Mayer G., Prat A. PCSK9 impedes hepatitis C virus infection in vitro and modulates liver CD81 expression. Hepatology. 2009;50:17–24. doi: 10.1002/hep.22911. [DOI] [PubMed] [Google Scholar]
- Lagace T.A., Curtis D.E., Garuti R., McNutt M.C., Park S.W., Prather H.B., Anderson N.N. Secreted PCSK9 decreases the number of LDL receptors in hepatocytes and in livers of parabiotic mice. J. Clin. Invest. 2006;116:2995–3005. doi: 10.1172/JCI29383. [DOI] [PMC free article] [PubMed] [Google Scholar]
- Lakoski S.G., Lagace T.A., Cohen J.C., Horton J.D., Hobbs H.H. Genetic and metabolic determinants of plasma PCSK9 levels. J. Clin. Endocrinol. Metab. 2009;94:2537–2543. doi: 10.1210/jc.2009-0141. [DOI] [PMC free article] [PubMed] [Google Scholar]
- Landry P., Plante I., Ouellet D.L., Perron M.P., Rousseau G., Provost P. Existence of a microRNA pathway in anucleate platelets. Nat. Struct. Mol. Biol. 2009;16:961–966. doi: 10.1038/nsmb.1651. [DOI] [PMC free article] [PubMed] [Google Scholar]
- Lanford R.E., Hildebrandt-Eriksen E.S., Petri A., Persson R., Lindow M., Munk M.E., Kauppinen S. Therapeutic silencing of microRNA-122 in primates with chronic hepatitis C virus infection. Science. 2010;327:198–201. doi: 10.1126/science.1178178. [DOI] [PMC free article] [PubMed] [Google Scholar]
- LaRosa J.C., Hunninghake D., Bush D., Criqui M.H., Getz G.S., Gotto A.M., Jr., Grundy S.M. The cholesterol facts: a summary of the evidence relating dietary fats, serum cholesterol, and coronary heart disease. A joint statement by the American Heart Association and the National Heart, Lung, and Blood Institute. The Task Force on Cholesterol Issues, American Heart Association. Circulation. 1990;81:1721–1733. doi: 10.1161/01.cir.81.5.1721. [DOI] [PubMed] [Google Scholar]
- Lendvai G., Jármay K., Karácsony G., Halász T., Kovalszky I., Baghy K., Wittmann T., Schaff Z., Kiss A. Elevated miR-33a and miR-224 in steatotic chronic hepatitis C liver biopsies. World J. Gastroenterol. 2014;(41):15343–15350. doi: 10.3748/wjg.v20.i41.15343. [DOI] [PMC free article] [PubMed] [Google Scholar]
- Lin Z.H., Xin Y.N., Dong Q.J., Wang Q., Jiang X.J., Zhan S.H., Sun Y. Performance of the aspartate aminotransferase-to-platelet ratio index for the staging of hepatitis C-related fibrosis: an updated meta-analysis. Hepatology. 2011;53:726–736. doi: 10.1002/hep.24105. [DOI] [PubMed] [Google Scholar]
- Lindow M., Kauppinen S. Discovering the first microRNA-targeted drug. J. Cell Biol. 2012;199:407–412. doi: 10.1083/jcb.201208082. [DOI] [PMC free article] [PubMed] [Google Scholar]
- Liu X., Wang T., Wakita T., Yang W. Systematic identification of microRNA and messenger RNA profiles in hepatitis C virus-infected human hepatoma cells. Virology. 2010;398:57–67. doi: 10.1016/j.virol.2009.11.036. [DOI] [PubMed] [Google Scholar]
- Loveday E.K., Diederich S., Pasick J., Jean F. Human microRNA-24 modulates highly pathogenic avian-origin H5N1 influenza A virus infection in A549 cells by targeting secretory pathway furin. J. Gen. Virol. 2015;96:30–39. doi: 10.1099/vir.0.068585-0. [DOI] [PubMed] [Google Scholar]
- Martinez S.M., Fernandez-Varo G., Gonzalez P., Sampson E., Bruguera M., Navasa M., Jimenez W. Assessment of liver fibrosis before and after antiviral therapy by different serum marker panels in patients with chronic hepatitis C. Aliment. Pharmacol. Ther. 2011;33:138–148. doi: 10.1111/j.1365-2036.2010.04500.x. [DOI] [PubMed] [Google Scholar]
- Matsuzaki K., Murata M., Yoshida K., Sekimoto G., Uemura Y., Sakaida N., Kaibori M. Chronic inflammation associated with hepatitis C virus infection perturbs hepatic transforming growth factor beta signaling, promoting cirrhosis and hepatocellular carcinoma. Hepatology. 2007;46:48–57. doi: 10.1002/hep.21672. [DOI] [PubMed] [Google Scholar]
- Maxfield F.R., Tabas I. Role of cholesterol and lipid organization in disease. Nature. 2005;438:612–621. doi: 10.1038/nature04399. [DOI] [PubMed] [Google Scholar]
- Meissner E.G., Lee Y.J., Osinusi A., Sims Z., Qin J., Sturdevant D., McHutchison J. Effect of sofosbuvir and ribavirin treatment on peripheral and hepatic lipid metabolism in chronic hepatitis C virus, genotype 1-infected patients. Hepatology. 2015;61:790–801. doi: 10.1002/hep.27424. [DOI] [PMC free article] [PubMed] [Google Scholar]
- Michell D.L., Vickers K.C. Lipoprotein carriers of microRNAs. Biochim. Biophys. Acta. 2016;1861:2069–2074. doi: 10.1016/j.bbalip.2016.01.011. [DOI] [PMC free article] [PubMed] [Google Scholar]
- Murakami Y., Tanaka M., Toyoda H., Hayashi K., Kuroda M., Tajima A., Shimotohno K. Hepatic microRNA expression is associated with the response to interferon treatment of chronic hepatitis C. BMC Med. Genet. 2010;3:48. doi: 10.1186/1755-8794-3-48. [DOI] [PMC free article] [PubMed] [Google Scholar]
- Naoumova R.P., Tosi I., Patel D., Neuwirth C., Horswell S.D., Marais A.D., van Heyningen C. Severe hypercholesterolemia in four British families with the D374Y mutation in the PCSK9 gene: long-term follow-up and treatment response. Arterioscler. Thromb. Vasc. Biol. 2005;25:2654–2660. doi: 10.1161/01.ATV.0000190668.94752.ab. [DOI] [PubMed] [Google Scholar]
- Ng R., Wu H., Xiao H., Chen X., Willenbring H., Steer C.J., Song G. Inhibition of miR-24 expression in liver prevents hepatic lipid accumulation and hyperlipidemia. Hepatology. 2014;60:554–564. doi: 10.1002/hep.27153. [DOI] [PMC free article] [PubMed] [Google Scholar]
- Olmstead A.D., Knecht W., Lazarov I., Dixit S.B., Jean F. Human subtilase SKI-1/S1P is a master regulator of the HCV lifecycle and a potential host cell target for developing indirect-acting antiviral agents. PLoS Pathog. 2012;8 doi: 10.1371/journal.ppat.1002468. [DOI] [PMC free article] [PubMed] [Google Scholar]
- Owen D.M., Huang H., Ye J., Gale M., Jr. Apolipoprotein E on hepatitis C virion facilitates infection through interaction with low-density lipoprotein receptor. Virology. 2009;394:99–108. doi: 10.1016/j.virol.2009.08.037. [DOI] [PMC free article] [PubMed] [Google Scholar]
- Pileri P., Uematsu Y., Campagnoli S., Galli G., Falugi F., Petracca R., Weiner A.J., Houghton M., Rosa D., Grandi G., Abrignani S. Binding of hepatitis C virus to CD81. Science. 1998;282:938–941. doi: 10.1126/science.282.5390.938. [DOI] [PubMed] [Google Scholar]
- Qian Y.W., Schmidt R.J., Zhang Y., Chu S., Lin A., Wang H., Wang X. Secreted PCSK9 downregulates low density lipoprotein receptor through receptor-mediated endocytosis. J. Lipid Res. 2007;48:1488–1498. doi: 10.1194/jlr.M700071-JLR200. [DOI] [PubMed] [Google Scholar]
- Rayner K.J., Suárez Y., Dávalos A., Parathath S., Fitzgerald M.L., Tamehiro N., Fisher E.A., Moore K.J., Fernández-Hernando C. MiR-33 contributes to the regulation of cholesterol homeostasis. Science. 2010;328:1570–1573. doi: 10.1126/science.1189862. [DOI] [PMC free article] [PubMed] [Google Scholar]
- Romagnuolo R., Scipione C.A., Boffa M.B., Marcovina S.M., Seidah N.G., Koschinsky M.L. Lipoprotein(a) catabolism is regulated by proprotein convertase subtilisin/kexin type 9 through the low density lipoprotein receptor. J. Biol. Chem. 2015;290:11649–11662. doi: 10.1074/jbc.M114.611988. [DOI] [PMC free article] [PubMed] [Google Scholar]
- Seidah N.G. New developments in proprotein convertase subtilisin-kexin 9's biology and clinical implications. Curr. Opin. Lipidol. 2016;27:274–281. doi: 10.1097/MOL.0000000000000295. [DOI] [PubMed] [Google Scholar]
- Seidah N.G., Awan Z., Chretien M., Mbikay M. PCSK9: a key modulator of cardiovascular health. Circ. Res. 2014;114:1022–1036. doi: 10.1161/CIRCRESAHA.114.301621. [DOI] [PubMed] [Google Scholar]
- Selitsky S.R., Dinh T.A., Toth C.L., Kurtz C.L., Honda M., Struck B.R., Kaneko S., Vickers K.C., Lemon S.M., Sethupathy P. Transcriptomic analysis of chronic hepatitis B and C and liver cancer reveals microRNA-mediated control of cholesterol synthesis. MBio. 2015;6:e01500. doi: 10.1128/mBio.01500-15. [DOI] [PMC free article] [PubMed] [Google Scholar]
- Serfaty L., Andreani T., Giral P., Carbonell N., Chazouilleres O., Poupon R. Hepatitis C virus induced hypobetalipoproteinemia: a possible mechanism for steatosis in chronic hepatitis C. J. Hepatol. 2001;34:428–434. doi: 10.1016/s0168-8278(00)00036-2. [DOI] [PubMed] [Google Scholar]
- Shirakawa H., Matsumoto A., Joshita S., Komatsu M., Tanaka N., Umemura T., Ichijo T. Pretreatment prediction of virological response to peginterferon plus ribavirin therapy in chronic hepatitis C patients using viral and host factors. Hepatology. 2008;48:1753–1760. doi: 10.1002/hep.22543. [DOI] [PubMed] [Google Scholar]
- Shirasaki T., Honda M., Shimakami T., Horii R., Yamashita T., Sakai Y., Sakai A., Okada H., Watanabe R., Murakami S., Yi M., Lemon S.M., Kaneko S. MicroRNA-27a regulates lipid metabolism and inhibits hepatitis C virus replication in human hepatoma cells. J. Virol. 2013;87:5270–5286. doi: 10.1128/JVI.03022-12. [DOI] [PMC free article] [PubMed] [Google Scholar]
- Singaravelu R., Chen R., Lyn R.K., Jones D.M., O'Hara S., Rouleau Y., Cheng J. Hepatitis C virus induced up-regulation of microRNA-27: a novel mechanism for hepatic steatosis. Hepatology. 2014;59:98–108. doi: 10.1002/hep.26634. [DOI] [PubMed] [Google Scholar]
- Sterling R.K., Lissen E., Clumeck N., Sola R., Correa M.C., Montaner J. Development of a simple noninvasive index to predict significant fibrosis in patients with HIV/HCV coinfection. Hepatology. 2006;43:1317–1325. doi: 10.1002/hep.21178. [DOI] [PubMed] [Google Scholar]
- Ujino S., Nishitsuji H., Hishiki T., Sugiyama K., Takaku H., Shimotohno K. Hepatitis C virus utilizes VLDLR as a novel entry pathway. Proc. Natl. Acad. Sci. U. S. A. 2016;113:188–193. doi: 10.1073/pnas.1506524113. [DOI] [PMC free article] [PubMed] [Google Scholar]
- van der Meer A.J., Farid W.R.R., Sonneveld M.J., de Ruiter P.E., Boonstra A., van Vuuren A.J., Verheij J., Hansen B.-E., de Knegt R.J., van der Laan L.J.-W., Janssen H.L.A. Sensitive detection of hepatocellular injury in chronic hepatitis C patients with circulating hepatocyte-derived microRNA-122. J. Viral. Hepat. 2013;20:158–166. doi: 10.1111/jvh.12001. [DOI] [PubMed] [Google Scholar]
- Vickers K.C., Palmisano B.T., Shoucri B.M., Shamburek R.D., Remaley A.T. MicroRNAs are transported in plasma and delivered to recipient cells by high-density lipoproteins. Nat. Cell Biol. 2011;13:423–433. doi: 10.1038/ncb2210. [DOI] [PMC free article] [PubMed] [Google Scholar]
- Vickers K.C., Shoucri B.M., Levin M.G., Wu H., Pearson D.S., Osei-Hwedieh D., Collins F.S. MicroRNA-27b is a regulatory hub in lipid metabolism and is altered in dyslipidemia. Hepatology. 2013;57:533–542. doi: 10.1002/hep.25846. [DOI] [PMC free article] [PubMed] [Google Scholar]
- Vickers K.C., Landstreet S.R., Levin M.G., Shoucri B.M., Toth C.L., Taylor R.C., Palmisano B.T. MicroRNA-223 coordinates cholesterol homeostasis. Proc. Natl. Acad. Sci. U. S. A. 2014;111:14518–14523. doi: 10.1073/pnas.1215767111. [DOI] [PMC free article] [PubMed] [Google Scholar]
- Wagner J., Riwanto M., Besler C., Knau A., Fichtlscherer S., Roxe T., Zeiher A.M. Characterization of levels and cellular transfer of circulating lipoprotein-bound microRNAs. Arterioscler. Thromb. Vasc. Biol. 2013;33:1392–1400. doi: 10.1161/ATVBAHA.112.300741. [DOI] [PubMed] [Google Scholar]
- Willeit P., Zampetaki A., Dudek K., Kaudewitz D., King A., Kirkby N.S., Crosby-Nwaobi R. Circulating microRNAs as novel biomarkers for platelet activation. Circ. Res. 2013;112:595–600. doi: 10.1161/CIRCRESAHA.111.300539. [DOI] [PubMed] [Google Scholar]
- Wittmann J., Jack H.M. Serum microRNAs as powerful cancer biomarkers. Biochim. Biophys. Acta. 2010;1806:200–207. doi: 10.1016/j.bbcan.2010.07.002. [DOI] [PubMed] [Google Scholar]
Associated Data
This section collects any data citations, data availability statements, or supplementary materials included in this article.
Supplementary Materials
Supplementary material