Abstract
The clinical use of elastography for monitoring fibrosis progression is challenged by the subtle changes in liver stiffness associated with early stage fibrosis, and the comparatively large variance of stiffness estimates provided by elastography. Single Tracking Location Shear Wave Elasticity Imaging (STL-SWEI) is an ultrasound elastography technique that was previously demonstrated to provide improved estimate precision compared to Multiple Tracking Location (MTL) SWEI. As a result of improved precision, it is reasonable to expect that STL-SWEI would provide improved ability to differentiate liver fibrosis stage compared to MTL-SWEI. However, this expectation has not been previously challenged rigorously. In this work, the performance of STL- and MTL-SWEI in the setting of a rat model of liver fibrosis is characterized and the advantages of STL-SWEI in staging fibrosis are explored. The purpose of this study is to determine what advantages, if any, arise from utilizing STL-SWEI instead of MTL-SWEI in the characterization of fibrotic liver. Thus, the ability of STL-SWEI to differentiate livers at various METAVIR fibrosis scores, for ex vivo, post-mortem measurements, is explored. In addition, we examine the effect of the common confounding factor of fluid versus solid boundary conditions in SWEI experiments. Sprague-Dawley rats are treated with carbon tetrachloride over several weeks to produce liver disease of varying severity. STL and MTL stiffness measurements were performed ex vivo and compared to the METAVIR score from histological analysis and the duration of treatment. A strong association was observed between liver stiffness and weeks of treatment with the liver toxin carbon tetrachloride. Direct comparison of STL- and MTL-SWEI measurements show no significant difference in ability to differentiate fibrosis stages based on SWEI image mean values. However, image interquartile range is greatly improved in the case of STL-SWEI imaging compared to MTL-SWEI at small beam spacings.
Keywords: Ultrasound Elastography, Shear Wave Elasticity Imaging, Liver Fibrosis, Signal Processing, Scholte Waves
Introduction
Transient Elastography (TE; FibroScan) has been established as a clinical tool for evaluation of liver fibrosis (Foucher et al., 2006). Liver stiffness estimates provided by TE have been shown to not only correlate with liver fibrosis, but also with hepatic inflammation and central venous pressure (Georges et al., 2007; Millonig et al., 2010). Additionally, steatosis has been shown to alter the measured viscosity of liver independent of the fibrosis for Magnetic Resonance Elastography (MRE) and crawling wave elastography (Salameh et al., 2009; Barry et al., 2012). However, since TE does not account for the viscosity, steatosis also confounds the measurement of fibrosis. Collagen deposition in fibrosis is still considered to be a major contributor to stiffness, but these confounding factors must be considered when assessing the stiffness of the liver measured by elastography. Along these lines, several groups have investigated the application of alternative elastography techniques to fibrosis staging in animal and human studies (Palmeri et al., 2008; Chen et al., 2013a, b; DOnofrio et al., 2013; Salameh et al., 2009)
Single Tracking Location (STL)-Shear Wave Elasticity Imaging (SWEI) is a technique for estimating the shear stiffness of materials using Acoustic Radiation Force (ARF) to generate shear waves that are tracked using pulse-echo imaging along a single tracking location (McAleavey et al., 2007, 2009). The utility of STL-SWEI in the setting of liver fibrosis in a rat model is unclear. We previously showed that STL-SWEI provides better precision than similar MTL-SWEI based techniques (Elegbe and McAleavey, 2013) and this has been verified independently in Hollender et al. (2015). However, it is unknown whether this offers any advantage to STL-SWEI in the setting of estimating fibrosis score. Thus, we seek to compare these two methods in the setting of a liver fibrosis model below.
In this work, estimates of the liver stiffness are made comparing both STL and MTL measurement using a cross-correlation of the pairs of impulsive shear wave excitations as in McAleavey et al. (2007) and utilizing the GPU-based implementation discussed in Langdon and McAleavey (2015). The resulting measurements are compared to the METAVIR fibrosis score for the livers as determined by analysis of the histology by a board certified pathologist. Previous Shearwave Dispersion Ultrasound Vibrometry (SDUV) studies have also examined the utility of shear wave elastography in rat liver fibrosis models (Chen et al., 2013b; Zhu et al., 2014a). Unlike in previous studies, we do not use a solid-solid boundary condition for our measurements as the time required to set samples in gelatin increases the coagulation following excision and typically requires the sample to cool to room temperature. However, this can lead to the production of a type of surface wave known as a Scholte wave that we previously examined in the setting of engineered tissue characterization (Mercado et al., 2015). Therefore, the effect of these surface waves on SWEI measurements of ex-vivo rat livers is also explored below.
Methods
Animal Preparation
66 male Sprague-Dawley rats, weighing 300–400g, were acquired for this experiment following protocol approval by the University Committee on Animal Resources (UCAR). The rats were housed at the University of Rochester School of Medicine and Dentistry vivarium in a 12:12 hour light:dark cycle room with two rodents per cage. Rats were identified using an ear punch numbering system.
Following the dosing procedures of our previous study, 56 rats were treated with intra-peritoneal injections of a 1:4 carbon tetrachloride:olive oil solution to induce liver fibrosis. Carbon tetrachloride is a well-known model for generating liver fibrosis that approximates alcoholic liver disease (Tamayo, 1983; McLean et al., 1969). Injections were performed at the rat’s vivarium housing unit 3 times per week. Our control group consisted of 10 rats that were euthanized and scanned without injection.
Carbon tetrachloride treated rats were sacrificed at various time points ranging from 0–9 weeks with a roughly even distribution. Since the control rats did not recieve any treatment, they were not sacrificed on a particular schedule. Post hoc analysis demonstrated a METAVIR fibrosis score progression rate of approximately one stage every 1–2 weeks. During the study, three rats died prematurely due to complications of cirrhosis (approximately 5%). Three additional rats were unable to be analyzed due inadequate histological samples. Finally, 2 rats other rats were excluded secondary to technical problems in the data acquisition process (introduced gas bubbles and incorrect imaging mode). As a result, 58 rats are included in our analysis.
Animals were euthanized and scanned with ultrasound at our lab facilities. All animals were euthanized by anesthetic overdose using either pentobarbital or a ketamine/xylazine mixture. Immediately upon cessation of breathing, the animals were shaved, and in situ images were acquired. These images are not included in the analysis of this study. Subsequenty, the liver was removed, and a series of ex vivo scans immediately followed. In the scan series, the left lobe, median lobe, and the right lobe were scanned in that order. Results for the left and median lobe are presented here. The caudate lobe was not utilized, as it was too small to scan with our system.
Ultrasound Settings and Processing
All of the following imaging experiments were performed using a Siemens Antares ultrasound scanner and our in-house elasticity software (Langdon and McAleavey, 2015). A VF 10-5 linear array transducer operating at 5.7 MHz, focal depth of 2 cm, a PRF of 10.5 kHz, and an F/# of 3.5 was used throughout the study. SWEI images were acquired using various tracking offsets and beam spacings as discussed below. Each image was acquired 10 times to allow averaging of the speckle displacement data following windowed normalized cross-correlation of the raw A-line data. This is referred to here as an “averaging set.” This requires 2–4 minutes of acquisition time at 12 seconds per image. This imaging rate allows for the transducer to cool between acquisitions but was mostly limited by data transfer time. The images were available for review in real time.
Following initial STL-SWEI linear modulus estimation, a region of interest (ROI) was manual segmented in our software by the end-user. The segmentation of the SWEI data outlines the area of the bmode image containing the rat liver. A median value and interquartile range was extracted from the SWEI data within this ROI. Of note, the STL-SWEI measurement will be referred to as the “Apparent Shear Stiffness” since it is not the true shear stiffness due to the boundary effects as discussed below.
In post-analysis, the SWEI stiffness estimate means were sorted by fibrosis score. Statistical comparisons were performed using permutation tests on the mean difference between each pair-wise fibrosis stage grouping. This type of statistical test is appropriate when the underlying distribution of the groups is not known to be Gaussian and a thorough discussion can be found in Good (2013). It was chosen to avoid the assumption that shear wave stiffness will have a Gaussian distribution in each fibrosis group. Monte Carlo randomizations were used to build out the distribution of the test statistic under the null hypothesiss. 100,000 randomizations were used for each pair-wise comparison. Since computational power was not a limiting factor, no stopping criteria were utilized. The results were then reported as a p-value indicating the location of the test statistic under the original arrangement of the data within the distribution of the null hypothesis.
Histology and Fibrosis Scoring
After completing SWEI imaging of the liver samples, a thin 1–2 mm slice of each of the lobes was made and fixed in formalin. Following adequate fixation, slides were made from the samples stained with Gomori Trichrome. The resulting Trichrome images were used by a trained pathologist (RSG) to determine the METAVIR fibrosis score. A series of representative liver histological images are shown in Figure 1.
Figure 1.
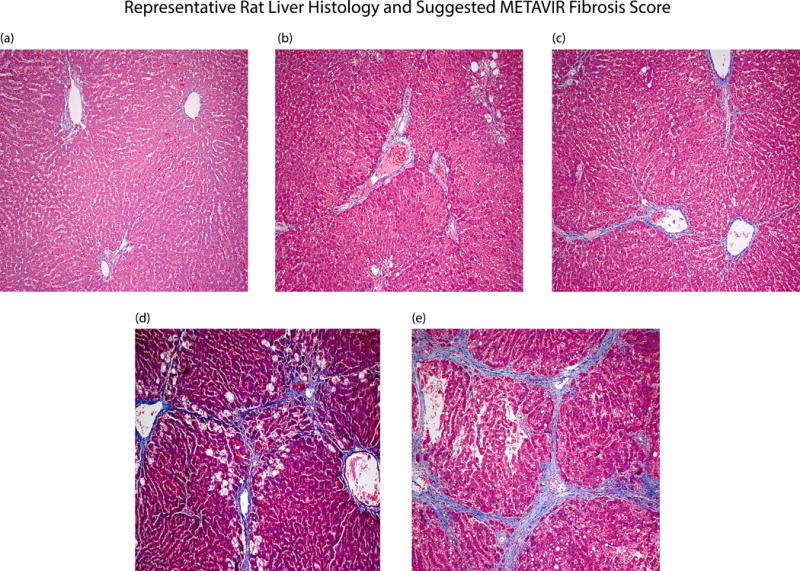
Representative histological images from this liver fibrosis study are depicted. Fibrosis score F0 (a) is seen to have no apparent scarring of the liver tissue. In F1 livers (b) there is minimal scarring, restricted to the portal triad. Scarring beyond the portal triad begins to be seen in F2 livers (c). Bridging fibrosis is observed in F3 liver (d) and fully formed nodular cirrhosis is evident in F4 livers (e).
SWEI Measured Liver Stiffening Over Dosing Period
The liver was removed from the rat and cut into individual lobes. Cutting the liver this way has the advantage of allowing the liver to be laid flat and for each lobe to be interrogated separately. The liver was then placed in warm saline with a temperature maintained between 36° and 39°C. This corresponds to rat body temperature. A representative STL-SWEI image of a rat liver’s left lobe is shown in Figure 2. The area of overlayed SWEI data represents the user segmented ROI. The left lobe was scanned with STL only and this data was used for post-hoc analysis of the fibrosis progression over the study. Push beam spacing was set to 1.60 mm for this experiment with a tracking offset of 3.00 mm.
Figure 2.
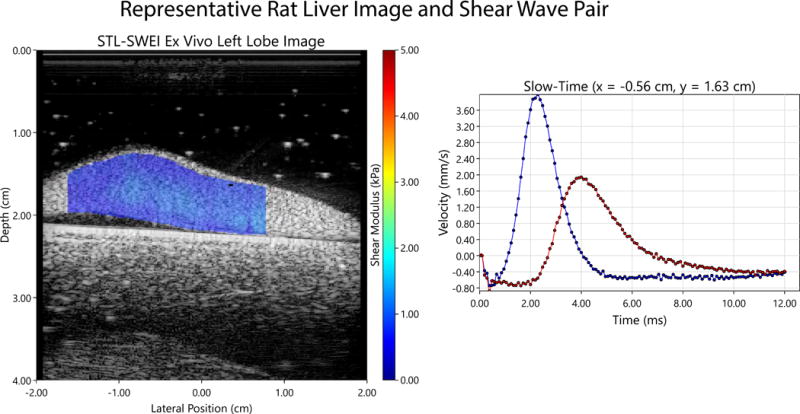
A representative STL-SWEI image of an ex vivo rat liver’s left lobe is shown (left). The left lobe’s characteristic appearance includes a long lateral extent (typically 4–5 cm) with an approximately 1 cm height at its maximum. The elevational extent of the liver is approximately 2 cm. The appearance of a typical pair of shear wave traces forming this ex vivo image is also shown (right).
Ex Vivo Comparison of STL- and MTL-SWEI
After completing the above experiments on the left lobe, the median lobe was scanned using a series of STL and MTL sequences. A track beam offset of 3.00 mm was utilized with three different beam spacings, 1.60, 0.80, and 0.20 mm. Note that 0.20 mm is the minimum STL-SWEI beam spacing corresponding to the pitch of the VF 10-5 linear array. Averaging sets of 10 images were acquired for each beam spacing. The purpose of this experiment was to determine what benefit, if any, using STL-SWEI instead of MTL-SWEI may have in characterizing the liver tissue samples. In addition to determining the STL/MTL mean for each averaging set, image characteristics, such as modulus variation over the ROI, were also explored. The data is presented here only for the F0 case for clarity. The beam position precision needed to make this measurement for the 0.2 mm case was not available at the beginning of the animal series. Therefore, the first two F0 rats of the series are not included leaving 15 rats for this analysis. The full data set at a fixed beam spacing of 1.60 mm is also presented. This beam spacing will be demonstrated to be a critical value below. Therefore, only the 42 rats for which this value is fixed are included below.
Agar Embedded Livers
Scholte waves, described originally in Scholte (1949), are a source of measurement error in SWEI imaging (Mercado et al., 2015). The formulae in Vinh (2013) can be used to predict a surface wave speed at 84% of the shear wave speed for incompressible media at a solid-fluid interface. To determine what bias these waves may introduce to our measurements a subset of the rat livers were embedded in agarose following initial scans. Left liver lobes were placed in a 0.7% Agarose (wt/wt). The agarose is initially heated to 90°C to achieve transparency. It is then allowed to set at room temperature for 1 hour. The liver is gently placed into the agarose as it begins to set as noted by increased opacity of the solution. After acquiring a set of 10 shear modulus images, the agarose was disrupted, restoring a fluid boundary condition. The imaging was repeated to observe the decrease in apparent wave speed associated with Scholte waves. Since this surface wave effect was not noted until after the study was started only the latter 51 rats were included. Representative wave propagation images, acquired by fixing the track beam position and varying the push beam over several acquisitions, are included to demonstrate the appoximate depth of Scholte wave penetration.
Results
Liver Stiffening Over Dosing Period
Examining the left lobe data with respect to week of treatment, a relationship between the number of weeks of treatment and the measured stiffness can be observed. In this way biases in the analysis of the histology data are avoided at the cost of no “gold” standard for comparison. In Figure 3, we see a strong linear relationship between the weeks of doses and the shear stiffness over the first 3 fibrosis stages (r2=0.87). The relationship is less robust over the full range of fibrosis scores with r2 = 0.78.
Figure 3.
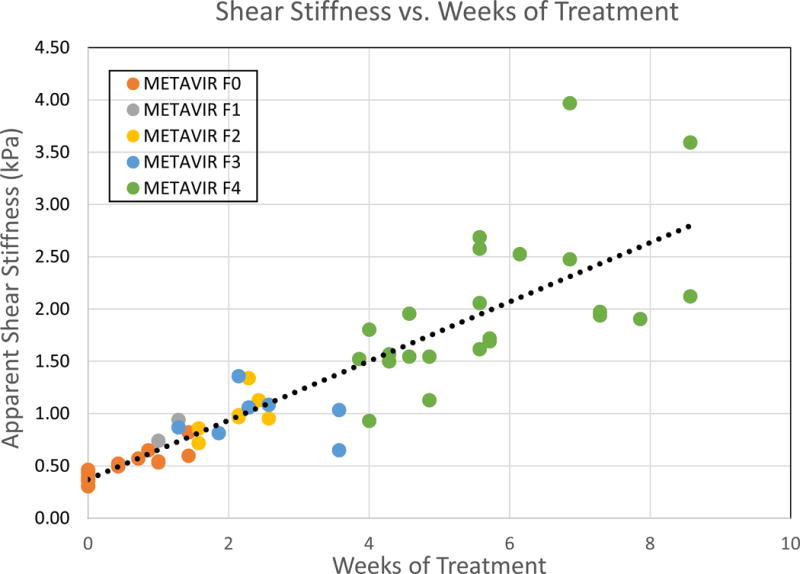
The apparent shear stiffness as measured using STL-SWEI is compared to the number of weeks of treatment. A linear fit to the data is provided with a slope of 0.283 kPa/week and and intercept of 0.37 kPa. The r2 -value for this fit is 0.78.
Figure 4 compares the the apparent shear stiffness as a function of Fibrosis Stage. There is a notable significant difference in the mean shear stiffnees between the F0 rats and the F1–F4 rats and between the F0–F3 rats and the F4 rats. However, no significant difference was shown for comparisons between the F1–F3 rats.
Figure 4.
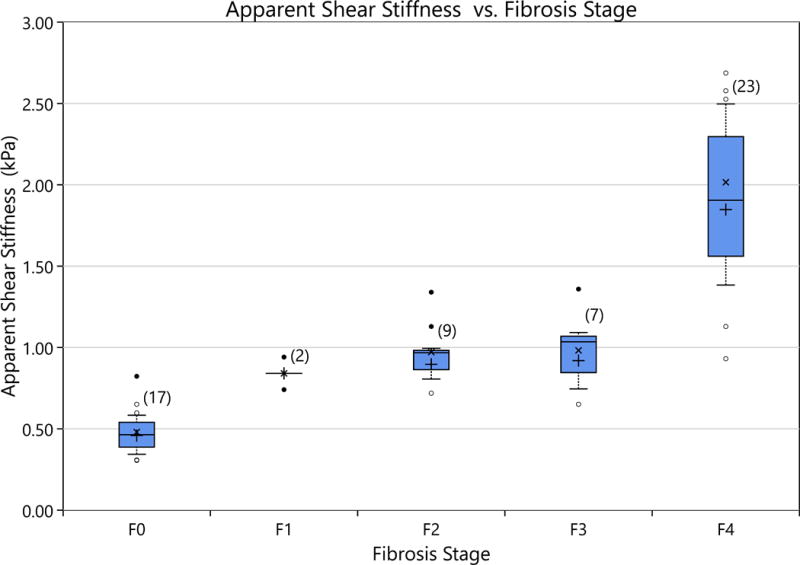
The apparent stiffness values as measured STL-SWEI for ex-vivo rat livers (left lobe) are compared by fibrosis stage The distribution of data is represented by the box plots. The top and bottom of each box represents the 75th and 25th percentiles, respectively. The middle horizontal line in each box is the median value. The whiskers are 1.5 times the interquartile range. The open circles represent data points within three times the interquartile range. The closed circles are data points that are located at greater than three times the interquartile range and are considered outliers. The ‘x’ indicates the distribution’s true mean and the plus sign, the mean when outliers are trimmed out. The number above each box indicates the number of rats in the assigned group. A significant difference (p-value ¡ 0.05) is seen between F0 livers and the F1–F4 cases, as well as between the F4 case and the F0–F3 cases.
Ex Vivo Comparison of STL- and MTL-SWEI
Representative MTL and STL images, with a varying beam spacings and a fixed tracking offset of 3.00 mm, are shown in Figure 5. This demonstrated increasingly noisy MTL-SWEI images compared to STL-SWEI images with decreasing track beam spacing. A comparison of the apparent shear stiffness measurements of the rat liver median lobes are shown in Figure 6 for F0 rats. It is seen that there is a significant difference in the mean STL- or MTL-SWEI derived apparent stiffness comparing the three various beam spacings (Figure 6, left). The observed trend is towards lower shear stiffness with increasing beam spacing. There is also no significant difference in the interquartile range (IQR) of the mean apparent shear stiffness over all F0 rats. However, there is a significant difference in the ratio of the measurment interquartial range / mean stiffness comparing STL and MTL in the 0.2 and 0.8 mm cases (Figure 6, right). Note that the IQR in this case is the referring to the range of measurements within a rat liver and not the range of mean measurements over all rats. This is a surrogate for the noisiness of the image.
Figure 5.
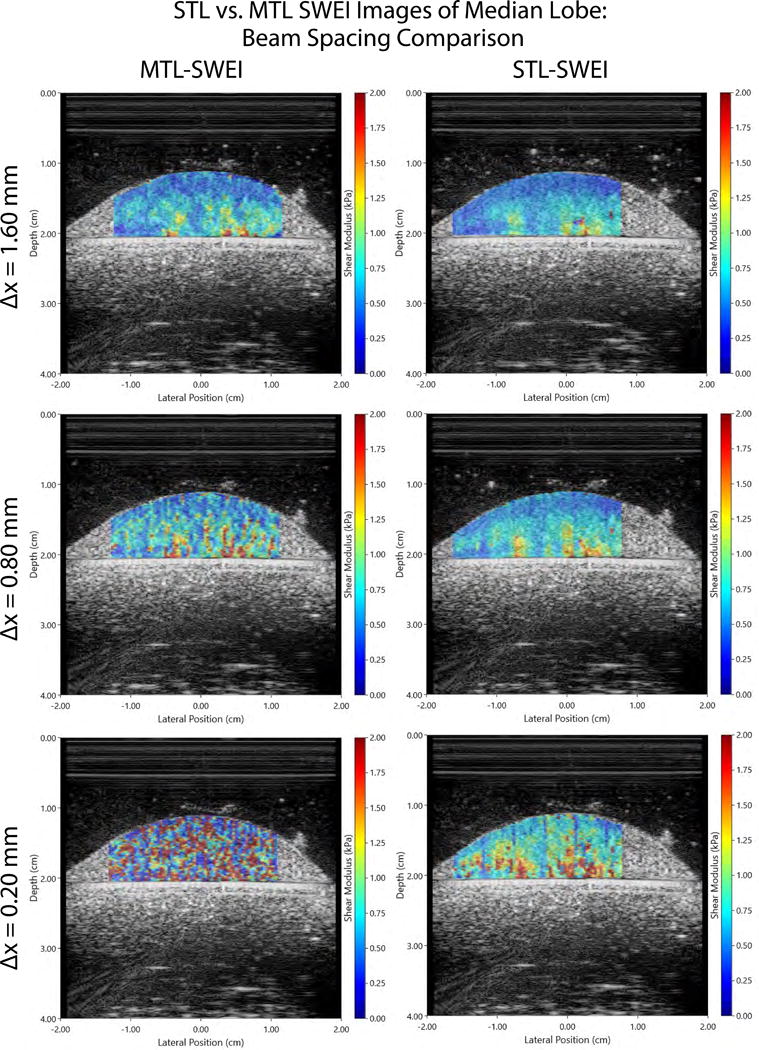
MTL- and STL-SWEI shear stiffness (modulus) images are directly compared over various beam spacings and a fixed tracking offset of 3.00 mm. Subjective image quality is seen to diminish markedly with decreasing beam spacing in the MTL case. In the STL case, the image quality is relatively constant over the various beam spacings.
Figure 6.
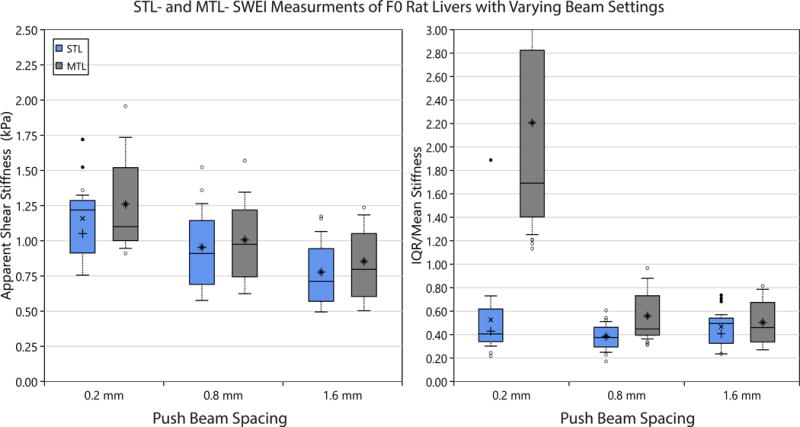
The apparent stiffness (left) and the ratio of Interquartile-Range / Mean stiffness (right) are depicated for measurements of rat liver (median lobe) using STL- and MTL-SWEI at various beam spacings. A subset of 15 F0 rats are analyzed. Box plots are as described in Figure 4. Mean apparent shear stiffness (left) is seen to be significantly different (p-value ¡ 0.05) comparing beam spacings for both the STL and MTL cases. However, there is no pair-wise difference in the mean apparent shear stiffness between MTL and STL at any given beam spacing. Comparing the ratio of IQR/Mean in each rat liver iamge for STL and MTL (right), STL is seen to produce a significantly decreased ratio in the 0.2 mm and 0.8 mm cases. A significant difference in the IQR/Mean ratio is not demonstrated between STL measurement with respect to beam spacing. However, a significant difference is noted between the 0.2 mm beam spacing case and the 0.8 mm and 1.6 mm cases for MTL-SWEI.
Figure 7 compares MTL and STL with fixed beam spacing of 1.60 mm. Performance in differentiating fibrosis stages is comparable between the STL and MTL cases. A significant step increase in the apparent shear stiffness for the F0 to F1 case. There is no significant difference noted between the F1, F2, F3, and F4 cases. Of note, there is no clear reason for the outliers in the F2 case and it should be noted that the measured stiffness for this particular rat was not an outlier for the left lobe case in Figure 4. This is potentially due to the scoring being based on the left lobe histology.
Figure 7.
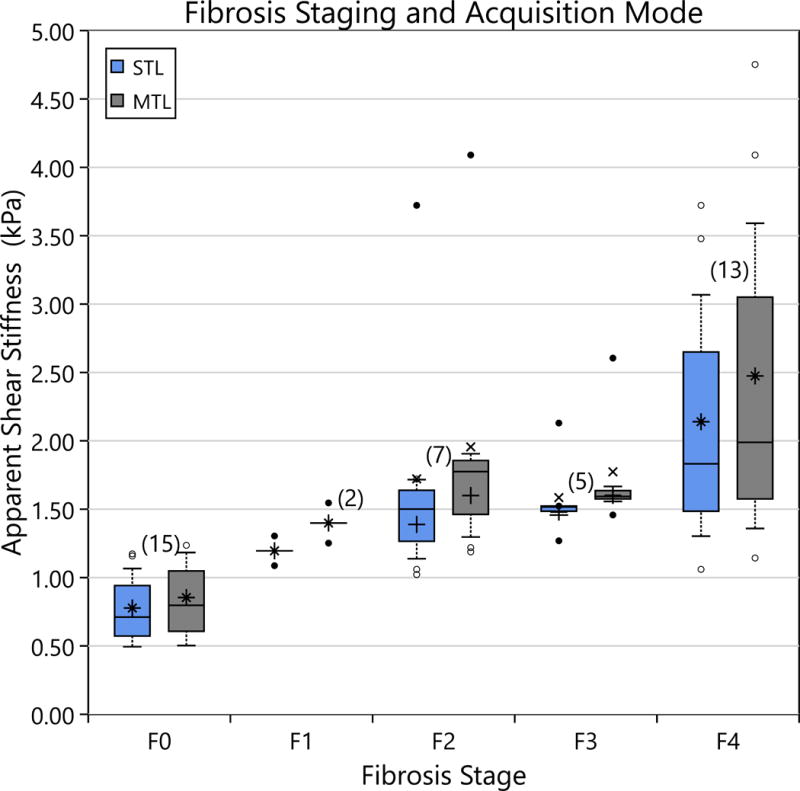
The apparent shear stiffness as a function of Fibrosis stage is shown for rat liver median lobes. Box plots are as described in Figure 4. A significant difference is demonstrated between the mean stiffness of F0 rats and the other stages. There is no demonstrable difference in STL vs. MTL performance in differentiating fibrosis stages.
Agarose Embedded Livers
Representative before and after agarose STL-SWEI images are shown in Figure 8 demonstrating a drop in the apparent shear stiffness between each image. Figure 9 demonstrates the propagation of waves through liver during STL-SWEI imaging. There is no distinct surface wave observed in the in the agar case but a distinct Scholte wave penetrating 3–4 mm into the tissue with a large tail in the fluid boundary case. The shear wave component is seen to rapidly attenuate relative to the Scholte wave.
Figure 8.
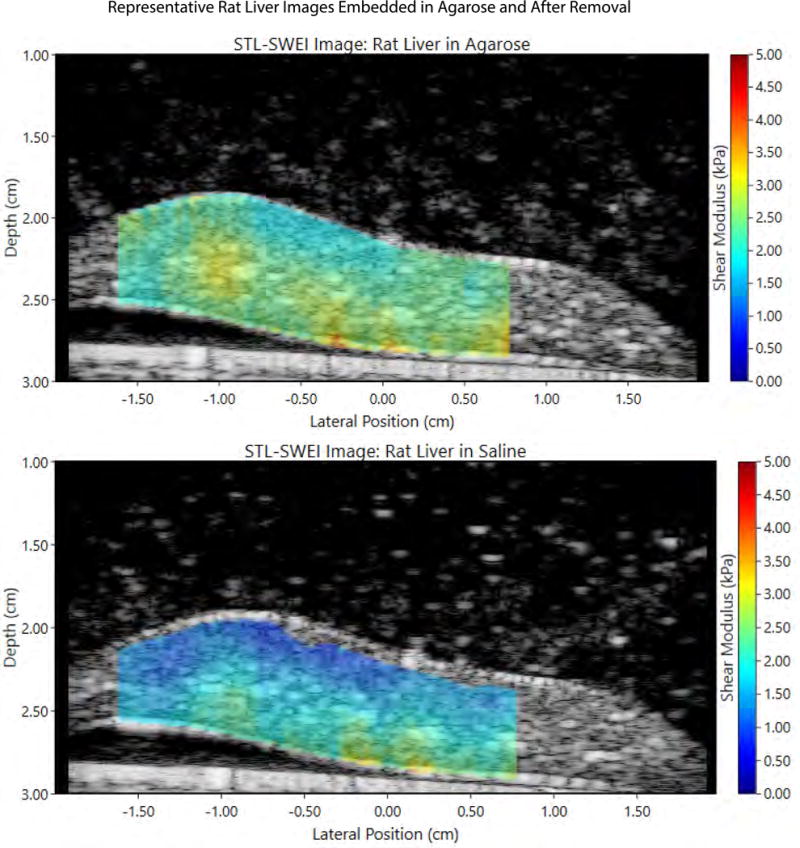
A representative pair of images demonstrates STL-SWEI reconstructions of a rat liver embedded in agar (top) and the same liver after disruption of the agar (bottom). The liver surface is at approximately 2 cm, coincident with the ARF focus. There is a noticeable drop in the measured shear modulus between the two images.
Figure 9.
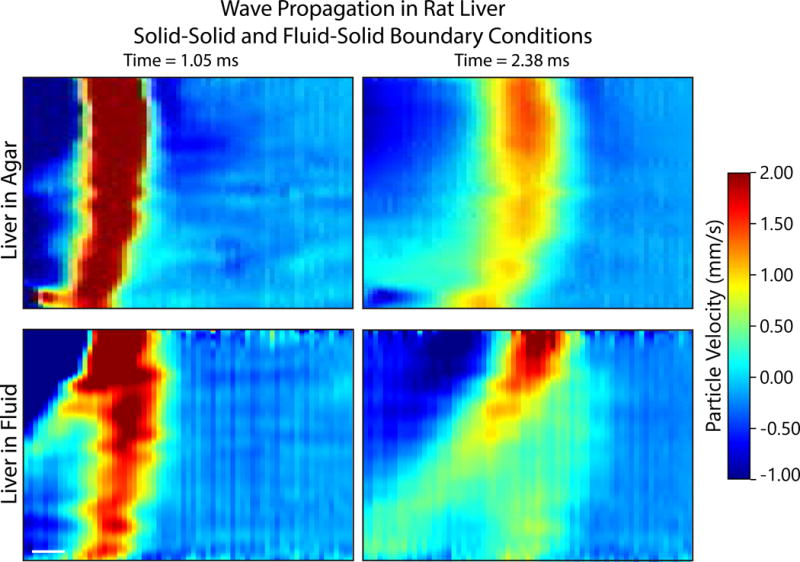
Representative STL based wave propagation images for a rat liver embedded in agar (top row) and in saline (bottom row) at two different time points each (columns). The interface between the surrounding media and the liver occurs at the top edge of each image. For the saline case (bottom row) a seperate, Scholte wave can be seen to form and the shear wave component is rapidy attenuated. The scholte wave penetrates 3–4 mm. While Stoneley waves may form at a solid-solid interface, there does not appear to the formation of a strong, clearly seperate surface wave in the agar embedded case.
Room temperature measurements of rat liver left lobes ex vivo are shown in Figure 10. The measurements are shown for both the liver embedded in solid agarose and the liver in fluid cases. Measurements in fluid are markedly lower than those observed for embedded livers. Of note, the stiffness of the Agarose (which is challenging to contol in this setting) vaaried with a mediance value of 1.38 kPa and IQR [0.20, 2.00] kPa. There is overlap between the cases resulting in, for example, the F0 liver in solid agarose case overlapping in shear stiffness with the F2 in fluid case. The ratios of the wave speeds of the embedded to the fluid boundary cases, with respect to fibrosis stage, are shown in Figure 11. There is no significant difference in the decrease in the wave speed ratio with respect to fibrosis score. The average wave speed ratio was found to be 0.88 with an SEM of 0.01.
Figure 10.
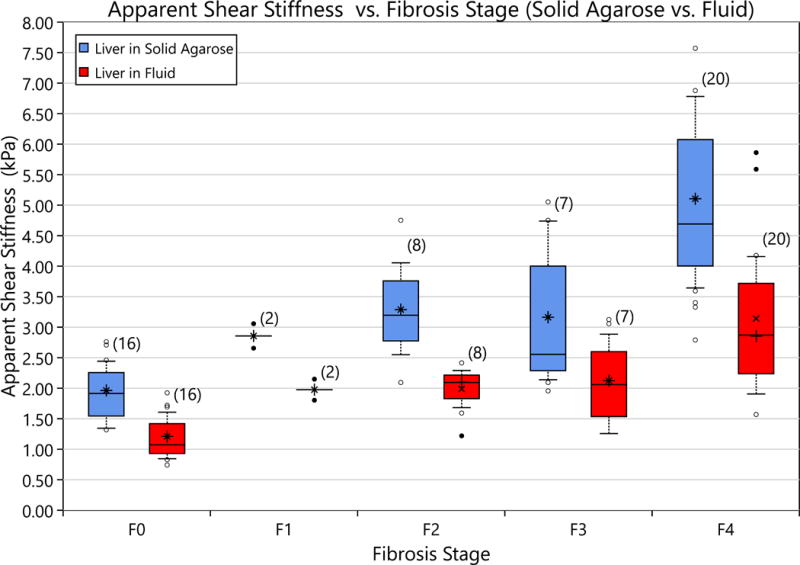
The apparent shear modulus measured both in agarose and in saline is compared to the liver fibrosis stage. The asterisk represents the average value, the center bar is the median value, the top of the box is the 75th percentile and the bottom is the 25th percentile. The top whisker represents the 90th percentile and the bottom whisker is the 10th. Of note, the shift in modulus is sufficient to cause different fibrosis stages to overlap in shear modulus that do not overlap when only one boundary condition is considered.
Figure 11.
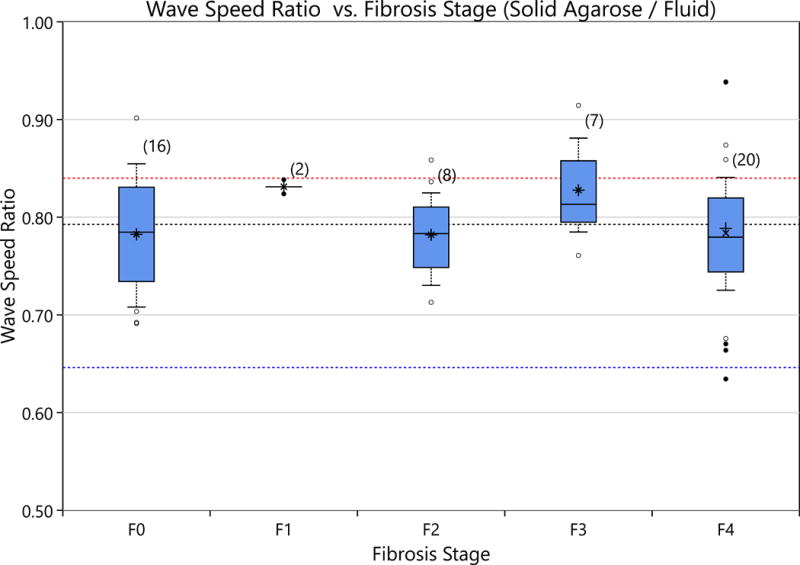
The ratio of the Scholte wave to the shear wave is shown for various fibrosis stages. There is no significant difference between the various fibrosis stages and the speed ratio. The average speed ratio was found to be 0.80 (black dashed line) with an standard error in the mean of 0.01. This result is below the theory predicted values of 0.84 (red dashed line) using the formulae in Vinh (2013). The blue line represents the theoretical result of correlating a shear wave with a Scholte wave.
Discussion
In this series of rat liver experiments, the degree of correlation between MTL and STL has been compared. It was seen that STL- and MTL-SWEI demonstrated no significant difference in the mean rat liver stiffness estimates as a function of fibrosis (Figure 7) and neither demonstrates a signifiant difference in modulus estimates for the F1–F3 cases. Therefore, this study does not demonstrate a clearly improved performance of STL-SWEI vs. MTL-SWEI for differentiating fibrosis stage. In fact, confounding factors such as beam spacing (Figure 6) and boundary conditions (Figure 7) appear to play a larger role in determining the measured stiffness than the mode of acquisition. It is notable that in Figure 6 there is a marked increase the interquartile range (IQR) in the MTL case as beam spacing decreases than in the STL case. For the purpose of staging liver fibrosis, where a global estimate is sought, this advantage does not lead to any net benefit. Thus, in the clinical scenario it is reasonable to use either method with sufficiently large beam spacings. However, STL is not without merit. Instead, this result informs the future direction of STL applications. Rather than make global estimates, STL may be best applied to imaging problems where images of variations in tissue are required.
In Chen et al. (2013b), the authors performed a comparable study using carbon tetrachloride induced fibrosis in rats. The study also used shear wave elastography but in the form of Shearwave Ultrasound Dispersion Vibrometry (SDUV). Their experimental system requires a driving ultrasound probe to generate a periodic shear wave at a given frequency as opposed to our configuration that uses an impulse. An additional linear array probe is then used for image acquisition. For practical purposes (i.e. minimimizing reflections and providing a sufficient target surface for the two probe configuration) the samples must be embedded in gelatin. However, this can lead to key differences between our studies. Most important among these differences are the sample temperature and the boundary conditions. We previously showed that placement of target materials in a water media leads to generation of Scholte waves (Mercado et al., 2015). These surface waves travel at a fraction of the shear wave speed and corrupt stiffness measurements. In reality, Scholte waves were likely measured in this study as opposed to shear waves. Figure 11 agrees well with the theoretical decrease in wave speed that occurs secondary to Scholte waves albeit with a slightly greater decrease than the 84% derived from formulae (Vinh, 2013). Erroneous correlation of shear waves on the first excitation with Scholte waves on the second may account for this discrepency. Regardless, the agarose results in Figure 10 demonstrate a higher apparent stiffness compared to the body temperature ex vivo measurements in Figure 4 and are in much closer agreement with Chen et al. (2013b).
We previously discussed in Langdon et al. (2015) that errors in rheological model choice can appear as beam spacing dependence. In this study, since we used cross-correlation to determine the wave speed (and thus, stiffness), the rheological model is effectively linear elastic. Therefore, the beam spacing dependence observed in Figure 6 is to be expected. Unfortunately, we cannot simply apply a viscoelastic model without first considering the wave propagation geometry since this also impacts the estimate (Langdon et al., 2015). In that work, we utilized a Kelvin-Voigt model of viscoelasticity. However, this was not applied in this work because the model is intended for shear waves and not Scholte waves. Other models such as linear fit in Nightingale et al. (2015) and Zener in Zhu et al. (2014b) also make assumptions about planar shear wave geometries. Even if the beam spacing dependence can be eliminated using such a model, it may be simply fitting geometric unknowns with parameters assumed to be material. Thus, the veracity of such an estimate cannot be readily determined. This is certainly true for the linear elastic model used here and is a major limitation to this work (and the cited antecedent studies). At the excitation and tracking frequencies used, it is very likely that Scholte waves are the actual measured wave type and this is consistent with our observations in Figures 10 and 11. In this case the storage and loss modulus would be expected to be highly influenced by the propagation behavior of these waves that are themselves frequency dependent., As a result, one might expect the apparent shear stiffness to differ from the true bulk rheological model. How to tackle this problem in the scope of rat liver fibrosis modeling is left as future work.
A second limitation of this study is the fact that the livers were not heparanized before the excision. There is an observed time dependence to the stiffness measurements in our experimental data that may be attributable to this. This can be seen in the subtle increase in stiffness of the MTL case versus the STL case in Figure 7. It is of note that Chen et al. (2013b) did not mention heparanization of their livers either and this could also have attributed to apparent stiffness differences. Finally, exsanguination of the liver at time measurement leads to marked changes in measured mechanical properties since there is a drop in the hydrostatic pressure. It is very likely that in-vivo measurements would be markedly different from what is reported here.
Conclusions
Shear wave elasticity imaging was demonstrated in the setting of liver fibrosis in a rat model. Direct comparison of STL- and MTL-SWEI demonstrated no particular advantage, in either case, for the staging of fibrosis. On the other hand, STL-SWEI is seen to provide improved image quality compared to MTL, when beam spacings are small (0.20 mm). It is shown that the presence of Scholte waves is a confounding factor when a surrounding solid media is not provided in ex vivo tissue experiments. This limits the ability to compare the measured stiffness in these experiments with previous SDUV experiments. However, the design used here provides measurements that occur much more proximate to the animal’s euthanasia and at temperatures comparable to body temperature. In this way, this approach is more physiologically plausible than the embedded gelatin approach. Our future work will examine methods for accurately estimating the modulus from Scholte waves rather than accept an “apparent” modulus under the shear wave imaging assumption.
Acknowledgments
The authors gratefully acknowledge the support of National Institute of Health (NIH NIBIB R03 EB016127-01) and the University of Rochester.
Footnotes
Publisher's Disclaimer: This is a PDF file of an unedited manuscript that has been accepted for publication. As a service to our customers we are providing this early version of the manuscript. The manuscript will undergo copyediting, typesetting, and review of the resulting proof before it is published in its final citable form. Please note that during the production process errors may be discovered which could affect the content, and all legal disclaimers that apply to the journal pertain.
References
- Barry CT, Mills B, Hah Z, Mooney RA, Ryan CK, Rubens DJ, Parker KJ. Shear wave dispersion measures liver steatosis. Ultrasound in Medicine and Biology. 2012;38:175–82. doi: 10.1016/j.ultrasmedbio.2011.10.019. [DOI] [PMC free article] [PubMed] [Google Scholar]
- Chen SG, Sanchez W, Callstrom MR, Gorman B, Lewis JT, Sanderson SO, Greenleaf JF, Xie H, Shi Y, Pashley M, Shamdasani V, Lachman M, Metz S. Assessment of liver viscoelasticity by using shear waves induced by ultrasound radiation force. Radiology. 2013a;266:964–970. doi: 10.1148/radiol.12120837. [DOI] [PMC free article] [PubMed] [Google Scholar]
- Chen X, Shen Y, Zheng Y, Lin H, Guo Y, Zhu Y, Zhang X, Wang T, Chen S. Quantification of liver viscoelasticity with acoustic radiation force: A study of hepatic fibrosis in a rat model. Ultrasound Med Biol. 2013b;39:2091–102. doi: 10.1016/j.ultrasmedbio.2013.05.020. [DOI] [PubMed] [Google Scholar]
- DOnofrio M, Crosara S, De Robertis R, Canestrini S, Demozzi E, Gallotti A, Mucelli RP. Acoustic radiation force impulse of the liver. World Journal of Gastroenterology. 2013;19:4841. doi: 10.3748/wjg.v19.i30.4841. [DOI] [PMC free article] [PubMed] [Google Scholar]
- Elegbe EC, McAleavey SA. Single tracking location methods suppress speckle noise in shear wave velocity estimation. Ultrasound Imaging. 2013;35:109–25. doi: 10.1177/0161734612474159. [DOI] [PMC free article] [PubMed] [Google Scholar]
- Foucher J, Chanteloup E, Vergniol J, Castera L, Le Bail B, Adhoute X, Bertet J, Couzigou P, de Ledinghen V. Diagnosis of cirrhosis by transient elastography (fibroscan): A prospective study. Gut. 2006;55:403–8. doi: 10.1136/gut.2005.069153. [DOI] [PMC free article] [PubMed] [Google Scholar]
- Georges PC, Hui JJ, Gombos Z, McCormick ME, Wang AY, Uemura M, Mick R, Janmey PA, Furth EE, Wells RG. Increased stiffness of the rat liver precedes matrix deposition: Implications for fibrosis. Am J Physiol Gastrointest Liver Physiol. 2007;293:G1147–54. doi: 10.1152/ajpgi.00032.2007. [DOI] [PubMed] [Google Scholar]
- Good P. Permutation tests: a practical guide to resampling methods for testing hypotheses. Springer Science & Business Media; 2013. [Google Scholar]
- Hollender PJ, Rosenzweig SJ, Nightingale KR, Trahey GE. Single-and multiple-track-location shear wave and acoustic radiation force impulse imaging: Matched comparison of contrast, contrast-to-noise ratio and resolution. Ultrasound in medicine & biology. 2015;41:1043–1057. doi: 10.1016/j.ultrasmedbio.2014.11.006. [DOI] [PMC free article] [PubMed] [Google Scholar]
- Langdon JH, Elegbe E, McAleavey S. Single tracking location acoustic radiation force impulse viscoelasticity estimation (stl-ve): A method for measuring tissue viscoelastic parameters. IEEE Transactions on Ultrasonics, Ferroelectrics, and Frequency Control. 2015;62:1225–1244. doi: 10.1109/TUFFC.2014.006775. [DOI] [PMC free article] [PubMed] [Google Scholar]
- Langdon JH, McAleavey SA. Image and Signal Processing Workshop (WNYISPW) 2014 IEEE Western; New York: 2015. Real-time single track location ultrasound elasticity imaging using graphic processing units; pp. 42–46. [Google Scholar]
- McAleavey S, Collins E, Kelly J, Elegbe E, Menon M. Validation of smurf estimation of shear modulus in hydrogels. Ultrasound Imaging. 2009;31:131–50. doi: 10.1177/016173460903100204. [DOI] [PMC free article] [PubMed] [Google Scholar]
- McAleavey SA, Menon M, Orszulak J. Shear-modulus estimation by application of spatially-modulated impulsive acoustic radiation force. Ultrasound Imaging. 2007;29:87–104. doi: 10.1177/016173460702900202. [DOI] [PubMed] [Google Scholar]
- McLean EK, McLean A, Sutton P. Instant cirrhosis: An improved method for producing cirrhosis of the liver in rats by simultaneous administration of carbon tetrachloride and phenobarbitone. British journal of experimental pathology. 1969;50:502. [PMC free article] [PubMed] [Google Scholar]
- Mercado KP, Langdon J, Helguera M, McAleavey SA, Hocking DC, Dalecki D. Scholte wave generation during single tracking location shear wave elasticity imaging of engineered tissues. The Journal of the Acoustical Society of America. 2015;138:EL138–EL144. doi: 10.1121/1.4927633. [DOI] [PMC free article] [PubMed] [Google Scholar]
- Millonig G, Friedrich S, Adolf S, Fonouni H, Golriz M, Mehrabi A, Stiefel P, Poschl G, Buchler MW, Seitz HK, Mueller S. Liver stiffness is directly influenced by central venous pressure. Journal of Hepatology. 2010;52:206–210. doi: 10.1016/j.jhep.2009.11.018. [DOI] [PubMed] [Google Scholar]
- Nightingale KR, Rouze NC, Rosenzweig SJ, Wang MH, Abdelmalek MF, Guy CD, Palmeri ML. Derivation and analysis of viscoelastic properties in human liver: Impact of frequency on fibrosis and steatosis staging. IEEE transactions on ultrasonics, ferroelectrics, and frequency control. 2015;62:165–175. doi: 10.1109/TUFFC.2014.006653. [DOI] [PMC free article] [PubMed] [Google Scholar]
- Palmeri ML, Wang MH, Dahl JJ, Frinkley KD, Nightingale KR. Quantifying hepatic shear modulus in vivo using acoustic radiation force. Ultrasound in Medicine and Biology. 2008;34:546–58. doi: 10.1016/j.ultrasmedbio.2007.10.009. [DOI] [PMC free article] [PubMed] [Google Scholar]
- Salameh N, Larrat B, Abarca-Quinones J, Pallu S, Dorvillius M, Leclercq I, Fink M, Sinkus R, Van Beers BE. Early detection of steatohepatitis in fatty rat liver by using mr elastography. Radiology. 2009;253:90–7. doi: 10.1148/radiol.2523081817. [DOI] [PubMed] [Google Scholar]
- Scholte J. On true and pseudo rayleigh waves. Proc Kon Nederl Akad Wet. 1949;52:652–653. [Google Scholar]
- Tamayo RP. Is cirrhosis of the liver experimentally produced by cc14 an adequate model of human cirrhosis? Hepatology. 1983;3:112–120. doi: 10.1002/hep.1840030118. [DOI] [PubMed] [Google Scholar]
- Vinh PC. Scholte-wave velocity formulae. Wave Motion. 2013;50:180–190. [Google Scholar]
- Zhu Y, Zhang X, Zheng Y, Chen X, Shen Y, Lin H, Guo Y, Wang T, Chen S. Quantitative analysis of liver fibrosis in rats with shearwave dispersion ultrasound vibrometry: comparison with dynamic mechanical analysis. Medical engineering & physics. 2014a;36:1401–1407. doi: 10.1016/j.medengphy.2014.04.002. [DOI] [PubMed] [Google Scholar]
- Zhu Y, Zheng Y, Shen Yy, Chen X, Zhang Xy, Lin Hm, Guo Yr, Wang Tf, Chen Sp. Analyzing and modeling rheological behavior of liver fibrosis in rats using shear viscoelastic moduli. Journal of Zhejiang University Science B. 2014b;15:375–381. doi: 10.1631/jzus.B1300121. [DOI] [PMC free article] [PubMed] [Google Scholar]


