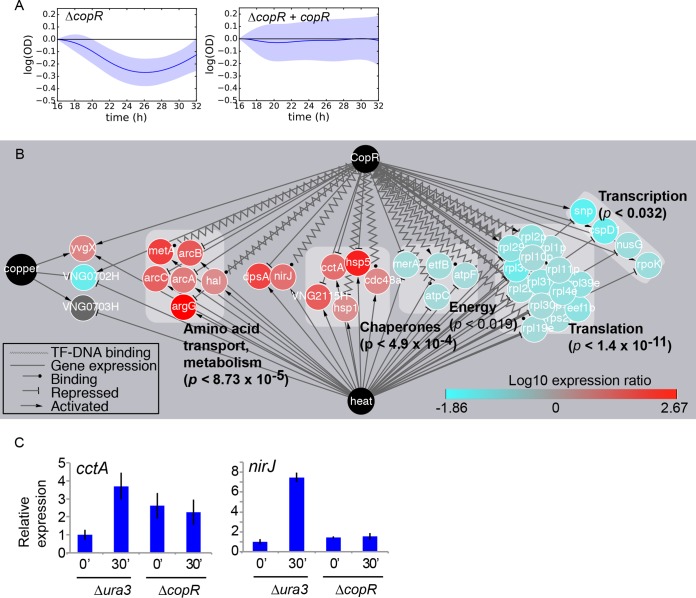
FIG 5 .
Phenotype validation: a novel heat shock function for the copper-responsive regulator CopR. (A) Slow growth under heat shock conditions in the ΔcopR mutant (left graph) is complemented by expression of the copR gene in trans (right graph). (B) Cytoscape gene regulatory network depicting the significant overlap between genes regulated by CopR in response to copper overload (CopR node at the top) and in wild-type cells in response to heat shock (heat node at the bottom) (55) and copper (copper node on the left) (22). Node colors (representing expression levels in wild-type cells under heat shock) and edge line types are indicated in the keys. Gray boxes behind groups of nodes represent arCOG functional categories (61). P values of enrichment were calculated by the hypergeometric distribution test. Genes of unknown function are not shown here for clarity but are given in Fig. S5. (C) Quantitative RT-PCR gene expression of cctA and nirJ genes in the knockout strain compared to the Δura3 control strain. The levels of expression before heat shock (0′) and 30 min after induction of heat shock (30′) are shown. Expression is normalized relative to a control gene whose expression does not change during heat shock (see Materials and Methods). Error bars represent standard errors of the means (SEM) of three biological replicate cultures, each with three technical replicate trials.

