Abstract
Conventional Doppler ultrasound is useful for visualizing fast blood flow in large resolvable vessels. However, frame rate and tissue clutter caused by movement of the patient or sonographer make visualizing slow flow with ultrasound difficult. Patient and sonographer motion causes spectral broadening of the clutter signal, which limits ultrasound’s sensitivity to velocities greater than 5–10mm/s for typical clinical imaging frequencies. To address this, we propose a clutter filtering technique that may increase the sensitivity of Doppler measurements to at least as low as 0.52mm/s. The proposed technique uses plane wave imaging and an adaptive frequency and amplitude demodulation scheme to decrease the bandwidth of tissue clutter. To test the performance of the adaptive demodulation method at suppressing tissue clutter bandwidths due to sonographer hand motion alone, six volunteer subjects acquired data from a stationary phantom. Additionally, to test in vivo feasibility, arterial occlusion and muscle contraction studies were performed to assess the efficiency of the proposed filter at preserving signals from blood velocities 2mm/s or greater at a 7.8MHz center frequency. The hand motion study resulted in initial average bandwidths of 175Hz (8.60mm/s), which were decreased to 10.5Hz (0.52mm/s) at −60dB using our approach. The in vivo power Doppler studies resulted in 4.73dB and 4.80dB dynamic ranges of the blood flow with the proposed filter and 0.15dB and 0.16dB dynamic ranges of the blood flow with a conventional 50Hz high pass filter for the occlusion and contraction studies, respectively.
Index Terms: perfusion, blood flow, power Doppler, clutter filter, ultrasound
I. Introduction
Blood perfusion imaging with ultrasound is still extremely challenging but also clinically invaluable. Perfusion, which encompasses the slowest flow in the smallest vasculature, is a crucial component for evaluating applications like tumor treatment and monitoring because it involves the exchange of nutrients between blood and tissue. Measuring perfusion with ultrasound is difficult because tissue motion artifacts, otherwise known as tissue clutter, interfere with the signal from slowly moving blood. Contrast agents have been employed to enhance ultrasound imaging for measuring slower flow [1]. However, apart from adding to the cost, invasiveness, and variability of a procedure, contrast agents are limited by dose and time in the blood stream. Therefore, by addressing the tissue clutter interference problem, ultrasound imaging without contrast agents could enable unlimited real-time measurements of perfusion, which would substantially improve current understanding, monitoring, and diagnosis of vascular diseases and cancers.
The signal from tissue has been variably reported in the literature as being as low as 10–100 times and up to 100dB larger than the signal from blood [2]–[7]. Filters are therefore required in conventional ultrasound blood flow imaging to remove the overpowering tissue clutter signal and uncover the signal from blood flow. Apart from the tissue signal being stronger than the blood signal, tissue also moves at lower frequencies or velocities than most blood flow. Therefore, conventional techniques that use standard high pass filters are only sensitive to blood motion that is faster than tissue motion.
For lower blood velocities, conventional high pass filters become less effective because tissue clutter can have Doppler frequencies similar to or even higher than those from slower flow. This results in the tissue clutter signal overlapping with, and overpowering, the signal from lower velocity blood flow. Conventional Doppler methods are therefore limited to blood velocities higher than those of tissue clutter.
Two primary sources of tissue clutter are sonographer hand motion and patient physiological motion. Considering only these sources of clutter, Heimdal et al. estimated theoretical lower bounds on blood velocity estimates at different imaging frequencies with conventional Doppler imaging [4]. Based on this work, it has been long claimed that ultrasound without contrast agents is limited to blood velocities greater than 5mm/s for center frequencies less than 8MHz [1], [4]. This limitation eliminates sensitivity to small vessels such as capillaries, venules, and 17–32µm diameter arterioles, which have average velocities of 0.33mm/s, 3.3mm/s and 2–4mm/s, respectively [4], [8]. Perfusion imaging is therefore seemingly impossible with conventional ultrasound methods because perfusion constitutes the slowest blood flow in the capillaries or smallest vasculature.
Conventional high pass filters have been investigated extensively for the purpose of suppressing tissue clutter in Doppler ultrasound imaging. Among the most commonly used are infinite and finite impulse response (IIR and FIR) filters and polynomial regression filters [5]–[7]. Each of these filters can be optimized in terms of frequency response parameters for maximal tissue removal and blood flow preservation. Additionally, since short ensemble lengths have made high pass filtering difficult in the past, the development of high frame rate acquisition techniques, including plane wave and plane wave synthetic aperture imaging, have allowed for the implementation of more effective high pass filtering [9], [10]. However, none of these conventional techniques account for the overlap between the tissue clutter and low velocity blood flow signals. Thus, even a perfectly optimized and sufficiently sampled conventional high pass filter will be unable to preserve slow flow.
Advanced pre-filtering techniques have been proposed to improve signal separation of tissue and slow flow. Among these is the method by Thomas and Hall, expanded upon by Bjaerum and Torp, which involves adaptively modulating the tissue clutter bandwidth to be centered around DC before applying a conventional high pass filter [3], [11]. This method is useful for conventional Doppler acquisitions with shorter ensemble lengths that can result in a non-zero tissue clutter mean Doppler frequency that interferes with uniform blood flow. However, with the development of the aforementioned high frame rate acquisition techniques, longer ensemble lengths are more easily achieved. With these longer acquisition sequences, the Doppler frequency shift of tissue clutter becomes less of a problem since tissue does not typically move uniformly over long periods of time and will therefore already be centered about DC. Furthermore, due to the spectral broadening of the tissue clutter signal caused by sonographer hand motion and patient physiological motion, even if the tissue clutter signal is modulated to be centered about DC, the bandwidth of the clutter still makes it impossible to separate the blood signal from the tissue clutter signal.
Due to the tissue spectral broadening problem encountered in the frequency domain of the slow-time dimension (i.e., along the ensemble), other methods have been proposed that aim to incorporate time domain and/or spatial dimensional information to better separate tissue clutter from low velocity blood flow [7], [12]. These methods use singular value decomposition (SVD) or principle/independent component analysis (PCA/ICA) to take advantage of the temporally and spatially coherent nature of tissue compared to the temporally and spatially incoherent nature of blood flow. For example, Gallippi and Trahey proposed a time-domain blind source separation (BSS) technique that used principle or independent component analysis with polynomial regression to adaptively filter out tissue clutter [12]. Demene et al. also proposed an SVD algorithm using plane wave synthetic aperture imaging to incorporate the spatial characteristics of blood and tissue while also benefiting from large slow-time ensemble sizes [7]. Although these methods have improved slow flow measurements with ultrasound, the spectral broadening of the tissue clutter bandwidth is still an issue that ultimately limits the preservation of slow flow signal with the previously proposed methods.
Alternative beamforming methods have also been shown to improve slow flow estimation, including coherent flow power Doppler (CFPD) [13]–[15]. CFPD increases sensitivity to slow flow by suppressing thermal noise and clutter [14], [15]. However, spectral broadening of the tissue clutter signal will still limit estimation of the slowest flow.
In order to address the tissue clutter bandwidth limitation, we previously introduced an initial realization of an adaptive clutter demodulation scheme that reduces the bandwidth of tissue clutter [16], [17]. Here, we provide a more thorough description of the method and report new results on phantom and in vivo data.
II. Theory
A. Tissue Clutter and Blood Flow Models
A model for tissue vibration and blood flow has been previously derived by Heimdal and Torp [4]. For the purposes of this paper, we consider a simple realization of their classic model relevant to a single resolution cell. Assuming only stationary tissue is present in the field of view, the resulting Doppler signal at a given spatial location and slow-time point, t, could be represented as the sum of the complex amplitudes of the tissue scatterers,
| (1) |
where Am is the complex amplitude of a single scatterer and M is the total number of tissue scatterers. Since the scatterers are stationary over time, this signal is constant in the time domain and thus a delta function at DC in the frequency domain.
Similarly, if only blood were present, the resulting signal at time t could be represented as the sum of complex amplitudes modulated by the velocity term of each scatterer since each blood scatterer is moving at some variable speed,
| (2) |
where An and are the amplitude and angular frequency of a single blood scatterer, respectively, and N is the total number of blood scatterers. In the angular frequency equation, c is the speed of sound, υn(t) is the velocity of a single scatterer at time t, θn is the beam-to-flow angle of a single scatterer, ω0 is the transmit frequency, and T is the time between pulses or the inverse of the pulse repetition frequency (PRF). Since blood scatterers will be moving at some distribution of velocities, this signal would be broadband and centered about the mean frequency or velocity of the blood scatterers in the frequency domain.
When both stationary tissue and flowing blood are present simultaneously, the signals in (1) and (2) are summed. To complete the model, a thermal noise component is also included in the sum,
| (3) |
Conceptually, for this case, the tissue and flowing blood are well separated in the frequency domain. Tissue clutter is therefore easily removed with conventional techniques.
When sonographer hand motion and patient physiological motion are present, the signal will include an additional velocity term that describes the resulting axial motion of both the tissue and blood scatterers,
| (4) |
where ωphysio+sono is the angular frequency produced by patient physiological and sonographer hand motion. This motion causes a phase modulation that contributes to the spectral broadening of the tissue clutter bandwidth and causes an overlap between the tissue clutter and blood flow signals in the frequency domain. This spectral broadening makes conventional high pass filtering of the tissue clutter signal difficult when trying to image lower velocity blood flow.
B. Adaptive Clutter Demodulation Model
We propose a method that aims to estimate and correct for the patient physiological and sonographer hand motion in order to remove the added velocity term in (4),
| (5) |
where ω̂physio+sono is an estimate of the angular frequency produced by patient physiological and sonographer hand motion. By correcting for this motion at each depth through slow-time, we are adaptively demodulating the tissue clutter bandwidth. In doing so, we are ideally left with (3), which, again, can easily be addressed with conventional filters.
However, due to non-axial tissue motion and inherent scanner variability, there will also be an amplitude modulation that will further contribute to the spectral broadening of the tissue clutter signal [4]. Amplitude modulation from tissue motion could result from residual axial motion as well as lateral and elevational motion. Looking only at the tissue signal portion of (3) (i.e., (1)), after the described phase demodulation, this amplitude modulation can be simply described by a time dependence of the amplitude term in (1),
| (6) |
To correct for this time dependence of the tissue amplitude, the signal at each time point can be normalized to the amplitude of the envelope or magnitude of the signal at that time point. Additionally, to preserve the power of the original signal, each term can then be multiplied by the power of the envelope of the signal. These operations are summarized in the following equation,
| (7) |
where L is the total number of slow-time points. By applying this correction to the tissue only signal, we remove the time dependence and are ideally left with (1),
| (8) |
However, this operation becomes more complicated when applied to (5) since fnorm(t) will reflect amplitude modulation of both tissue and blood and will subsequently also demodulate the blood signal amplitude. Similar to the tissue signal, the blood signal will also exhibit a time dependence of the amplitude term,
| (9) |
Incorporating the amplitude modulated tissue and blood signals into (5), fnorm(t) of the phase demodulated signal becomes
| (10) |
By applying (10) to the phase demodulated signal, we are left with a phase and amplitude demodulated signal,
| (11) |
This normalization demodulates all of the signal amplitude, including the blood, which causes the signal to become constant through slow-time.
To avoid demodulating the blood signal amplitude, we can take advantage of the difference in temporal coherence length between tissue and blood. The blood signal has a shorter coherence length so it is possible to apply a median filter to fnorm(t) that is large enough to not incorporate changes in blood amplitude while still small enough to capture significant tissue amplitude modulation. In doing so, we can approximate (7) from (10),
| (12) |
where R{x, k} represents the median filter operation on signal x of size k samples. Substituting the median filtered fnorm(t) for (10) in (11), tissue amplitude modulation can be removed while blood amplitude modulation is preserved,
| (13) |
We are then left with (3), which, again, can easily be addressed with conventional filters.
C. Adaptive Clutter Demodulation Implementation
To implement the described phase demodulation, first, we can use a standard 2D autocorrelation method to compute relative displacements between temporally adjacent beamformed radio frequency (RF) lines [18]. Then, similar to approaches used in phase aberration estimation [19], [20], absolute displacements relative to the first RF line can be reconstructed by solving the following system of equations in a least square error sense,
| (14) |
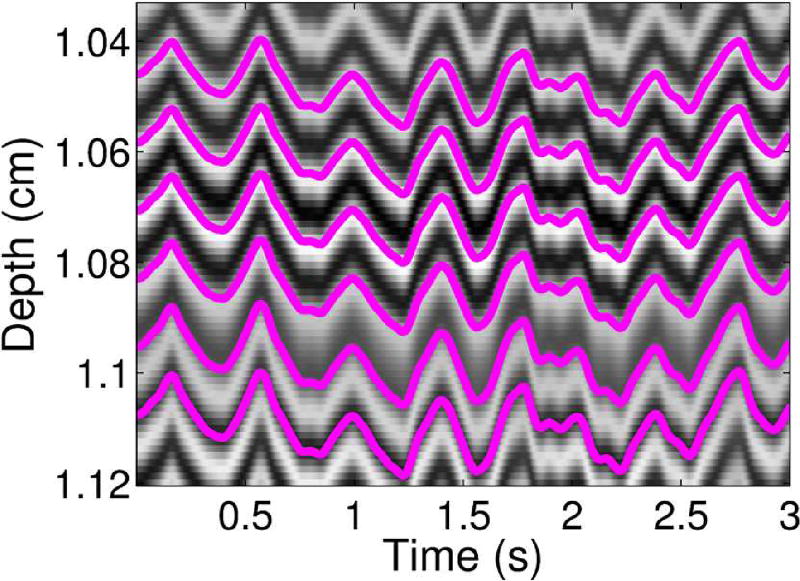
where dmn represents the relative displacement estimate between time steps m and n (we assume that dmn = −dnm, which is not true for all motion estimators), Dl represents absolute displacement at slow-time point l, and L represents the number of samples through slow-time. Since we are using a lag of 1, this computation is the same as taking a cumulative sum of the relative displacements through slow-time. To qualitatively demonstrate the absolute displacement computation, example absolute displacement profiles through slow-time are shown in Fig. 1 superimposed on top of an example RF M-mode image.
Fig. 1.
Displacement profiles in pink superimposed on top of corresponding RF lines through slow-time are shown for several depths.
A shape-preserving piecewise cubic interpolation can then be used to interpolate each RF line through depth from the computed absolute displacement to zero displacement, which is equivalent to adaptively demodulating the slow-time Doppler signal based on the tissue motion. For this method to work, we assume that the tissue is sufficiently bright relative to the blood signal so that only tissue displacement is measured by the 2D autocorrelation [21].
As described in the previous section, to minimize tissue signal amplitude variation through slow-time while still preserving the power of the signal, each interpolated RF signal through slow-time is normalized to the amplitude of the envelope of the signal divided by the amplitude of the power of the envelope of the signal. This normalization function is described in (12) and is applied to the RF signal through slow-time. In comparison to (11), because the normalization is applied to the real part of the signal, this phase and amplitude demodulated signal is not constant through slow-time and does not fully demodulate the blood signal. Before this correction is applied, the normalization function is median filtered through slow-time to avoid blood signal amplitude demodulation, as described in the previous section.
To illustrate the methodology, examples of hand motion M-mode data sets before and after adaptive demodulation are shown in Figs. 2a and 2b, respectively. For the same examples, average spectra before and after adaptive demodulation are shown in Fig. 2c.
Fig. 2.
(a) Example M-mode data before adaptive demodulation. (b) Example M-mode data after adaptive demodulation. (c) The average spectrum through slow-time before adaptive demodulation is shown in teal. The average spectrum through slow-time after adaptive demodulation is shown in orange. Example half-width bandwidth estimate at −60dB is shown in red.
It is worth noting that, for simplicity, a narrow-band model was used to describe the theory. However, in practice, because we perform corrections in the time domain, the implementation is wide-band. Specifically, despite our narrow-band description, which suggests different adaptive modulation signals for each frequency, in practice, we estimate a single average displacement and amplitude fluctuation and assume they apply equally well to all frequencies.
III. Experiments
A. Data Acquisition and Beamforming
Channel data from plane wave transmit sequences were acquired using a Verasonics Vantage Ultrasound System (Verasonics, Inc., Kirkland, WA), L12-5 linear array probe, and C5-2 curvilinear array probe. Data were acquired at center frequencies of 7.8MHz and 3.1MHz to end depths of 3cm and 8cm with the L12-5 and C5-2 probes, respectively.
Three different plane wave acquisition methods were used and will be referred to as follows: single plane wave (SPW), plane wave synthetic focusing (PWSF), and multiple plane wave (MPW). For the SPW method, 0° plane waves were acquired at a PRF of 1kHz. For the PWSF case, plane waves angled between −8° to 8° spaced by 2° were acquired at a PRF of 9kHz. All 9 angles were used to generate a single frame using the method by Montaldo et al., resulting in a final PRF of 1kHz [10]. For the MPW case, 0° plane waves were acquired at a PRF of 9kHz and 9 consecutive plane waves were summed together after beamforming to generate a single frame, again resulting in a final PRF of 1kHz.
All data sets were beamformed with a Hann apodization on receive, and aperture growth with an F/# of 2 was implemented during beamforming. To obtain a final sampling frequency greater than or equal to 50MHz, RF data were upsampled through depth by an integer number of samples (i.e. 62.5MHz and 50MHz for the data acquired with the L12-5 and C5-2 probes, respectively). Before further processing, a FIR band-pass filter was applied to the beamformed RF data.
All beamforming and signal processing for all studies were done in MATLAB R2014a (The MathWorks, Inc., Natick, MA).
B. Sonographer Hand Motion Phantom Experiment
Six volunteers were recruited for three separate trials to acquire channel data using a quality assurance phantom (CIRS Model 040GSE, Norfolk, Virginia) for 3s using a transmit voltage of 30.7V. For the first trial, the L12-5 probe and PWSF acquisition method were used. The 0° plane wave acquisitions from this sequence were used to generate SPW data. For the second trial, the L12-5 probe and MPW acquisition method were used. Since the PWSF and MPW methods theoretically improve SNR, trials 1 and 2 were performed to assess signal-to-noise ratio (SNR) limitations of the standard SPW method that is used for all other studies in this paper. Additionally, since the PWSF method focuses on transmit while the SPW and MPW methods do not, the effects of transmit beamforming induced spectral broadening were also examined. The third trial used the C5-2 probe and SPW acquisition method. This trial provided an assessment of the algorithm at a lower imaging frequency (3.1MHz), compared to the standard 7.8MHz imaging frequency used for the rest of the studies. For all three trials, the phantom was stationary, so that sonographer hand motion was the only variable causing clutter motion in the acquired data. All four imaging cases are summarized in Table I and labeled as cases 1 through 4.
TABLE I.
Imaging cases are summarized by field of view (FOV), tissue clutter source, probe, acquisition method, and transmit voltage.
| Case | FOV | Motion Clutter Source |
Probe (Frequency) | Acq. Method | Transmit Voltage (V) |
|---|---|---|---|---|---|
| 1 | Phantom | Hand | L12-5 (7.8MHz) | PWSF | 30.7 |
| 2 | Phantom | Hand | L12-5 (7.8MHz) | SPW | 30.7 |
| 3 | Phantom | Hand | L12-5 (7.8MHz) | MPW | 30.7 |
| 4 | Phantom | Hand | C5-2 (3.1MHz) | SPW | 30.7 |
| 5 | Phantom | None | L12-5 (7.8MHz) | SPW | 30.7 |
| 6 | in vivo | Patient & Hand | L12-5 (7.8MHz) | SPW | 16.1 |
| 7 | in vivo | Patient & Hand | L12-5 (7.8MHz) | SPW | 16.1 |
For each imaging case, the center line of each plane wave acquisition was beamformed to generate an M-mode image. The adaptive clutter demodulation scheme was performed on each M-mode image. A median filter of 35 samples (35ms) was used for the amplitude demodulation. Using the same cutoffs as the first band-pass filter, an additional FIR band-pass filter was applied to the RF data through depth. For each subject, full-width bandwidths were computed on averaged power spectra at −60dB before and after adaptive demodulation. The bandwidths were then averaged across subjects. Fig. 2c shows an example half-width bandwidth estimate of the adaptively demodulated average spectrum at −60dB. Additionally, full-width bandwidths were computed relative to the thermal noise floor. For this metric, the mean was subtracted from each signal prior to estimating its power spectrum. For both bandwidth metrics, corresponding velocity estimates in mm/s were computed using , where f is slow-time frequency in Hz, c is the speed of sound in m/s, and f0 is the center frequency in MHz.
Additionally, to compare the individual effects of the phase and amplitude demodulation steps, bandwidth values were also computed for data with phase demodulation only and with amplitude demodulation only (using a median filter of 35 samples) for the SPW case from trial 1 (imaging case 2). Furthermore, phase and amplitude demodulation with two additional median filters of size 71 and 141 samples (71ms and 141ms) as well as phase and amplitude demodulation with no median filtering were compared for this case to assess the effects of median filtering on the tissue clutter bandwidth.
C. No Motion Phantom Experiment
To illustrate inherent scanner amplitude variability and to demonstrate the need for the described amplitude demodulation step in the proposed algorithm, we performed a no motion phantom experiment. The L12-5 probe and SPW acquisition method were used to acquire data of the same quality assurance phantom used for the sonographer hand motion experiment using a transmit voltage of 30.7V. For this experiment, a ring stand and probe holder were used to ensure that no sonographer hand motion, patient physiological motion, or blood flow were present. This imaging case is summarized in Table I and labeled as case 5.
The center line of each plane wave acquisition was beamformed to generate an M-mode RF image. Amplitude through slow-time was qualitatively compared between raw RF data, phase demodulated RF data, and phase and amplitude demodulated (with and without median filtering) RF data for two example depths. A 35 sample median filter was used for the median filtered case. Additionally, the power of each signal was computed and compared to ensure that the amplitude demodulation preserves signal power as expected.
D. In Vivo Experiments
Two experiments were performed to assess in vivo feasibility: an arterial occlusion (reactive hyperemia) experiment and a muscle contraction (exercise hyperemia) experiment. Informed written consent in accordance with Vanderbilt University’s institutional review board (IRB) was given by two subjects prior to the start of the studies. The first subject was a healthy 35 year old male, and the second subject was a healthy 44 year old male. For both studies, data were acquired at a transmit voltage of 16.1V using the L12-5 probe and SPW method.
For the arterial occlusion experiment, ultrasound data were acquired of the first subject’s left gastrocnemius muscle. To prevent the muscle from being compressed against the scanning bed, the subject’s left calf was raised slightly and his left foot was secured while lying supine. To ensure continual contact of the probe, hand-held assistance was used in combination with a stationary holder to hold the probe beneath the gastrocnemius muscle. Just above the subject’s left knee, a thigh blood pressure cuff (Model CC22, Hokanson, Bellevue, WA) was placed and inflated within 1s to 300mmHg using a rapid cuff inflator (Model E20, Hokanson, Bellevue, WA). To induce arterial occlusion in the calf, the cuff was kept inflated for 5min [22]–[24]. Data were acquired for 30s after the 5 minute occlusion. The cuff was rapidly released about 4s into the scan. This imaging case is summarized in Table I and labeled as case 6.
For the muscle contraction experiment, ultrasound data were acquired of the second subject’s left tibialis anterior muscle. While lying supine, the subject’s left calf was slightly raised and his left foot was secured in a custom-built foot device [25]. A trained sonographer held the probe on the tibialis anterior muscle and data were acquired for 30s. About 8s into the scan the subject was instructed to dorsiflex his left foot to contract and induce perfusion in the tibialis anterior muscle. After 5s the subject relaxed his foot. This imaging case is summarized in Table I and labeled as case 7.
For both in vivo studies, for every 50ms time point, data were broken up into 2s time frames, and each time point was processed separately. Using parallel receive beamforming, full images were formed from each plane wave transmit.
Adaptive clutter demodulation was applied to each in vivo time point. A median filter of 35 samples (35ms) was used for the amplitude demodulation. Using the same cutoffs as the first band-pass filter, an additional FIR band-pass filter was applied to the RF data through depth. Four fourth order Butterworth filtering cases were compared: a 20Hz high pass applied to adaptively demodulated (i.e., both phase and amplitude demodulated) RF data (proposed filter case), a 20Hz high pass applied to phase demodulated RF data (proposed filter case with no amplitude demodulation), a 20Hz high pass applied to normal RF data, and a 50Hz high pass applied to normal RF data. An additional 80Hz high pass case was compared for a single time point of the occlusion data. For each method and signal through slow-time, a mirror reflection of the first 20 points was added to the beginning of the signal before filtering and removed after filtering. Power Doppler images were generated by computing power at each pixel using , where L is the number of slow-time points and s(l) is the slow-time signal at time l. A 5×5 spatial median filter and a 7×1 slow-time median filter were applied to each power Doppler image prior to log scaling.
For each filtering case and time point, the relative change in power from the last time point was measured at each pixel within a muscle region of interest (ROI). Due to large motion artifacts during the cuff release and contraction of the muscle, time points with 5th percentile normalized cross correlation values below 0.995 were not included when measuring the dynamic ranges of the relative median power. For each in vivo study, power Doppler images were scaled to dynamic ranges that qualitatively highlight differences between the filtering methods while maintaining similar noise floors.
Adaptive demodulation with no median filtering and with median filters of size 71 and 141 samples (71ms and 141ms) were also compared for a single time point for each in vivo case to further assess the effects of amplitude demodulation.
E. SNR Comparison
The phantom and in vivo studies could potentially result in different SNRs due to different transmit voltages used for the acquisitions. Additionally, the PWSF and MPW methods will likely result in increased SNR. To quantify potential differences in SNR and its effect on the proposed algorithm, we computed SNR in each case using , where ρ is the slow-time RF A-line to A-line normalized cross correlation value [26]. Kernel sizes of 5 and 1.25 wavelengths were used for the normalized cross correlation estimates for the in vivo contraction study and all other studies, respectively. The RF-lines were upsampled to a sampling frequency of 156MHz to improve the quality of the estimate. A sliding window of 1 sample was used to estimate ρ for every pair of RF lines over the first 2s of data from the in vivo and phantom acquisitions. We performed a Fisher transformation, and then averaged the estimates of ρ. We then estimated the SNR after performing the inverse transformation.
F. Simulation Experiment
Using similar methods as Li et al. [15], a simple simulation experiment was performed to confirm that the proposed technique can preserve slow blood flow in a controlled setting. Field II was used to simulate plane wave channel data of a single vessel using the same parameters as the L12-5 SPW acquisitions (7.8MHz frequency, 3cm end depth, PRF=1kHz) [27]. A single 0.5mm diameter vessel of blood scatterers was centered at a depth of 2cm at 60° to the beam within a 1.5 by 3cm area of tissue scatterers. To simulate tissue clutter, displacements estimated from one of the hand motion data sets were used to displace the tissue and blood scatterers. One second of data were simulated with blood scatterers moving under laminar flow with maximum velocities of 0.5mm/s, 1mm/s, and 2mm/s. However, because the flow was parabolic, the velocity of most of the simulated blood scatterers was lower than the respective maximum. Tissue and blood scatterers were both generated with a scattering density of 17 scatterers per resolution cell. The simulated signal from blood was scaled to be 40dB lower than the tissue. Thermal noise was added at 0dB relative to the blood signal.
Simulated channel data were then beamformed and processed the same way as for the in vivo studies. A fourth order 1Hz high pass Butterworth filter was applied to two different cases: adaptively demodulated RF data (using a 35 sample median filter for the amplitude demodulation) and normal RF data. Several additional filter cutoffs were compared for the 1mm/s case. Power Doppler images were generated and scaled the same way as for the in vivo data.
IV. Results
The following sections present the results from the phantom and in vivo experiments. Section IV-A includes the sonographer hand motion phantom experiment results. The no motion phantom experiment results are presented in Section IV-B. The in vivo results are then shown in Section IV-C followed by the SNR results in Section IV-D. Finally, the simulation experiment results are presented in Section IV-E.
A. Sonographer Hand Motion Phantom Results
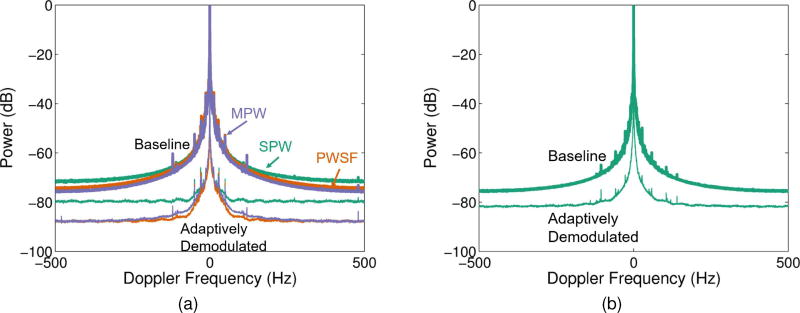
For the data acquired with the L12-5 probe (7.8MHz imaging frequency, imaging cases 1–3), adaptive demodulation resulted in average bandwidth estimates below 20Hz at −60dB for all three acquisition methods, allowing for velocities below 1mm/s to potentially be detected, as seen in Fig. 3a and Table II. Table III shows that, for these imaging cases, subsequent blood flow processing would need to provide a gain of at least 25dB above the noise floor to allow for detection of velocities below 1mm/s.
Fig. 3.
Average spectra through depth and across subjects are shown for (a) three beamforming methods, SPW (teal), PWSF (orange), and MPW (purple), before (thick) and after (thin) adaptive demodulation for the data acquired with the L12-5 probe (7.8MHz imaging frequency, imaging cases 1–3) and (b) the SPW beamforming method before (thick) and after (thin) adaptive demodulation for the data acquired with the C5-2 probe (3.1MHz imaging frequency, imaging case 4). A 35 sample median filter was used for the adaptive demodulation for both cases.
TABLE II.
Bandwidths (BWs) averaged across subjects and corresponding velocities at −60dB before and after adaptive demodulation for the sonographer hand motion experiment (imaging cases 1–4). Standard error of the mean is shown in parenthesis for each measurement.
| Imaging Case | BW Before (Hz) | Velocity Before (mm/s) |
BW After (Hz) | Velocity After (mm/s) |
|---|---|---|---|---|
| 1 (PWSF, 7.8MHz) | 168 (± 25.0) | 8.26 (± 1.23) | 5.11 (± 1.28) | 0.25 (± 0.06) |
| 2 (SPW, 7.8MHz) | 175 (± 25.7) | 8.60 (± 1.26) | 10.5 (± 6.49) | 0.52 (± 0.32) |
| 3 (MPW, 7.8MHz) | 177 (± 32.0) | 8.74 (± 1.58) | 10.6 (± 4.12) | 0.52 (± 0.20) |
| 4 (SPW, 3.1MHz) | 135 (± 15.2) | 16.6 (± 1.87) | 22.0 (± 6.62) | 2.71 (± 0.82) |
TABLE III.
Bandwidths (BWs) relative to the noise floor averaged across subjects and corresponding velocities before and after adaptive demodulation for the sonographer hand motion experiment (imaging cases 1–4). Standard error of the mean is shown in parenthesis for each measurement.
| dB Above Noise Floor |
Imaging Case | BW Before (Hz) | Velocity Before (mm/s) |
BW After (Hz) | Velocity After (mm/s) |
|---|---|---|---|---|---|
| 3 | 1 (PWSF, 7.8MHz) | 477 (± 7.55) | 23.5 (± 0.37) | 227 (± 9.00) | 11.2 (± 0.44) |
| 3 | 2 (SPW, 7.8MHz) | 413 (± 14.7) | 20.3 (± 0.73) | 168 (± 9.27) | 8.29 (± 0.46) |
| 3 | 3 (MPW, 7.8MHz) | 567 (± 17.9) | 28.0 (± 0.88) | 647 (± 48.2) | 31.9 (± 2.38) |
| 3 | 4 (SPW, 3.1MHz) | 403 (± 12.2) | 49.7 (± 1.51) | 255 (± 2.31) | 31.4 (± 0.28) |
| 25 | 1 (PWSF, 7.8MHz) | 67.6 (± 4.17) | 3.33 (± 0.21) | 15.4 (± 3.63) | 0.76 (± 0.18) |
| 25 | 2 (SPW, 7.8MHz) | 50.2 (± 2.79) | 2.48 (± 0.14) | 2.50 (± 0.31) | 0.12 (± 0.02) |
| 25 | 3 (MPW, 7.8MHz) | 83.3 (± 7.54) | 4.10 (± 0.37) | 17.4 (± 1.87) | 0.86 (± 0.09) |
| 25 | 4 (SPW, 3.1MHz) | 46.9 (± 1.66) | 5.78 (± 0.20) | 8.83 (± 0.64) | 1.09 (± 0.08) |
For the data acquired with the C5-2 probe (3.1MHz frequency, imaging case 4), adaptive demodulation resulted in an average bandwidth of 22.0Hz at −60dB, allowing for velocities below 2.71mm/s to potentially be detected, as shown in Fig. 3b and Table II. Table III shows that, for this imaging case, subsequent blood flow processing would need to provide a gain of at least 25dB above the noise floor to allow for detection of velocities below 2mm/s.
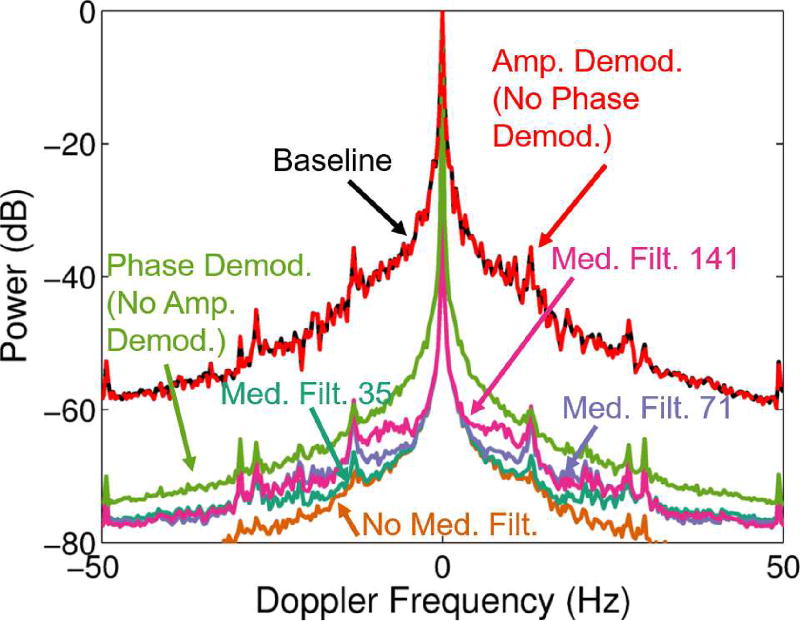
Fig. 4 and Table IV show the results for the individual effects of phase and amplitude demodulation as well as the effects of median filtering with the amplitude demodulation on the tissue clutter bandwidth for the L12-5 SPW method (7.8MHz imaging frequency, imaging case 2). These results show that with only amplitude demodulation (no phase demodulation), minimal suppression of the bandwidth is seen (175Hz suppressed to 168Hz). Phase demodulation alone suppresses the bandwidth pretty well. At −60dB, phase demodulation (no amplitude demodulation) resulted in a full-width bandwidth of 35.8Hz (1.76mm/s). The combination of phase and amplitude demodulation further improved the bandwidth suppression, with smaller median filter sizes resulting in increased suppression. Phase and amplitude demodulation with no median filtering decreased the bandwidth to 4.78Hz (0.24mm/s), while phase and amplitude demodulation with 35 sample median filtering decreased the bandwidth to 10.5Hz (0.52mm/s). Although no median filtering produced the best results in terms of tissue clutter bandwidth suppression, it would also suppress the blood signal in a realistic application, as described in Section II-B.
Fig. 4.
Average spectra through depth across subjects are shown for the data acquired with the L12-5 probe and SPW acquisition method (7.8MHz imaging frequency, imaging case 2) for different steps of the adaptive demodulation scheme. The frequency axis is cropped to highlight differences at −60dB. Spectra are shown for baseline (black), after amplitude demodulation (red), after phase demodulation (green), and after phase & amplitude demodulation with median filter sizes of 141 (pink), 71 (purple), 35 (teal), and no median filter (orange).
TABLE IV.
Average bandwidths (BWs) and corresponding velocities at −60dB after adaptive demodulation with amplitude demodulation, phase demodulation, phase & amplitude demodulation with varying median filter sizes, and phase & amplitude demodulation with no median filtering for data acquired with the L12-5 probe and SPW acquisition method (7.8MHz imaging frequency, imaging case 2). Standard error of the mean is shown in parenthesis for each measurement.
| Demod. Method | BW After (Hz) | Velocity After (mm/s) |
|---|---|---|
| Amp | 168 (± 25.2) | 8.29 (± 1.24) |
| Phase | 35.8 (± 7.35) | 1.76 (± 0.36) |
| Phase & Amp. (No Med. Filt.) | 4.78 (± 1.08) | 0.24 (± 0.05) |
| Phase & Amp. (Med. Filt. 35) | 10.5 (± 6.49) | 0.52 (± 0.32) |
| Phase & Amp. (Med. Filt. 71) | 14.6 (± 7.12) | 0.72 (± 0.35) |
| Phase & Amp. (Med. Filt. 141) | 28.0 (± 7.53) | 1.38 (± 0.37) |
B. No Motion Phantom Results
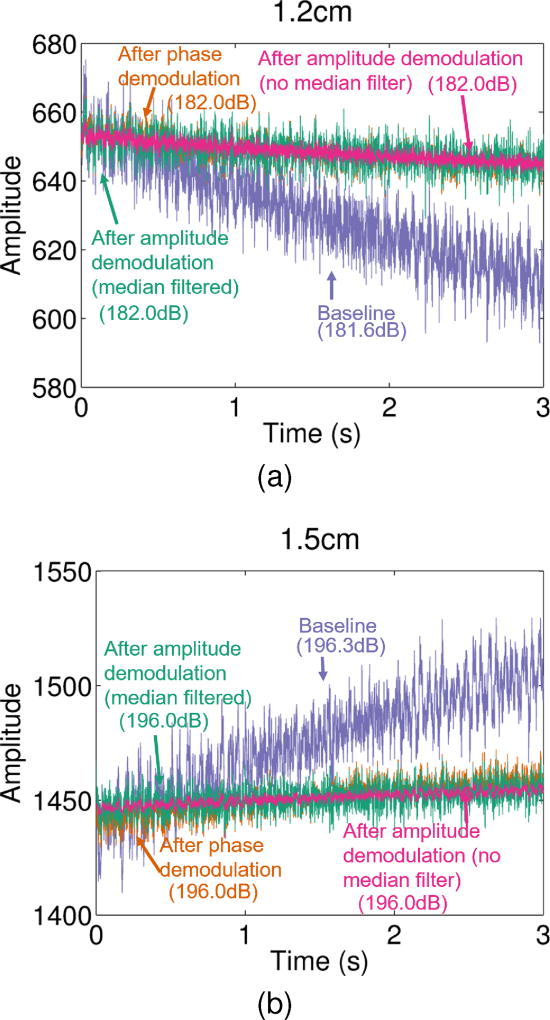
For the no motion phantom case, amplitude at single depths through slow-time are shown in Figs. 5a and 5b for the baseline RF data, phase demodulated RF data, and phase and amplitude demodulated RF data (with and without median filtering). Based on these results, since no added motion is present, it is clear that amplitude modulation can result from inherent scanner variation. From the two example depths from the same data set shown in Fig. 5, large variable trends in amplitude modulation are present in the baseline data. Amplitude decreases through slow-time in Fig. 5a while it increases through slow-time in Fig. 5b. For both example depths, phase demodulation is able to correct for this larger bias, while amplitude demodulation is able to correct for additional smaller variations in amplitude, as seen in Figs. 5a and 5b. Additionally, both phase and amplitude demodulation preserve the power of the baseline signal as seen in the power estimates shown next to corresponding labels in Fig. 5.
Fig. 5.
Amplitude through slow-time is shown for two example depths. For each depth, amplitude is shown for the raw RF data (purple), phase demodulated RF data (orange), and phase & amplitude demodulated RF data with (teal) and without (pink) median filtering. Individual power estimates in dB for each line are shown next to corresponding labels.
C. In Vivo Results
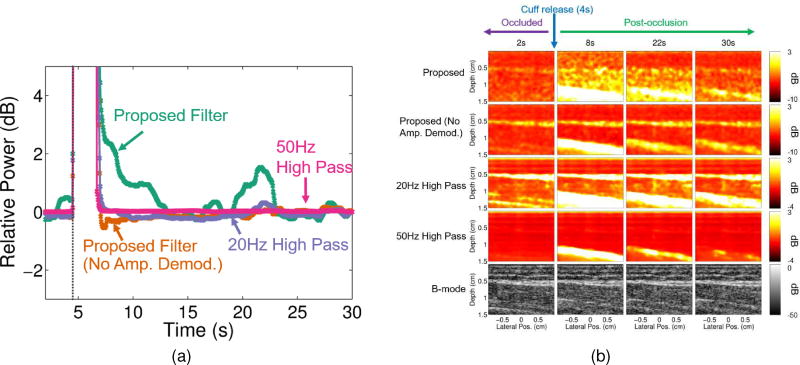
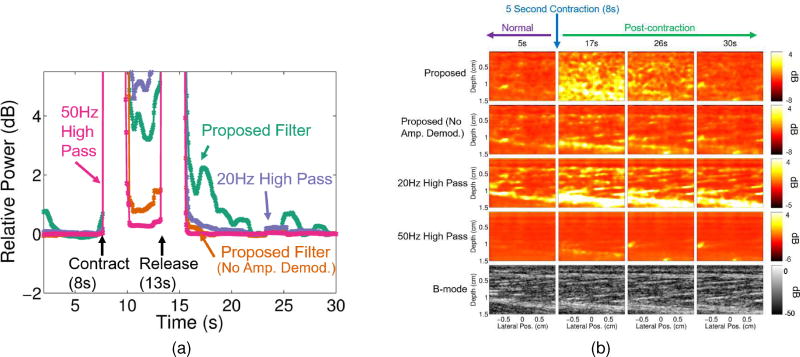
Figs. 6a and 7a show that the proposed filter case resulted in a larger dynamic range within the muscle compared to the case with no amplitude demodulation and the two conventional filters for both in vivo studies. For the occlusion study, dynamic ranges between the highest and lowest blood flow time points were 4.73dB, 1.79dB, 2.1dB and 0.15dB for the proposed, proposed with no amplitude demodulation, 20Hz conventional, and 50Hz conventional filters, respectively. For the contraction study, dynamic ranges between the highest and lowest blood flow time points were 4.80dB, 0.91dB, 1.95dB and 0.16dB for the proposed, the proposed with no amplitude demodulation, 20Hz conventional, and 50Hz conventional filters, respectively.
Fig. 6.
(a) Median relative power with respect to the last in vivo arterial occlusion time point (for each filtering method) is plotted for every 50ms for each filtering case: proposed filter (teal), proposed filter with no amplitude demodulation (orange), 20Hz high pass (purple), and 50Hz high pass (pink). The time point at which the cuff was released is marked by the dark gray vertical dotted line (at about 4s). (b) Power Doppler and corresponding B-mode images (bottom row) are shown for 2, 8, 22, and 30 second time points of the in vivo arterial occlusion scan for each filtering case: proposed filter (first row), proposed filter with no amplitude demodulation (second row), 20Hz high pass (third row), and 50Hz high pass (fourth row).
Fig. 7.
(a) Median relative power with respect to the last in vivo muscle contraction time point (for each filtering method) is plotted for every 50ms for each filtering case: proposed filter (teal), proposed filter with no amplitude demodulation (orange), 20Hz high pass (purple), and 50Hz high pass (pink). The time points at which the muscle contracted and released are marked with arrows (at about 8s and 13s, respectively). (b) Power Doppler and corresponding B-mode images (bottom row) are shown for 5, 17, 26, and 30 second time points of the in vivo muscle contraction scan for each filtering case: proposed filter (first row), proposed filter with no amplitude demodulation (second row), 20Hz high pass (third row), and 50Hz high pass (fourth row).
Figs. 6b and 7b further support these results qualitatively. Compared to the case with no amplitude demodulation and the conventional filter cases, the proposed filter case shows larger differences between the time points during occlusion and before contraction (2s and 5s) and the time points after occlusion and contraction (8, 22, and 30s for the occlusion case and 7 and 26s for the contraction case). Additionally, the case with no amplitude demodulation and the conventional filter cases show structure that is strongly correlated to structure seen in the B-mode images, whereas the proposed filter cases exhibit more independent structure, especially within the muscle ROI (between 0.5 and 1cm depths).
Time points between 4.55s and 6.95s were excluded when determining the axis in Fig. 6a and the scaling of the images in Fig. 6b. Time points between 7.7s and 15.65s were excluded when determining the axis in Fig. 7a and the scaling of the images in Fig. 7b. Excluded time points had 5th percentile normalized cross correlation values below 0.995.
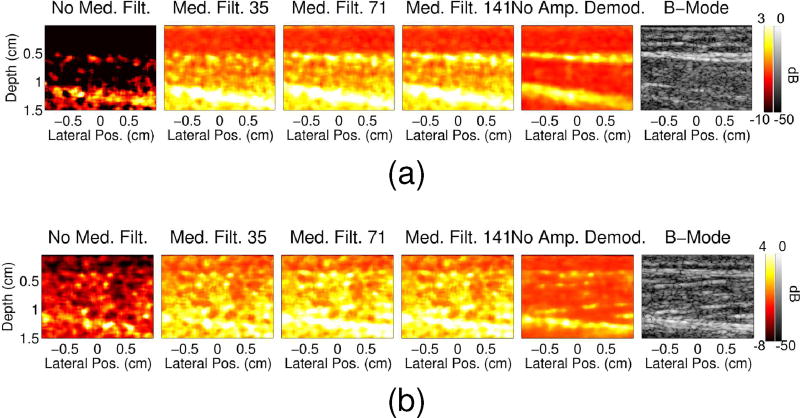
Fig. 8 shows power Doppler images for different amplitude demodulation methods. Images are shown for the 22s and 17s time points of the arterial occlusion and muscle contraction studies, respectively, at which we expect to see increased perfusion within the muscle. Increasing the size of the median filter used during amplitude demodulation increases the amount of B-mode structure seen in the power Doppler image, with the most B-mode structure seen when no amplitude demodulation is employed. Decreasing the size of the median filter appears to suppress the blood signal, but not completely. These trends support the results from the hand motion study which showed increased suppression of the tissue clutter with decreased median filter sizes used for the amplitude demodulation. These results also suggest that amplitude demodulation is able to suppress tissue clutter while still preserving blood flow.
Fig. 8.
Power Doppler images are shown for the 22 and 17 second time points of the (a) in vivo arterial occlusion and (b) muscle contraction scans, respectively, for data processed with no median filter (first column), with median filters of size 35 (second column), 71 (third column), 141 (fourth column), and with no amplitude demodulation (fifth column). The corresponding B-mode images are shown in the last column.
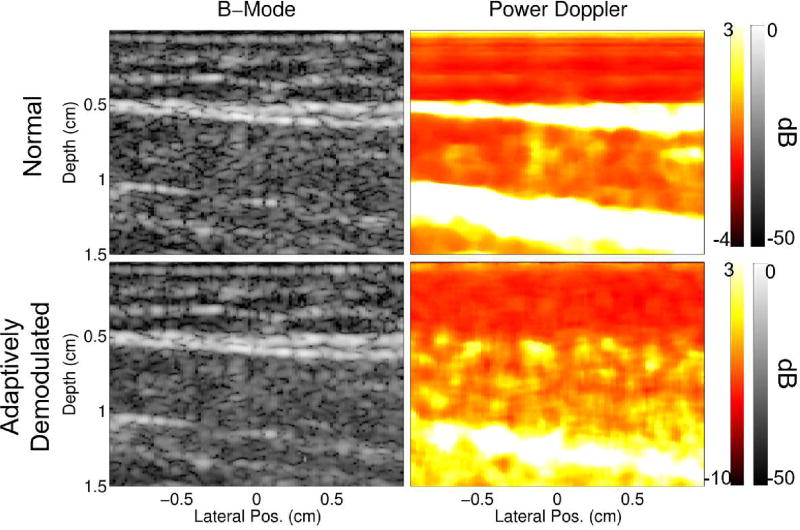
Fig. 9 shows larger views of the B-mode and power Doppler images before and after adaptive demodulation for the 22s time point of the in vivo occlusion scan. The normal B-Mode, normal power Doppler, and adaptively demodulated power Doppler images are the same as seen in Fig. 6b for the 22s time point B-mode, 20Hz high pass, and proposed rows, respectively. The adaptively demodulated B-mode image is included in Fig. 9 to show that the proposed phase and amplitude demodulation preserves B-mode structure. It also reveals new, independent power Doppler structure. This result therefore provides further evidence that power Doppler with adaptive demodulation suppresses tissue clutter while conserving blood signal compared to the conventional case, which has structure strongly correlated to the B-mode image. This observation is also supported quantitatively with normalized cross correlation values of 0.4743 and −0.0096 between the adaptively demodulated B-mode image and the conventional and adaptively demodulated power Doppler images, respectively.
Fig. 9.
B-mode and power Doppler images before and after adaptive demodulation (using a median filter of 35 samples for the amplitude demodulation) are shown for the 22s time point of the textitin vivo occlusion scan.
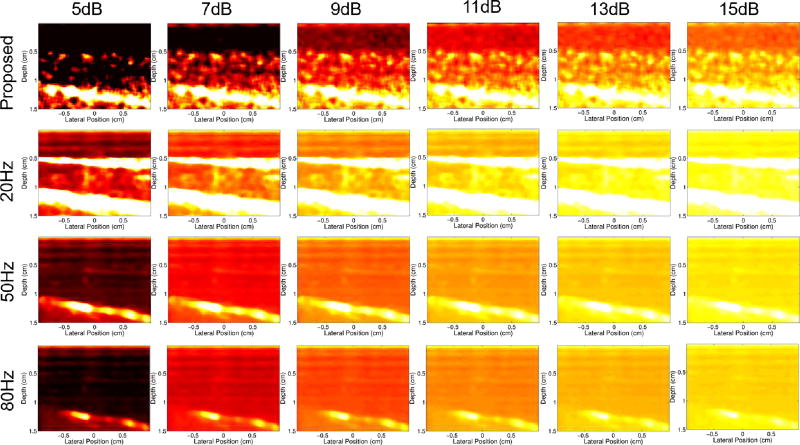
Fig. 10 shows power Doppler images with various dynamic ranges for the 22s time point of the occlusion scan for the proposed filter and conventional filter with different frequency cutoffs. Regardless of cutoff value, the conventional filter cases fail to resolve any of the independent structure within the muscle that is seen in the proposed filter case.
Fig. 10.
Power Doppler images made from the 22s time point of the occlusion scan for the proposed filter (first row) and conventional filter with 20Hz (second row), 50Hz (third row), and 80Hz (bottom row) filter cutoffs. Dynamic ranges between 5 and 15dB are compared. The maximum in all images is 3dB.
D. SNR Results
SNR values for the hand motion data acquisitions were computed to be 37.7dB, 45.3dB, and 46.4dB, for the SPW, PWSF, and MPW sequences, respectively. For the in vivo data, SNR was computed to be 36.8dB and 40.9dB, for the occlusion and contraction studies, respectively.
E. Simulation Results
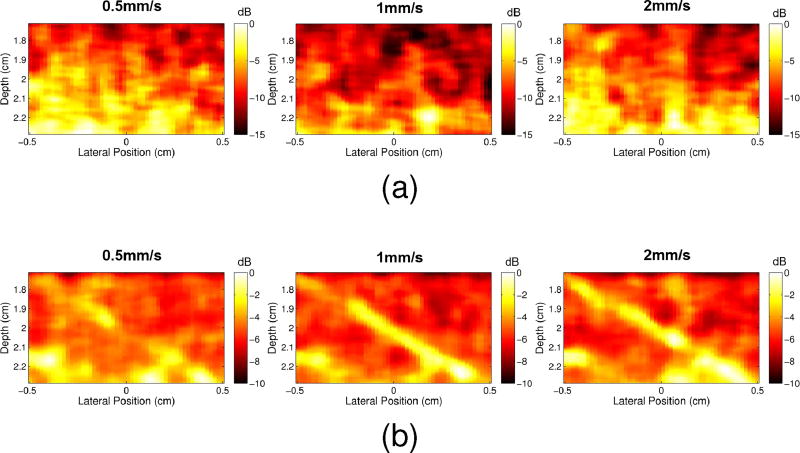
Fig. 11 demonstrates that, compared to conventional power Doppler, the proposed technique can suppress tissue clutter while preserving slow flow. The vessel is clearly seen in Fig. 11b for 1mm/s and 2mm/s peak velocities, while tissue clutter dominates in Fig. 11a for the same speeds. The 0.5mm/s adaptively demodulated case is less prominent, but still shows more flow than the normal power Doppler image for that speed.
Fig. 11.
Power Doppler images are shown for 0.5mm/s, 1mm/s, and 2mm/s parabolic blood scatterer velocities for (a) normal data and (b) adaptively demodulated data.
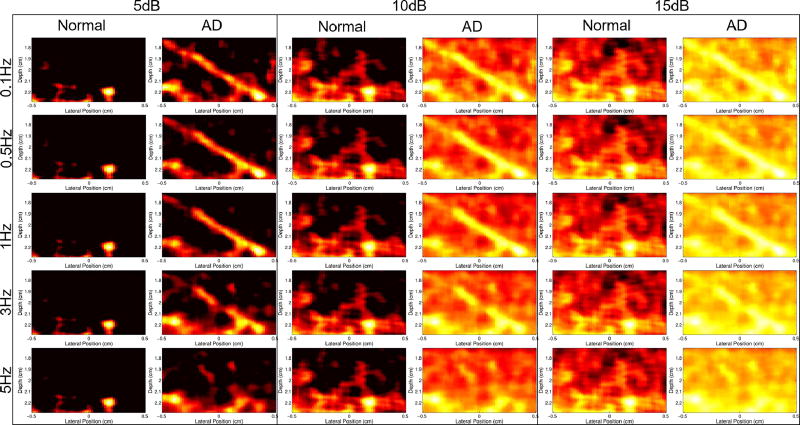
Fig. 12 shows normal and adaptively demodulated power Doppler images side-by-side for cutoff values between 0.1 and 5Hz (to detect flow above 0.01 and 0.5mm/s, respectively) and for dynamic ranges between 5 and 15dB. Regardless of clutter filter cutoff or dynamic range, no flow is visible with the conventional method.
Fig. 12.
Power Doppler images of the 1mm/s peak velocity simulation with and without adaptive demodulation (AD) (left and right in each column, respectively) are shown for dynamic ranges between 5 and 15dB (columns) with filter cutoffs between 0.1Hz and 5Hz (rows).
V. Discussion
The sonographer hand motion bandwidth results demonstrate that adaptive demodulation can isolate slow flow velocities from tissue clutter at relative blood signals at least 60dB lower than the tissue. Others have reported the amplitudes of blood signals as being up to 100dB lower than tissue clutter [3]. For our current system, the signal to noise limit is reached around 80dB below tissue after adaptive demodulation. The PWSF and MPW sequence modifications used for the hand motion studies both improve SNR and lower the noise floor by about 10dB (as seen in Fig. 3a). However, the MPW case did not result in improved bandwidth suppression at −60dB, and we only saw a minor improvement with the PWSF sequence (as seen in Table II). Since the PWSF sequence also improves resolution and image quality, the improvement seen with PWSF, although small, is not negligible and is likely due to decreased intrinsic spectral broadening resulting from the transmit beam shape. Since the SPW and MPW methods have lower resolution due to unfocused transmit beams, intrinsic spectral broadening will result from geometrical focal broadening during receive beamforming, resulting in larger bandwidths of the tissue clutter [28]. This suggests that intrinsic spectral broadening is a more immediate limitation of the method compared to SNR. Apart from sequence modifications, higher transmit voltage also improves SNR. However, the use of a higher transmit voltage (30.7V) for the hand motion phantom SPW study did not result in a substantially higher SNR value compared to the in vivo studies, which used the same acquisition sequence using only half the transmit voltage (16.1V). This is likely due to the the phantom and in vivo data being acquired on different media. However, this further suggests that SNR is not a significant direct limitation of the method.
The stationary phantom experiment illustrated the presence of signal amplitude modulation through slow-time even when no blood flow, hand motion, or patient physiological motion is present. The results from this experiment demonstrate the need for an amplitude demodulation step to more completely suppress the tissue clutter bandwidth. In principle, the amplitude demodulation method proposed would also affect the blood signal amplitude. Median filtering of the amplitude demodulation function was therefore proposed in an attempt to ensure that tissue signal is the primary contributor to the amplitude modulation estimate. Ideally, the median filter should be long enough to avoid suppression of the blood signal and short enough to allow for maximal tissue clutter suppression. For example, if blood flows outside of a given pixel faster than the acquisition rate (i.e. blood is incoherent between consecutive acquisitions), small median filter sizes would suffice. Although little is known about the coherence length of slow flow, it is plausible that when imaging slow flow, the blood signal will be coherent across a longer time than with fast flow. Therefore, larger filter sizes would be required to ensure the blood signal amplitude is not demodulated. A median filter of 35 samples was used for the experiments in this paper. Additionally, the effects of increasing the filter size on tissue clutter bandwidth and qualitative power Doppler images were assessed. Future work will aim to confirm optimal, application-specific filter sizes.
Expected reactive and exercise hyperemia behaviors are well characterized, which provided reasonable standards for evaluating our algorithm in applicable clinical settings. Although the in vivo results presented in this paper are preliminary, both the arterial occlusion and contraction studies are consistent with previous findings of perfusion and blood-oxygen-level-dependent (BOLD) MRI characteristics under these conditions. For the arterial occlusion study, Lebon et al. and Englund et al. both showed time to peak perfusion times between 15 and 20s after arterial occlusion in the calf muscle, which agrees with the results shown in Fig. 6a [29], [30]. For the adaptively demodulated data with a 20Hz high pass filter (proposed filter method), the peak blood flow time point occurs at about 22s, which is about 18s after the cuff was released (cuff was released at about 4s), as seen in Fig. 6a. Similarly for the contraction study, Towse et al. showed that peak BOLD signal intensity occurs between 5–7s post-muscle contraction, which correlates with the results shown in Fig. 7a [25], [31]. In Fig. 7a, the proposed filter method resulted in peak power at about 17s which is approximately 5s post-contraction (last contraction time point occurs at about 12s). It is also important to note that the median power Doppler values in both Figs. 6a and 7a are referenced to the last time point for each case. We therefore expected to see power Doppler values below or at least at zero during occlusion and before contraction, assuming there should be increased perfusion post-occlusion and post-contraction, which was not the case. However, results found in the literature show similar trends in perfusion values, with post-occlusion and post-contraction values even decreasing to values below those during occlusion and before contraction after reaching peak perfusion [25], [29], [30].
Although the in vivo studies involved changes in blood flow and are supported by similar findings in the literature, neither study definitively proved that the proposed technique is able to suppress tissue clutter while also preserving slow flow. The simulation results address this and are consistent with other experiments in the literature for testing slow flow detection [14], [15]. The simulation results confirm that the technique can preserve slow flow in addition to suppressing tissue clutter.
Finally, our results indicate that previous limits on blood flow estimation with ultrasound are not fundamental and are conservative [4]. The true fundamental limit remains an open question.
VI. Conclusion
Due to spectral broadening caused by patient and sonographer hand motion, conventional Doppler methods are limited to blood flow above 5–10mm/s for clinical imaging frequencies, which eliminates sensitivity to slow flow or perfusion [4]. To address this, we introduced an adaptive clutter demodulation scheme that suppresses the bandwidth of tissue clutter while still preserving signal from slow blood flow. The proposed algorithm was developed and assessed by way of phantom and in vivo studies. The approach was shown to successfully reduce hand motion spectrum bandwidths, potentially allowing for the detection of blood velocities well below assumed theoretical limits. Additionally, the proposed filter resulted in a higher dynamic range between the lowest and highest blood flow time points compared to conventional filters for both in vivo studies. Furthermore, both in vivo studies resulted in peak blood flow time points that supported previous findings.
Acknowledgments
The authors would like to thank the staff of the Vanderbilt University ACCRE computing resource. This work was supported in part by NIH grants 1RO1HL128715 and S10OD016216-01.
Contributor Information
Jaime Tierney, Department of Biomedical Engineering, Vanderbilt University, Nashville, TN, USA.
Crystal Coolbaugh, Department of Radiology and Radiological Sciences, Vanderbilt University Medical Center, Nashville, TN, USA; Institute of Imaging Science, Vanderbilt University, Nashville, TN, USA.
Theodore Towse, Department of Physical Medicine and Rehabilitation, Vanderbilt University, Nashville, TN, USA.
Brett Byram, Department of Biomedical Engineering, Vanderbilt University, Nashville, TN, USA.
References
- 1.Tremblay-Darveau C, Williams R, Milot L, Bruce M, Burns PN. Combined perfusion and doppler imaging using plane-wave nonlinear detection and microbubble contrast agents. IEEE Transactions on Ultrasonics, Ferroelectrics and Frequency Control. 2014;61:1988–2000. doi: 10.1109/TUFFC.2014.006573. [DOI] [PubMed] [Google Scholar]
- 2.Jensen JA. Estimation of Blood Velocities Using Ultrasound: A Signal Processing Approach. Cambridge: Cambridge UP; 1996. [Google Scholar]
- 3.Bjaerum S, Torp H, Kristoffersen K. Clutter filters adapted to tissue motion in ultrasound color flow imaging. IEEE Transactions on Ultrasonics, Ferroelectrics, and Frequency Control. 2002;49:693–704. doi: 10.1109/tuffc.2002.1009328. [DOI] [PubMed] [Google Scholar]
- 4.Heimdal A, Torp H. Ultrasound doppler measurements of low velocity blood flow: limitations due to clutter signals from vibrating muscles. IEEE Transactions on Ultrasonics, Ferroelectrics and Frequency Control. 1997;44:873–881. [Google Scholar]
- 5.Bjaerum S, Torp H, Kristoffersen K. Clutter filter design for ultrasound color flow imaging. IEEE Transactions on Ultrasonics, Ferroelectrics, and Frequency Control. 2002;49:204–216. doi: 10.1109/58.985705. [DOI] [PubMed] [Google Scholar]
- 6.Fadnes S, Bjaerum S, Torp H, Lovstakken L. Clutter filtering influence on blood velocity estimation using speckle tracking. IEEE Transactions on Ultrasonics, Ferroelectrics, and Frequency Control. 2015;62:2079–2091. doi: 10.1109/TUFFC.2015.007247. [DOI] [PubMed] [Google Scholar]
- 7.Demene C, Deffieux T, Pernot M, Osmanski BF, Biran V, Franqui S, Tanter M. Spatiotemporal clutter filtering of ultrafast ultrasound data highly increases doppler and fultrasound sensitivity. IEEE Transactions on Medical Imaging. 2015;34:2271–2285. doi: 10.1109/TMI.2015.2428634. [DOI] [PubMed] [Google Scholar]
- 8.Tangelder GJ, Slaaf DW, Muijtjens AM, Arts T, oude Egbrink MG, Reneman RS. Velocity profiles of blood platelets and red blood cells flowing in arterioles of the rabbit mesentery. Circulation Research. 1986;59:505–514. doi: 10.1161/01.res.59.5.505. [DOI] [PubMed] [Google Scholar]
- 9.Udesen J, Gran F, Hansen KL, Jensen JA, Thomsen C, Nielsen MB. High frame-rate blood vector velocity imaging using plane waves: Simulations and preliminary experiments. IEEE Transactions on Ultrasonics, Ferroelectrics, and Frequency Control. 2008;55:1729–1743. doi: 10.1109/TUFFC.2008.858. [DOI] [PubMed] [Google Scholar]
- 10.Montaldo G, Tanter M, Bercoff J, Benech N, Fink M. Coherent plane-wave compounding for very high frame rate ultrasonography and transient elastography. IEEE Transactions on Ultrasonics, Ferroelectrics, and Frequency Control. 2009;56:489–506. doi: 10.1109/TUFFC.2009.1067. [DOI] [PubMed] [Google Scholar]
- 11.Thomas L, Hall A. An improved wall filter for flow imaging of low velocity flow. IEEE Ultrasonics Symposium Proceedings. 1994;3:1701–1704. [Google Scholar]
- 12.Gallippi C, Trahey G. Adaptive clutter filtering via blind source separation for two-dimensional ultrasonic blood velocity measurement. Ultrasonic Imaging. 2002;24:193–214. doi: 10.1177/016173460202400401. [DOI] [PubMed] [Google Scholar]
- 13.Lediju MA, Trahey GE, Byram BC, Dahl JJ. Shortlag spatial coherence of backscattered echoes: Imaging characteristics. IEEE Transactions on Ultrasonics, Ferroelectrics, and Frequency Control. 2011;58:1377–1388. doi: 10.1109/TUFFC.2011.1957. [DOI] [PMC free article] [PubMed] [Google Scholar]
- 14.Li YL, Dahl JJ. Coherent flow power doppler (cfpd): Flow detection using spatial coherence beamforming. IEEE Transactions on Ultrasonics, Ferroelectrics, and Frequency Control. 2015;62:1022–1035. doi: 10.1109/TUFFC.2014.006793. [DOI] [PMC free article] [PubMed] [Google Scholar]
- 15.Li YL, Hyun D, Abou-Elkacem L, Willmann JK, Dahl J. Visualization of small-diameter vessels by reduction of incoherent reverberation with coherent flow power doppler. IEEE Transactions on Ultrasonics, Ferroelectrics, and Frequency Control. 2016;63:1878–1889. doi: 10.1109/TUFFC.2016.2616112. [DOI] [PMC free article] [PubMed] [Google Scholar]
- 16.Tierney JE, Dumont DM, Byram BC. Proc. SPIE9790, Medical Imaging 2016: Ultrasonics Imaging and Tomography. San Diego, CA, USA: Apr, 2016. Perfusion imaging with non-contrast ultrasound. [Google Scholar]
- 17.Tierney JE, Coolbaugh C, Towse T, Byram BC. Proceedings of the IEEE International Ultrasonics Symposium. Tours, France: Sep, 2016. Plane wave perfusion ultrasound imaging without contrast. [Google Scholar]
- 18.Loupas T, Powers JT, Gill RW. An axial velocity estimator for ultrasound blood flow imaging, based on a full evaluation of the doppler equation by means of a two-dimensional autocorrelation approach. IEEE Transactions on Ultrasonics, Ferroelectrics, and Frequency Control. 1995;42:672–688. [Google Scholar]
- 19.Dahl JJ, McAleavey SA, Pinton GF, Soo MS, Trahey GE. Adaptive imaging on a diagnostic ultrasound scanner at quasi real-time rates. IEEE Transactions on Ultrasonics, Ferroelectrics, and Frequency Control. 2006;53:1832–1843. doi: 10.1109/tuffc.2006.115. [DOI] [PubMed] [Google Scholar]
- 20.Guass RC, Trahey GE, Soo MS. Wavefront estimation in the human breast. Medical Imaging 2001. International Society for Optics and Photonics. 2001 May;:172–181. [Google Scholar]
- 21.Pinton GF, Dahl JJ, Trahey GE. Rapid tracking of small displacements with ultrasound. IEEE Transactions on Ultrasonics, Ferroelectrics, and Frequency Control. 2006;53:1103–1117. doi: 10.1109/tuffc.2006.1642509. [DOI] [PubMed] [Google Scholar]
- 22.Thompson RB, Aviles RJ, Faranesh AZ, Venkatsh K, Wright V, Balaban RS, Lederman RJ. Measurement of skeletal muscle perfusion during postischemic reactive hyperemia using contrast-enhanced mri with a step-input function. Magnetic resonance in medicine. 2005;54:289–298. doi: 10.1002/mrm.20535. [DOI] [PMC free article] [PubMed] [Google Scholar]
- 23.Lopez D, Pollak A, Meyer CH, Jiji R, Epstein FH, Hunter JR, Christopher JM, Kramer CM. Asl demonstrates higher and more homogenous calf muscle perfusion with post-occlusion hyperemia than with exercise. Resonance. 2013;15:216. [Google Scholar]
- 24.Towse TF, Childs BT, Sabin SA, Bush EC, Elder CP, Damon BM. Comparison of muscle bold responses to arterial occlusion at 3 and 7 tesla. Resonance. 2015 doi: 10.1002/mrm.25562. [DOI] [PMC free article] [PubMed] [Google Scholar]
- 25.Towse TF, Slade JM, Meyer RA. Effect of physical activity on mri-measured blood oxygen level-dependent transients in skeletal muscle after brief contractions. Journal of Applied Physiology. 2005;99:715–722. doi: 10.1152/japplphysiol.00272.2005. [DOI] [PMC free article] [PubMed] [Google Scholar]
- 26.Friemel BH, Bohs LN, Nightingale KR, Trahey GE. Speckle decorrelation due to two-dimensional flow gradients. IEEE Transactions on Ultrasonics, Ferroelectrics, and Frequency Control. 1998;45:317–327. doi: 10.1109/58.660142. [DOI] [PubMed] [Google Scholar]
- 27.Jensen JA. Field: A program for simulating ultrasound systems. Med. Biol. Eng. Comput. 1996;34:351–353. [Google Scholar]
- 28.Guidi G, Licciardello C, Falteri S. Intrinsic spectral broadening (isb) in ultrasound doppler as a combination of transit time and local geometrical broadening. Ultrasound in Medicine and Biology. 2000;26:853–862. doi: 10.1016/s0301-5629(00)00218-0. [DOI] [PubMed] [Google Scholar]
- 29.Lebon V, Carlier PG, Brillault-Salvat C, Leroy-Willig A. Simultaneous measurement of perfusion and oxygenation changes using a multiple gradient-echo sequence: application to human muscle study. Magnetic Resonance Imaging. 1998;16:721–729. doi: 10.1016/s0730-725x(98)00088-5. [DOI] [PubMed] [Google Scholar]
- 30.Englund EK, Langham MC, Li C, Rodgers ZB, Floyd TF, Mohler ER. Combined measurement of perfusion, venous oxygen saturation, and skeletal muscle t2* during reactive hyperemia in the leg. Journal of Cardiovascular Magnetic Resonance. 2013;15:1–13. doi: 10.1186/1532-429X-15-70. [DOI] [PMC free article] [PubMed] [Google Scholar]
- 31.Towse TF, Slade JM, Ambrose JA, DeLano MC, Meyer RA. Quantitative analysis of the postcontractile blood-oxygenation-level-dependent (bold) effect in skeletal muscle. Journal of Applied Physiology. 2011;111:27–39. doi: 10.1152/japplphysiol.01054.2009. [DOI] [PMC free article] [PubMed] [Google Scholar]


