

Abstract
Paulownia fortunei is a widely cultivated economic forest tree species that is susceptible to infection with phytoplasma, resulting in Paulownia witches' broom (PaWB) disease. Diseased P. fortunei is characterized by stunted growth, witches' broom, shortened internodes, and etiolated and smaller leaves. To understand the molecular mechanism of its pathogenesis, we applied isobaric tags for relative and absolute quantitation (iTRAQ) and liquid chromatography coupled with tandem mass spectrometry approaches to study changes in the proteomes of healthy P. fortunei, PaWB-infected P. fortunei, and PaWB-infected P. fortunei treated with 15 mg·L−1 or 75 mg·L−1 dimethyl sulfate. We identified 2969 proteins and 104 and 32 differentially abundant proteins that were phytoplasma infection responsive and dimethyl sulfate responsive, respectively. Based on our analysis of the different proteomes, 27 PaWB-related proteins were identified. The protein-protein interactions of these 27 proteins were analyzed and classified into four groups (photosynthesis-related, energy-related, ribosome-related, and individual proteins). These PaWB-related proteins may help in developing a deeper understanding of how PaWB affects the morphological characteristics of P. fortunei and further establish the mechanisms involved in the response of P. fortunei to phytoplasma.
1. Introduction
Paulownia fortunei is a fast-growing tree species native to China, which belongs to the Scrophulariaceae family. It is planted widely for its high economic value and medicinal properties. Unfortunately, it is susceptible to Paulownia witches' broom disease, a serious and destructive disease, caused by phytoplasmas that belong to “Candidatus Phytoplasma australiense.” These phytoplasmas are unculturable, lack cell walls, and have obligated symbiotic relationships with insects and plants [1], resulting in symptoms of witches' broom, short internodes, phyllody, and yellowing of leaves, eventually resulting in death [2, 3]. Phytoplasmas infect P. fortunei plants through phloem-feeding insect vectors and then reproduce and transmit in phloem sieve cells to obtain nutrients and carbohydrates as well as secreting effectors.
Phytoplasmas have been determined to infect more than 100 plant species, and intensive studies have been initiated to research the interaction between phytoplasmas and host plants at the molecular level. Mulberry is an economic woody plant that can be invaded by phytoplasmas resulting in yellow dwarf disease. In a previous 2-DE study in mulberry, 37 differentially abundant proteins (DAPs) were detected, and the abundance of some proteins that were found to be indispensable for photosynthesis was reduced in infected mulberry leaves [4]. In subsequent small RNA and metabolomic analyses in infected mulberry, phytoplasma was thought to disturb the balance of phytohormones as well as to promote the presence of hydrogen peroxide and superoxide [5, 6]. Phytoplasmas also infect Catharanthus roseus resulting in peanut witches' broom. The microRNA (miRNA) miR396 was shown to be inhibited by PHYL1 effector, thereby promoting the expression of its target gene SHORT VEGETATIVE PHASE (SVP) in infected C. roseus [7]. Genes involved in defense and flowering in C. roseus were found by transcriptome analysis to be altered. For example, the expression levels of CrSVP1/2 and CrFT increased, which played critical roles particularly in leafy flower transition [8]. Phytoplasmas have also been studied in other plant species, such as lime tree and grapevine [9, 10].
Many researchers, including members of our group, have studied Paulownia witches' broom (PaWB) for a number of decades. Recently, we found that dimethyl sulfate (DMS) could make the morphology of PaWB-infected seedling become normal [11]. In addition, studies of PaWB at the physiological, biochemical, and molecular levels have been performed using transcriptome, miRNA, and degradome analyses and methylation-sensitive amplified polymorphism approaches [12–17]. As a result, some genes and miRNAs, possibly associated with the response to phytoplasma invasion, have been identified in Paulownia. For instance, Mou et al. found that the expression levels of genes associated with cytokinin biosynthesis and cell wall were raised, while the expression levels of genes involved in photosynthesis were reduced in infected compared with healthy Paulownia [16]. We verified that the expression of genes related to phytohormones, phenylpropanoid, and circadian rhythm were changed in phytoplasma-infected P. fortunei [18]. However, the molecular mechanisms of PaWB are still poorly understood.
Proteins play important roles in metabolism, catalyzing many biochemical reactions involved in the lifecycles of plants [19]. Proteomics, the simultaneous large-scale analysis of the protein component of an organism, is considered to provide more useful information than genomics and has been applied successfully to gain insights into plant defense responses to pathogens [19]. Protein labeling by isobaric tags for relative and absolute quantitation (iTRAQ) for mass spectrometry has wide application in proteomics and has several advantages over traditional technologies like 2-DE [20–23]. Firstly, all types of proteins can be labeled by iTRAQ, which facilitates reliability and coverage of protein identification. Secondly, iTRAQ is easy to perform and can be combined directly with mass spectrometry. Thirdly, eight samples can be compared at the same time by iTRAQ, which increases label efficiency and reduces technical error.
In this study, we applied proteomic analysis to investigate alterations in protein abundance levels before and after phytoplasma invasion in Paulownia. We used healthy P. fortunei (PF), PaWB-infected P. fortunei (PFI), and PFI treated with 15 mg·L−1 or 75 mg·L−1 DMS to explore the interactions between phytoplasma and P. fortunei by iTRAQ and liquid chromatography coupled with tandem mass spectrometry (LC-MS/MS). The proteomic data analysis and functional annotations of the proteins detected in our study showed that the phytoplasma was highly associated with mechanisms related to antioxidants and phytohormones in P. fortunei. Our results will provide a foundation for better understanding the mechanisms of phytoplasma infection in plants in the future.
2. Materials and Methods
2.1. Plant Materials and Treatments
The P. fortunei seedlings used in this study were obtained from the Institute of Paulownia, Henan Agricultural University, China. Seedlings of healthy P. fortunei and P. fortunei infected with PaWB were cultured on 1/2 Murashige-Skoog (MS) medium with 20 g·L−1 sucrose and 8 g·L−1 agar for 30 days. Then, the 4 cm long terminal buds of the PF, PFI, and PFI with 15 mg·L−1 (PFI-15) and 75 mg·L−1 (PFI-75) DMS were soaked in 100 mL flasks at 16°C under dark. After soaking for 5 hours, the seedlings were cultured on 1/2 MS medium with 20 g·L−1 sucrose and 8 g·L−1 agar in 100 mL flasks at 25 ± 2°C under 130 μmol·m−2·s−1 intensity light for 16 h every day. After 30 days, the 1.5 cm long terminal buds of the seedlings were sheared and immediately stored at −80°C for further study. The terminal buds from three individual plants were combined to form one biological replicate, and at least three biological replicates were used for each treatment.
2.2. Phytoplasma Detection
We applied nested PCR to detect phytoplasma in seedlings according to the method described by Zhao et al. The primer pairs used to amplify the 16S rDNA of the phytoplasma were R16mF1/R16mR1 (5′-CATGCAAGTCGAACGGA-3′/5′-CTTAACCCCAATCATCGAC-3′) and R16mF2/R16mR2 (5′-ACGACTGCTAAGACTGG-3′/5′-CGGGGTTTGTACACACCGC-3′). Agarose gel electrophoresis was applied as described by Fan et al. [24]. Three biological replicates were performed.
2.3. Protein Extraction
The four stored P. fortunei samples (PF, PFI, PFI-15, and PFI-75) were ground to powder in liquid nitrogen and then extracted with lysis buffer (7 M Urea, 2 M Thiourea, 4% CHAPS, 40 mM Tris-HCl, and pH 8.5) containing 1 mM PMSF and 2 mM EDTA. The proteins were extracted, reduced, and alkylated according to a previously described procedure [25]. The protein was quantified using the Bradford method [26]. Finally, the quantified proteins in the supernatant were extracted and stored at −80°C prior to sample cleanup if not for immediate use. Two replicates were used for each accession.
2.4. Protein Digestion, iTRAQ Labeling, and Strong Cation Exchange
Total protein (100 μg) from each sample solution was digested with Trypsin Gold (Promega, Madison, WI, USA; protein : trypsin ratio of 30 : 1) at 37°C for 16 hours [27]. After trypsin digestion, the peptides were dried by vacuum centrifugation. Peptides were reconstituted in 0.5 M TEAB and processed according to the manufacturer's protocol for the 8-plex iTRAQ reagent (Applied Biosystems, Foster City, CA, USA). The iTRAQ experiment was performed on two independent biological replicates. Strong cation exchange chromatography was performed with a LC-20AB HPLC Pump system, as described by Dong et al. [28]. The procedure used for the strong cation exchange chromatography is described in Supplemental Protocol 1 available online at https://doi.org/10.1155/2017/6542075.
2.5. LC-MS/MS Analysis
The mass spectroscopy analysis was performed using a TripleTOF 5600 mass spectrometer (AB SCIEX, Framingham, MA, USA) and coupled with an online micro flow HPLC system, as described previously [29]. Details are given in Supplemental Protocol 2.
2.6. Proteomic Data Analysis
The mass spectrometry data were processed using Proteome Discoverer 1.2 software (Thermo Fisher Scientific, San Jose, CA, USA). Details are given in Supplemental Protocol 3. Protein identification and quantification were performed using the Mascot search engine (Matrix Science, London, UK; version 2.3.02) against the NCBI plant database, which contained 1,495,258 sequences. For protein identification, only peptides with significance scores (≥20) at the 99% confidence interval obtained by a Mascot probability analysis greater than “identity” were counted as identified. Every confident protein identification was associated with at least one unique peptide. For protein quantitation, a protein had to contain at least two unique peptides. The quantitative protein ratios were weighted and normalized by the median ratio in Mascot. Proteins with p values < 0.05 and fold changes > 1.2 or <0.83 were considered as significantly differentially abundant proteins (DAPs).
2.7. Functional Annotation of the Proteins
Functional annotation of the proteins was conducted using the Blast2GO program against NCBI's nonredundant protein database to assign Gene Ontology (GO) terms. The Kyoto Encyclopedia of Genes and Genomes (KEGG) database (http://www.genome.jp/kegg/) and the Clusters of Orthologous Groups (COG) database (http://www.ncbi.nlm.nih.gov/COG/) were used to classify and group the identified proteins.
2.8. Quantitative Real-Time PCR Analysis
The four samples PF, PFI, PFI-15, and PFI-75 that were stored at −80°C were used to extract total RNAs by Trizol reagent. After purification with DNase I, the concentrated RNAs were reverse transcribed into cDNAs with a GoScript™ Reverse Transcription System. The 18S primers were Forward, 5′-ACATAGTAAGGATTGACAGA-3′, and Reverse, 5′-TAACGGAATTAACCAGACA-3′. We randomly selected 14 DAPs and obtained the genes encoding them by BLAST searches. The primers that were designed for the 14 genes are listed in Table 1. The PCR reactions were performed in 20 μL final volume, including 2 μL cDNAs, 10 μL SYBR, and 6.4 μL ddH2O with the following thermal cycle: 95°C for 3 min, followed by 40 cycles of 95°C for 10 s, and 57°C for 20 s. The relative expression of the 14 genes were calculated by the 2−ΔΔCT relative quantization method.
Table 1.
Primers of 14 genes used for qRT-PCR analysis.
| Unigene ID | Sense primer | Antisense primer |
|---|---|---|
| Unigene7925_All | AACACAGGAACATTATGAT | CTCTCAGCATACTTAACC |
| Unigene31114_All | GGTGAATGTGAAGAAGTA | GGAGTTCCTATCGTAATG |
| CL8897.Contig2_All | TCATCTCTTCTGCTAACG | TTACCACCTCCATTGATT |
| CL11278.Contig2_All | AGAGCCTATTGATGAGAG | ACCTTGATACCAGTTACA |
| Unigene336_All | ATATGTTCTTCAGGTAGTC | TTCCATTACTTGGTATTGA |
| CL9513.Contig1_All | GAACCAAGAAATCTCCTC | AGCCATCCAGATATTCAG |
| CL1290.Contig8_All | CTCATCGGATTGATACTC | CTCTGATAGACCAACATAT |
| CL6627.Contig1_All | TCCTCTCGTCATATACTC | CCAATGCTCTTGTCAATA |
| CL11706.Contig4_All | AAGAGGATATGGTTGATG | ACAATACGGAATACACAT |
| Unigene2023_All | CTATGGCTGACTGGTATA | CAACATTACGGCTTTACT |
| CL9190.Contig2_All | CTCAAAGTCAAGGAAATC | ATAATGATGTCTCCAATGT |
| CL6122.Contig3_All | GATTCAGATGTATCACTTG | CAGCAACTATCCTATCAA |
| CL9804.Contig2_All | AAGAGCATCAGCATAAGA | CCAACAATAGAACGCATTA |
| Unigene34200_All | GGTACTCTGATCTCTTATG | TGAACTTCTCTATTGACTTA |
3. Results
3.1. Morphological Analysis and Phytoplasma Detection in P. fortunei
P. fortunei seedlings infected with PaWB were treated with different concentration of DMS. Through observation, we found that the rooting rate and other morphologic changes were distinctly different in PaWB-infected P. fortunei with DMS treatment (Table 2 and Figure 1). On the 10th day of treatment, the rooting rate was 96.67% in PFI, 86.67% in PFI-15, and 0% in PFI-75; on the 20th day, the rooting rate was 100% in both PFI and PFI-15 and 40% in PFI-75; and on the 30th day, the rooting rate of PFI-75 was 60%. Thus, the rooting rates decreased with increased DMS concentrations. Morphologically, the PFI seedlings were characterized by witches' broom, shortened internodes, swollen terminal buds, yellowing of leaves, and smaller leaves without chaeta. After the 15 and 75 mg·L−1 DMS treatments, the seedlings recovered a healthy morphology, such as normal internodes and terminal buds, no axillary buds, and green leaves with chaeta. In addition, fragments (1.24 kb in length) of the 16S rDNA from the PaWB phytoplasma [30] were found to be expressed in the PFI and PFI-15 seedlings, but not in the PF and PFI-75 seedlings by nested PCR (Figure 2). In our previous studies [11], we found that there were no changes in the DNA sequences at the simple sequence repeat level among the PaWB-infected Paulownia and recovered PaWB-infected Paulownia that had healthy morphology due to DMS treatment. The global DNA methylation level of diseased seedlings was lower than that of healthy seedlings, and the global DNA methylation level of recovered healthy diseased seedlings due to oxytetracycline treatment was higher than that of untreated diseased seedlings [31]. Consequently, it might be inferred that DMS may enhance DNA methylation in PaWB-infected seedlings allowing them to recover and become healthy. Further, DMS may restrain not only phytoplasma growth and division but also, to an extent, the regular growth of seedlings.
Table 2.
Rooting rates and morphologic changes in PaWB-infected P. fortunei with DMS treatment.
| Samples | Concentrations (mg·L−1) | Rooting rates at various days (%) | Axillary buds | Internodes and leaves | Terminal bud growth | ||
|---|---|---|---|---|---|---|---|
| 10 d | 20 d | 30 d | |||||
| PFI | 0 | 96.67 | 100 | 100 | With | Shortened internodes and small and yellow leaves without chaeta | Swelling |
| PFI-15 | 15 | 86.67 | 100 | 100 | Without | Normal internodes and green leaves with chaeta | Normal |
| PFI-75 | 75 | 0 | 40 | 60 | Without | Normal internodes and green leaves with chaeta | Normal |
PFI: PaWB-infected P. fortunei; PFI-15: 15 mg·L−1 DMS-treated PFI; PFI-75: 75 mg·L−1 DMS-treated PFI.
Figure 1.

Morphology of P. fortunei seedlings treated with dimethyl sulfate (DMS). (a) Morphology of PFI. (b) Morphology of 15 mg·L−1 DMS-treated PFI. (c) Morphology of 75 mg·L−1 DMS-treated PFI. (d) Morphology of PF.
Figure 2.
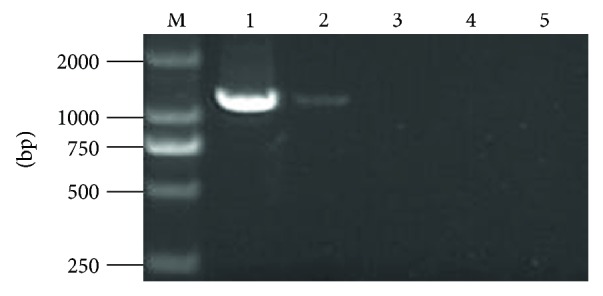
Phytoplasma 16S rDNA amplication in DMS-treated P. fortunei. (M) DNA marker. (1) PFI. (2) PFI-15. (3) PFI-75. (4) PF. (5) ddH2O.
3.2. Statistical Analysis and Identification of Proteins in the P. fortunei Proteome
Through the application of iTRAQ technology, we obtained 458,154 total spectra for the two biological replicates using a mass spectrometer TripleTOF 5600 (Table 3). After Mascot analysis and data filtering to eliminate low-scoring spectra, 18,216 spectra, which represented approximately 3.98% of the total spectra, were matched. Subsequently, 10,870 unique spectra were detected and a total of 2969 proteins were identified for further analysis (Supplementary Table 1). The majority of peptides were from nine to 15 amino acids long and peptides with 11 and 12 amino acids accounting for approximately 22% of all peptides (Figure 3(a)). The number of identified proteins was highest when only one peptide matched and decreased as the numbers of peptides that matched the proteins increased (Figure 3(b)). Proteins with masses of 30–40 kDa were the most abundant, followed by proteins of 40–50 kDa and 50–60 kDa (Figure 3(c)). The producibility of the proteomic analysis showed that the proteome results were reliable (Supplementary Figure 1).
Table 3.
Statistics of proteins identified by iTRAQ.
| Group name | Total spectra | Spectra | Unique spectra | Peptide | Unique peptide | Protein |
|---|---|---|---|---|---|---|
| Repeat 1 | 232,791 | 9037 | 5296 | 3030 | 2194 | 1863 |
| Repeat 2 | 225,363 | 9179 | 5574 | 3455 | 2519 | 2121 |
| Combined | 458,154 | 18,216 | 10,870 | — | — | 2969 |
Figure 3.

Statistics of basic information of proteins. (a) Percentage of different length of peptide in all peptides. (b) Distribution of matched peptide number in identified proteins. (c) Distribution of relative molecular mass of identified proteins.
Functional classification was performed based on the three main GO categories, biological process, cellular component, and molecular function (Supplementary Figure 2). Under cellular component, the largest numbers of proteins were annotated as involved in both cell (20.29%) and cell part (20.29%). Under molecular function, the largest number of proteins was annotated as involved in binding (42.44%). Under biological process, the largest number of proteins was annotated as involved in metabolic process (18.26%). Together, these two terms accounted for nearly half the annotations assigned under molecular function, which implied that the 2969 identified proteins mainly played prominent roles in binding and catalytic activity.
The function classification based on the COG database assigned the identified proteins to 23 categories (Supplementary Figure 3). Among them, “posttranslational modification, protein turnover, chaperones” was the largest category with 379 proteins, followed by “energy production and conversion,” “general function prediction only,” and “carbohydrate transport and metabolism,” all of which contained more than 300 proteins. “Cell motility” was the smallest group with only two proteins.
3.3. Analysis of Differentially Abundant Proteins in P. fortunei
Proteins with fold changes > 1.2 or <0.83 and p values < 0.05 were considered to be differentially abundant. We detected 106 DAPs in the PF versus PFI-75 (44 more abundant and 62 less abundant), 82 in PFI versus PFI-15 (44 more abundant and 38 less abundant), 64 in PFI-15 versus PFI-75 (29 more abundant and 35 less abundant), and 104 in PF versus PFI (37 more abundant and 67 less abundant). The PFI versus PFI-15 comparison was the only one in which the number of more abundant proteins was higher than the number of less abundant proteins.
The 104 DAPs that were identified in PF versus PFI may help to reveal the response of P. fortunei to phytoplasma infection. Based on the functional analysis of these DAPs, 39 KEGG pathways responsive to phytoplasma infection were detected, including the highly enriched “photosynthesis,” “photosynthesis-antenna proteins,” and “ribosome” pathways (Supplementary Table 2). The GO functional analysis revealed 55 biological process terms, 30 cellular component terms, and 12 molecular function terms that were significantly enriched (Supplementary Table 3).
To analyze the response of PaWB-infected P. fortunei to DMS treatment, we compared the DAPs in the PFI versus PFI-15 and PFI-15 versus PFI-75 comparisons and chose the 32 DAPs that were common in these two comparisons as the DMS-responsive DAPs. The annotations indicated that the 32 DAPs were related to photosynthesis, protein synthesis, metabolism, and nitrogen metabolism (Supplementary Table 4).
To detect proteins that were most likely to be associated with PaWB, we considered that the accumulated level of a protein in PF versus PFI would be opposite to its accumulated levels in the PFI versus PFI-15 and PFI-15 versus PFI-75 comparisons. Therefore, we selected proteins that were more abundant in PF versus PFI and less abundant in one or both of the PFI versus PFI-15 and PFI-15 versus PFI-75 comparisons, as well as the proteins that were less abundant in PF versus PFI and more abundant in one or both of the PFI versus PFI-15 and PFI-15 versus PFI-75 comparisons. Based on these criteria, we obtained 27 predicted PaWB-related proteins (three were differentially accumulated in all three comparisons and 24 were differentially accumulated in two of the comparisons) for the enrichment analysis (Supplementary Table 5).
The GO and KEGG pathway analyses of the 27 selected proteins revealed possible interactions between the phytoplasma and the PaWB-related proteins. The GO enrichment analysis (Supplementary Table 6) identified 12 terms that were significantly enriched (p value < 0.05) under biological process with “response to abiotic stimulus” accounting for the highest number of proteins (11). Under cellular component, 16 terms were significantly enriched with “thylakoid” accounting for the highest number of proteins (11), and under molecular function, only four terms were significantly enriched with “metal ion binding” and “cation binding” both accounting for the highest numbers of proteins (11). The KEGG pathway analysis mapped the 27 DAPs to 23 pathways, with metabolic pathways accounting for the highest numbers of proteins (Supplementary Table 7). To better understand the functions and interactions of the identified 27 PaWB-related DAPs, a protein-protein interaction network analysis was performed with the online analysis tool STRING1 (version 10, http://string-db.org). Because the protein annotations in the NCBI plant database are based on different organisms, the 27 proteins were searched against the Arabidopsis thaliana protein database to obtain annotated protein entries for the network analysis (Figure 4() and Supplementary Table 5). The results suggest that PB (gi|13236786, ATP synthase subunit beta), LHCB4.2 (gi|445116, chlorophyll a-b binding protein CP29.2), mMDH1 (gi|21388550, malate dehydrogenase 1), and RPBL16A (gi|1173055, 60S ribosomal protein L11-1) are the central points in the network and play essential roles in response to PaWB.
Figure 4.

Functional networks of the identified PaWB-related proteins. Different line colors represent the types of evidence used in predicting the associations: gene fusion (red), neighborhood (green), cooccurrence across genomes (blue), coexpression (black), experimental (purple), association in curated databases (light blue), text mining (yellow), and homology (light purple).
3.4. Expression Levels of Genes Encoding 14 Selected DAPs by qRT-PCR
To add supplementary information to the iTRAQ analysis, we examined the transcript expression levels of the genes encoding 14 randomly selected proteins by qRT-PCR (Figure 5). Among the four comparisons, only CL6122.Contig3_All displayed the same expression trend as the corresponding DAP in the iTRAQ data in PF versus PFI, PF versus PFI-75, and PFI-15 versus PFI-75, but not in PFI versus PFI-15. At the transcript expression levels, CL8897.Contig2_All, CL11278.Contig2_All, and CL9804.Contig2_All were consistent with the corresponding DAPs in the iTRAQ data in two of the four comparisons, whereas the expression levels of Unigene7925_All, Unigene31114_All, and Unigene34200_All showed opposite trends with the corresponding DAPs in the iTRAQ data. These results suggested that gene expression at the transcriptome level did not necessarily reflect the abundance of the encoded proteins encoded, likely because posttranscriptional processing and posttranslational modification are crucial processes in plants.
Figure 5.

Relative expression levels of the mRNA in P. fortunei by qRT-PCR. PF: healthy P. fortunei. Unigene7925_All: cytosolic NADP-malic enzyme; Unigene31114_All: ribulose-1, 5-bisphosphate carboxylase/oxygenase; CL8897.Contig2_All: germin-like protein; CL11278.Contig2_All: ATP synthase; Unigene336_All: anganese superoxide dismutase; CL9513.Contig1_All: chloroplast pigment-binding protein CP29; CL1290.Contig8_All: auxin-induced protein PCNT115-like; CL6627.Contig1_All: mitochondrial NAD-dependent malate dehydrogenase; CL11706.Contig4_All: peptidyl-prolyl cis-trans isomerase; Unigene2023_All: fasciclin-like arabinogalactan protein 10-like; CL9190.Contig2_All: chlorophyll a-b binding protein; CL6122.Contig3_All: ATP-dependent zinc metalloprotease FTSH 2; CL9804.Contig2_All: V-type proton ATPase subunit B2 OS = Arabidopsis thaliana; Unigene34200_All: UDP-glucose pyrophosphorylase. The 18S rRNA was acted as an internal reference gene for normalization. The normalized mRNA transcript levels were arbitrarily set to 1 in PF. Standard errors of the mean are represented by the error bars.
4. Discussion
Proteomics has been used in plants to help understand their response to stressful conditions. In this study, we identified 2969 proteins that will form a database for further studies. In addition, 104 DAPs were identified between healthy and infected seedlings. In other studies of phytoplasma-infected plants, such as lime [32], mulberry [4], tobacco [19], and grape [33], 990, 500, 1466, and 576 proteins, respectively, were identified and 448, 37, 330, and 33 DAPs were detected between healthy and infected plants. The differences in protein numbers arise mainly from the proteomic approaches used in each study. The results suggest that label-free (lime) shotgun proteomics may reveal more DAPs, whereas label-based (Paulownia and tobacco) proteomics may identify more proteins. The iTRAQ technology that we used in our study has been proven to be a powerful method to investigate proteomic changes, because many proteins can be identified simultaneously and proteomic changes can be measured with high sensitivity. In four previous studies [4, 19, 32, 33], we found that the Paulownia proteins that responded to phytoplasma infection mostly were related to photosynthesis, protein metabolism, signal transduction, and cell defense, and “photosynthesis” and “ribosome” were enriched pathway, “photosynthesis,” and “ribosome” were also enriched in this study, suggesting common responses of to phytoplasma infection. In our previous study [11], we also found that DMS treatment allowed the morphology of infected plants to recover and led to the elimination of the phytoplasmas in PaWB-infected plants. Although DMS could induce methylation of adenine [34], it did not change the DNA sequences at the simple sequence repeat level. We also found that oxytetracycline treatment is similar to DMS treatment, as both of these treatments could make the PaWB-infected Paulownia recover to a healthy morphology. It has been previously demonstrated that oxytetracycline treatment can influence the global DNA methylation level of PaWB-infected Paulownia [31], with possible effects on plant development and other processes [35]. In the light of these observations, the DMS treatment might influence the DNA methylation level in infected Paulownia, thereby influencing the processes which could regulate plant morphogenesis, finally resulting in morphological changes. In this study, we treated PFI seedlings with DMS and detected DMS-responsive DAPs. Many of these DAPs were photosynthetic proteins that were also considered to be phytoplasma responsive. If this is the effecter that causes the PaWB symptoms of infected seedlings to recover to normal, a future in-depth study is needed.
The DMS treatment helped us to identify 27 PaWB-related proteins that we classified into four groups: photosynthesis-related (LHCB4.2, LHCA1, CYP38, AT1G32470, PSBP-1, PSAF, PSBA, RBCL,VAR2 PB, VAB2, and FIB), energy-related (NADP-ME4, Mmdh1, TPI, MSD1, and CPN20), ribosome-related (RPL16A, AT5G09500, and AT5G60670), and individual proteins (UGP2 (gi|183397343, UDP-glucose pyrophosphorylase 2), AT1G75280 (gi|4731376, Isoflavone reductase-P3), AT4G39230 (gi|359475114, NmrA-like negative transcriptional regulator family protein), GER3 (gi|222051768, Germin 3), ATB2 (gi|356526627, Encodes ATB2), FLA10 (gi|224130034, FASCICLIN-like arabinogalactan-protein 10)). Phytoplasmas need to obtain metabolites from the host plants because they lack several metabolic enzymes involved in the pentose phosphate pathway and the F1F0-type ATP-synthase subunit [35, 36], and phytoplasmas secrete virulence factors to suppress the growth and development of host plants through the Sec protein translocation system [37–39]. Photosynthesis-, ribosome-, and energy-related proteins were already known to be associated with phytoplasmas infection [4, 19, 32, 33]; however, the relationship between the individual proteins and PaWB is yet to be established.
UDP-glucose pyrophosphorylase (UGP2, gi|183397343) catalyzes the reversible production of UDP-glucose and pyrophosphate from glucose-1-phosphate and UTP and is a key enzyme for carbohydrate metabolism. UGP2 is associated with the metabolism of glucose, which can be used by phytoplasmas as a source of energy [40], and may be involved in the Paulownia-phytoplasma interaction. ATB2 (gi|356526627, Encodes ATB2) is a NAD(P)-linked oxidoreductase superfamily protein, which has been identified as a salt-response protein [41].
Flavonoids are significant secondary metabolites that regulate auxin transport, seed germination, signaling pathways with symbiotic microorganisms, and resistance [42]. Flavonoids have been classified into six categories: flavones, flavonols, flavanones, isoflavones, flavanols, and anthocyanin [43]. Conserved enzymes in the biosynthesis pathway of flavonoids are mostly divided into three groups: ketoglutarate-dependent dioxygenases, including flavanone 3-hydroxylase, flavone synthase, and leucoanthocyanidin dioxygenase; NADPH-dependent reductases, including dihydroflavonol-4-reductase, leucoanthocyanidin reductase, and isoflavone reductase; and cytochrome P450 hydroxylases, including flavonoid 3′-hydroxylase, flavonoid 3′,5′-hydroxylase, and isoflavone synthase. AT1G75280 (IFR, gi|4731376) belongs to the NADPH-dependent reductase family. The At4g39230 gene encodes a protein sequence that is similar to phenylcoumaran benzylic ether reductase and has been found to influence the levels of flavonoids [44]. Therefore, the protein annotated as similar to AT4G39230 (gi|359475114, NmrA-like negative transcriptional regulator family protein) in our results may be related to flavonoid metabolism. Flavonoid metabolism and flavonoid biosynthesis genes are known to be activated as part of plant defense responses after infection [45]. The flavonoid metabolism-related proteins (AT1G75280 and AT4G39230) that we detected showed higher abundance in PFI compared with PF, implying they may be PaWB-responsive proteins.
Germin-like proteins (GLPs) are extracellular glucoproteins that belong to the pathogenesis-related protein family. Germin-like proteins act as enzymes (oxalate oxidase and SOD), receptors, and structural proteins in response to biotic and abiotic stresses and have been categorized into three subfamilies [46]. Germin 3 (gi|222051768, auxin-binding protein 19), which was detected among the DAPs in this study, belongs to subfamily 3, which contains regulatory proteins related to auxin metabolism [47]. Auxin-binding proteins (ABPs) serve as auxin receptors and are located in the membranes of endoplasmic reticulum, vacuole, and cytoplasm. Ohmiya et al. first isolated ABP19 from shoot apices in peach and found that it bound specifically with auxin [48]. Subsequently, ABP19 has been found on the cell wall of palisade parenchyma cells and in spongy parenchyma cells in leaves [49]. During auxin signal transduction, auxins combine with ABPs on the membrane and then activate G-proteins, which induce the intracellular signal transduction of auxin, finally causing a variety of physiological and biochemical responses in plants. In our study, ABP19 was found to be more abundant in the PF versus PFI and PF versus FPI-75 comparisons and less abundant in the PFI versus PFI-15 comparison. The higher accumulation of ABP19 in PFI compared with PF may be why PF released more ABP19 to not only enhance the efficiency of auxin signal transduction in response to the decrease of auxin but also to strengthen the cell wall to guard against phytoplasma attack.
In summary, we analyzed the physiological characteristics and determined the abundances of proteins using iTRAQ labeling coupled with LC-MS/MS in PF, PFI, PFI-15, and PFI-75 seedlings. We found that DMS was able to eliminate PaWB phytoplasmas in P. fortunei. In total, 2969 proteins were identified, and 104 phytoplasma infection-responsive and 32 DMS-responsive DAPs were found. In addition, 27 PaWB-related proteins were discovered, and their protein-protein interactions were analyzed. Our results provide new insights for further analyses of the molecular mechanisms of how PaWB phytoplasma influences phytohormones in P. fortunei.
Supplementary Material
The information of supplementary materials are as follows: Supplementary Figure 1 The repeatability of two replicates. A: PF vs. PFI, B: PFI vs. PFI-15, C: PFI-15 vs. PFI-75, D: PF vs. PFI-75. The ratios of protein abundances for each protein in each comparison between biological replicates were calculated, and the “delta, error” in the absciss are presents the difference from the expected ratio of 1. Supplementary Figure 2 Gene Ontology (GO) analysis of proteins identified in P. fortunei. (A) Cellular component of GO. (B) Molecular function of GO. (C) Biological process of GO. Supplementary Figure 3 Cluster of Orthologous Groups (COG) function classification of proteins identified in P. fortunei. Supplementary Table 1: All proteins identified by iTRAQ in P. fortunei. Supplementary Table 2: KEGG annotation of the DAPs in PF vs. PFI. Supplementary table 3: GO analyses of the DAPs in PF vs. PFI. Supplementary table 4: Annotations of the 32 DMS-responsive DAPs. Supplementary Table 5: Statistics of 27 predicted PaWB-related proteins in P. fortunei. Supplementary Table 6: TOP 10 GO function analysis of DAPs in P. fortunei. Supplementary Table 7: KEGG pathway analysis of DAPs in P. fortunei. Supplemental Protocol 1: The program of SCX chromatography. Supplemental Protocol 2: The program of LC-MS/MS analysis. Supplemental Protocol 3: The parameters of Proteome Discoverer software.
Acknowledgments
This work was supported financially by grants from the National Natural Science Foundation of China (Grant nos. 30271082, 30571496, and U1204309). The authors thank Margaret Biswas, PhD, from Liwen Bianji, Edanz Group China (https://nec.liwenbianji.cn/), for editing the English text of a draft of this manuscript.
Conflicts of Interest
The authors declare that they have no conflict of interest.
References
- 1.Hogenhout S. A., Oshima K., Ammar E. D., Kakizawa S., Kingdom H. N., Namba S. Phytoplasmas: bacteria that manipulate plants and insects. Molecular Plant Pathology. 2008;9(4):403–423. doi: 10.1111/j.1364-3703.2008.00472.x. [DOI] [PMC free article] [PubMed] [Google Scholar]
- 2.Bayliss K. L., Saqib M., Dell B., Jones M. G. K., Hardy G. E. S. J. First record of ‘Candidatus Phytoplasma australiense’ in Paulownia trees. Australasian Plant Pathology. 2005;34(1):123–124. doi: 10.1071/AP04089. [DOI] [Google Scholar]
- 3.Namba S. Molecular biological studies on phytoplasmas. Journal of General Plant Pathology. 2002;68(3):257–259. doi: 10.1111/aab.12151. [DOI] [Google Scholar]
- 4.Ji X. L., Gai Y. P., Zheng C. C., Mu Z. M. Comparative proteomic analysis provides new insights into mulberry dwarf responses in mulberry (Morus alba L.) Proteomics. 2009;9(23):5328–5339. doi: 10.1002/pmic.200900012. [DOI] [PubMed] [Google Scholar]
- 5.Gai Y. P., Han X. J., Yi-Qun L. I., et al. Metabolomic analysis reveals the potential metabolites and pathogenesis involved in mulberry yellow dwarf disease. Plant Cell & Environment. 2014;37(6):1474–1490. doi: 10.1111/pce.12255. [DOI] [PubMed] [Google Scholar]
- 6.Gai Y. P., Li Y. Q., Guo F. Y., et al. Analysis of phytoplasma-responsive sRNAs provide insight into the pathogenic mechanisms of mulberry yellow dwarf disease. Scientific Reports. 2014;4:p. 5378. doi: 10.1038/srep05378. [DOI] [PMC free article] [PubMed] [Google Scholar]
- 7.Yang C. Y., Huang Y. H., Lin C. P., et al. MicroRNA396-targeted SHORT VEGETATIVE PHASE is required to repress flowering and is related to the development of abnormal flower symptoms by the phyllody symptoms1 effector. Plant Physiology. 2015;168(4):1702–1716. doi: 10.1104/pp.15.00307. [DOI] [PMC free article] [PubMed] [Google Scholar]
- 8.Liu L. Y., Tseng H. I., Lin C. P., et al. High-throughput transcriptome analysis of the leafy flower transition of Catharanthus roseus induced by peanut witches’-broom phytoplasma infection. Plant & Cell Physiology. 2014;55(5):942–957. doi: 10.1093/pcp/pcu029. [DOI] [PubMed] [Google Scholar]
- 9.Ehya F., Monavarfeshani A., Mohseni F. E., et al. Phytoplasma-responsive microRNAs modulate hormonal, nutritional, and stress signalling pathways in Mexican lime trees. PLoS One. 2013;8(6, article e66372) doi: 10.1371/journal.pone.0066372. [DOI] [PMC free article] [PubMed] [Google Scholar]
- 10.Hren M., Nikolić P., Rotter A., et al. ‘Bois noir’ phytoplasma induces significant reprogramming of the leaf transcriptome in the field grown grapevine. BMC Genomics. 2009;10(10):p. 460. doi: 10.1186/1471-2164-10-460. [DOI] [PMC free article] [PubMed] [Google Scholar]
- 11.Zhao G., Zhao Z., Fan G., Cao X. Effects of dimethyl sulphonate on the morphological changes of Paulownia fortunei seedlings with witches’ broom and their DNA base sequences. Journal of Henan Agricultural University. 2011;45(3):287–291. [Google Scholar]
- 12.Cao X., Fan G., Deng M., Zhao Z., Dong Y. Identification of genes related to Paulownia witches’ broom by AFLP and MSAP. International Journal of Molecular Sciences. 2014;15(8):14669–14683. doi: 10.3390/ijms150814669. [DOI] [PMC free article] [PubMed] [Google Scholar]
- 13.Fan G., Dong Y., Deng M., Zhao Z., Niu S., Xu E. Plant-pathogen interaction, circadian rhythm, and hormone-related gene expression provide indicators of phytoplasma infection in Paulownia fortunei. International Journal of Molecular Sciences. 2014;15(12):23141–23162. doi: 10.3390/ijms151223141. [DOI] [PMC free article] [PubMed] [Google Scholar]
- 14.Fan G., Peng H., Zhai X., Ma X., Jiang J. Protein polymorphism of Paulownia leaves and its cluster analysis. Chinese Bulletin of Botany. 2001;12(6):739–743. [Google Scholar]
- 15.Fan G., Cao X., Niu S., Deng M., Zhao Z., Dong Y. Transcriptome, microRNA, and degradome analyses of the gene expression of Paulownia with phytoplamsa. BMC Genomics. 2015;16(1):1–15. doi: 10.1186/s12864-015-2074-3. [DOI] [PMC free article] [PubMed] [Google Scholar]
- 16.Mou H., Lu J., Zhu S., et al. Transcriptomic analysis of Paulownia infected by Paulownia witches’-broom phytoplasma. PLoS One. 2013;8(10, article e77217) doi: 10.1371/journal.pone.0077217. [DOI] [PMC free article] [PubMed] [Google Scholar]
- 17.Niu S., Fan G., Deng M., Zhao Z., Xu E., Cao L. Discovery of microRNAs and transcript targets related to witches’ broom disease in Paulownia fortunei by high-throughput sequencing and degradome approach. Molecular & General Genetics. 2016;291:181–191. doi: 10.1007/s00438-015-1102-y. [DOI] [PubMed] [Google Scholar]
- 18.Fan G., Xu E., Deng M., Zhao Z., Niu S. Phenylpropanoid metabolism, hormone biosynthesis and signal transduction-related genes play crucial roles in the resistance of Paulownia fortunei to Paulownia witches’ broom phytoplasma infection. Genes & Genomics. 2015;37(11):913–929. doi: 10.1007/s13258-015-0321-2. [DOI] [Google Scholar]
- 19.Luge T., Kube M., Freiwald A., Meierhofer D., Seemuller E., Sauer S. Transcriptomics assisted proteomic analysis of Nicotiana occidentalis infected by Candidatus Phytoplasma mali strain AT. Proteomics. 2014;14(16):1882–1889. doi: 10.1002/pmic.201300551. [DOI] [PubMed] [Google Scholar]
- 20.Mertins P., Udeshi N. D., Clauser K. R., et al. iTRAQ labeling is superior to mTRAQ for quantitative global proteomics and phosphoproteomics. Molecular & Cellular Proteomics. 2011;11(6):1377–1391. doi: 10.1074/mcp.M111.014423. [DOI] [PMC free article] [PubMed] [Google Scholar]
- 21.Shi H., Wang X., Tan D. X., Reiter R. J., Chan Z. Comparative physiological and proteomic analyses reveal the actions of melatonin in the reduction of oxidative stress in Bermuda grass (Cynodon dactylon (L). Pers.) Journal of Pineal Research. 2015;59(1):120–131. doi: 10.1111/jpi.12246. [DOI] [PubMed] [Google Scholar]
- 22.Trevisan S., Manoli A., Ravazzolo L., et al. Nitrate sensing by the maize root apex transition zone: a merged transcriptomic and proteomic survey. Journal of Experimental Botany. 2015;66(13):p. 17. doi: 10.1093/jxb/erv165. [DOI] [PMC free article] [PubMed] [Google Scholar]
- 23.Wu J., Xu Z., Zhang Y., Chai L., Yi H., Deng X. An integrative analysis of the transcriptome and proteome of the pulp of a spontaneous late-ripening sweet orange mutant and its wild type improves our understanding of fruit ripening in citrus. Journal of Experimental Botany. 2014;65(6):1651–1671. doi: 10.1093/jxb/eru044. [DOI] [PMC free article] [PubMed] [Google Scholar]
- 24.Fan G., Feng Z., Zhai X., Cao Y., Dong Z., Jiang J. Effects of plant growth regulators on morphological and content changes of proteins of witches’ broom of Paulownia seedlings. Journal of Henan Agricultural University. 2006;40(2):137–141. [Google Scholar]
- 25.Tang Z., Du W., Du X. L., Ban Y. Y., Cheng J. L. iTRAQ protein profiling of adventitious root formation in mulberry hardwood cuttings. Journal of Plant Growth Regulation. 2016;35(3):618–631. doi: 10.1007/s00344-015-9567-9. [DOI] [Google Scholar]
- 26.Bradford M. M. A rapid and sensitive method for the quantitation of microgram quantities of protein utilizing the principle of protein-dye binding. Analytical Biochemistry. 1976;72:248–254. doi: 10.1016/0003-2697(76)90527-3. [DOI] [PubMed] [Google Scholar]
- 27.Meng Q., Hou L., Zhao Y., et al. iTRAQ-based proteomic study of the effects of Spiroplasma eriocheiris on Chinese mitten crab Eriocheir sinensis hemocytes. Fish & Shellfish Immunology. 2014;40(1):182–189. doi: 10.1016/j.fsi.2014.06.029. [DOI] [PubMed] [Google Scholar]
- 28.Dong Y., Deng M., Zhao Z., Fan G. Quantitative proteomic and transcriptomic study on autotetraploid Paulownia and its diploid parent reveal key metabolic processes associated with Paulownia autotetraploidization. Frontiers in Plant Science. 2016;7 doi: 10.3389/fpls.2016.00892. [DOI] [PMC free article] [PubMed] [Google Scholar]
- 29.Qiao J., Wang J., Chen L., et al. Quantitative iTRAQ LC-MS/MS proteomics reveals metabolic responses to biofuel ethanol in cyanobacterial Synechocystis sp. PCC 6803. Journal of Proteome Research. 2012;11(11):5286–5300. doi: 10.1021/pr300504w. [DOI] [PubMed] [Google Scholar]
- 30.Lee I. M., Hammond R. W., Davis R. E., Gundersen D. E. Universal amplification and analysis of pathogen 16S rDNA for classification and identification of mycoplasmalike organisms. Phytopathology. 1993;83(8):834–842. [Google Scholar]
- 31.Li M., Zhai X., Fan G., Zhang B., Liu F. Effect of oxytetracycline on the morphology of seedling with witches’ broom and DNA methylation level of Paulownia tomentosa × P. fortunei. Scientia Silvae Sinicae. 2008;9(44):152–156. [Google Scholar]
- 32.Monavarfeshani A., Mirzaei M., Sarhadi E., et al. Shotgun proteomic analysis of the Mexican lime tree infected with “CandidatusPhytoplasma aurantifolia”. Journal of Proteome Research. 2013;12(2):785–795. doi: 10.1021/pr300865t. [DOI] [PubMed] [Google Scholar]
- 33.Margaria P., Palmano S. Response of the Vitis vinifera L. cv. ‘Nebbiolo’ proteome to Flavescence doree phytoplasma infection. Proteomics. 2011;11(2):212–224. doi: 10.1002/pmic.201000409. [DOI] [PubMed] [Google Scholar]
- 34.Streitwieser A., Heathcock C. H., Kosower E. M., Corfield P. J. Introduction to Organic Chemistry. New York, NY, USA: Macmillan; 1992. [Google Scholar]
- 35.Kube M., Schneider B., Kuhl H., et al. The linear chromosome of the plant-pathogenic mycoplasma ‘Candidatus Phytoplasma mali’. BMC Genomics. 2008;9(1):1–14. doi: 10.1186/1471-2164-9-306. [DOI] [PMC free article] [PubMed] [Google Scholar]
- 36.Oshima K., Kakizawa S., Arashida R., et al. Presence of two glycolytic gene clusters in a severe pathogenic line of Candidatus Phytoplasma asteris. Molecular Plant Pathology. 2007;8(4):481–489. doi: 10.1111/j.1364-3703.2007.00408.x. [DOI] [PubMed] [Google Scholar]
- 37.Maclean A. M., Sugio A., Makarova O. V., et al. Phytoplasma effector SAP54 induces indeterminate leaf-like flower development in Arabidopsis plants. Plant Physiology. 2011;157(2):831–841. doi: 10.1104/pp.111.181586. [DOI] [PMC free article] [PubMed] [Google Scholar]
- 38.Musetti R., Farhan K., Marco F. D., et al. Differentially-regulated defence genes in Malus domestica during phytoplasma infection and recovery. European Journal of Plant Pathology. 2013;136(1):13–19. doi: 10.1007/s10658-012-0147-6. [DOI] [Google Scholar]
- 39.Shpigelman A., Paz Y., Ramon O., Livney Y. D. Phytoplasma protein effector SAP11 enhances insect vector reproduction by manipulating plant development and defense hormone biosynthesis. Proceedings of the National Academy of Sciences of the United States of America. 2011;108(48):E1254–E1263. doi: 10.1073/pnas.1105664108. [DOI] [PMC free article] [PubMed] [Google Scholar]
- 40.Oshima K., Kakizawa S., Nishigawa H., et al. Reductive evolution suggested from the complete genome sequence of a plant-pathogenic phytoplasma. Nature Genetics. 2004;36(1):27–29. doi: 10.1038/ng1277. [DOI] [PubMed] [Google Scholar]
- 41.Fares A., Rossignol M., Peltier J. B. Proteomics investigation of endogenous S-nitrosylation in Arabidopsis. Biochemical and Biophysical Research Communications. 2011;416(3-4):331–336. doi: 10.1016/j.bbrc.2011.11.036. [DOI] [PubMed] [Google Scholar]
- 42.Xu W., Dubos C., Lepiniec L. Transcriptional control of flavonoid biosynthesis by MYB–bHLH–WDR complexes. Trends in Plant Science. 2015;20(3):176–185. doi: 10.1016/j.tplants.2014.12.001. [DOI] [PubMed] [Google Scholar]
- 43.Rive-Evans C. A., Miller N. J. Structure-antioxidant activity relationships of flavonoids and isoflavonoids. ChemInform. 1998;29:199–219. [Google Scholar]
- 44.Nuoendagula, Kamimura N., Mori T., et al. Expression and functional analyses of a putative phenylcoumaran benzylic ether reductase in Arabidopsis thaliana. Plant Cell Reports. 2016;35(3):513–526. doi: 10.1007/s00299-015-1899-1. [DOI] [PubMed] [Google Scholar]
- 45.Koskimaki J. J., Hokkanen J., Jaakola L., et al. Flavonoid biosynthesis and degradation play a role in early defence responses of bilberry (Vaccinium myrtillus) against biotic stress. European Journal of Plant Pathology. 2009;125(4):629–640. doi: 10.1007/s10658-009-9511-6. [DOI] [Google Scholar]
- 46.Khuri S., Bakker F. T., Dunwell J. M. Phylogeny, function, and evolution of the cupins, a structurally conserved, functionally diverse superfamily of proteins. Molecular Biology and Evolution. 2001;18(4):593–605. doi: 10.1093/oxfordjournals.molbev.a003840. [DOI] [PubMed] [Google Scholar]
- 47.Kosová K., Vítámvás P., Planchon S., Renaut J., Vanková R., Prášil I. T. Proteome analysis of cold response in spring and winter wheat (Triticum aestivum) crowns reveals similarities in stress adaptation and differences in regulatory processes between the growth habits. Journal of Proteome Research. 2013;12(11):4830–4845. doi: 10.1021/pr400600g. [DOI] [PubMed] [Google Scholar]
- 48.Ohmiya A., Kikuchi M., Sakai S., Hayashi T. Purification and properties of an auxin-binding protein from the shoot apex of peach tree. Plant & Cell Physiology. 1993;34(2):177–183. doi: 10.1093/oxfordjournals.pcp.a078405. [DOI] [Google Scholar]
- 49.Ohmiya A., Tanaka Y., Kadowaki K., Hayashi T. Cloning of genes encoding auxin-binding proteins (ABP19/20) from peach: significant peptide sequence similarity with germin-like proteins. Plant & Cell Physiology. 1998;39(5):492–499. doi: 10.1093/oxfordjournals.pcp.a029396. [DOI] [PubMed] [Google Scholar]
Associated Data
This section collects any data citations, data availability statements, or supplementary materials included in this article.
Supplementary Materials
The information of supplementary materials are as follows: Supplementary Figure 1 The repeatability of two replicates. A: PF vs. PFI, B: PFI vs. PFI-15, C: PFI-15 vs. PFI-75, D: PF vs. PFI-75. The ratios of protein abundances for each protein in each comparison between biological replicates were calculated, and the “delta, error” in the absciss are presents the difference from the expected ratio of 1. Supplementary Figure 2 Gene Ontology (GO) analysis of proteins identified in P. fortunei. (A) Cellular component of GO. (B) Molecular function of GO. (C) Biological process of GO. Supplementary Figure 3 Cluster of Orthologous Groups (COG) function classification of proteins identified in P. fortunei. Supplementary Table 1: All proteins identified by iTRAQ in P. fortunei. Supplementary Table 2: KEGG annotation of the DAPs in PF vs. PFI. Supplementary table 3: GO analyses of the DAPs in PF vs. PFI. Supplementary table 4: Annotations of the 32 DMS-responsive DAPs. Supplementary Table 5: Statistics of 27 predicted PaWB-related proteins in P. fortunei. Supplementary Table 6: TOP 10 GO function analysis of DAPs in P. fortunei. Supplementary Table 7: KEGG pathway analysis of DAPs in P. fortunei. Supplemental Protocol 1: The program of SCX chromatography. Supplemental Protocol 2: The program of LC-MS/MS analysis. Supplemental Protocol 3: The parameters of Proteome Discoverer software.