

Abstract
The aim of the present study was to identify the biomarkers involved in the development of hepatocellular adenoma (HCA) through integrated analysis of gene expression and methylation microarray. The microarray dataset GSE7473, containing HNF1α-mutated HCA and their corresponding non-tumor livers, 5 HNF1α-mutated HCA and 4 non-related non-tumor livers, was downloaded from the Gene Expression Omnibus (GEO) database. The DNA methylation profile GSE43091, consisting of 50 HCA and 4 normal liver tissues, was also downloaded from the GEO database. Differentially expressed genes (DEGs) were identified by the limma package of R. A t-test was conducted on the differentially methylated sites. Functional enrichment analysis of DEGs was performed through the Database for Annotation, Visualization and Integrated Analysis. The genes corresponding to the differentially methylated sites were obtained by the annotation files of methylation chip platform. A total of 182 DEGs and 3,902 differentially methylated sites were identified in HCA. In addition, 238 enriched GO terms, including organic acid metabolic process and carboxylic acid metabolic process, and 14 KEGG pathways, including chemical carcinogenesis, were identified. Furthermore, 12 DEGs were identified to contain differentially methylated sites, among which, 8 overlapped genes, including pregnancy zone protein and solute carrier family 22 member 1 (SLC22A1), exhibited inverse associations between gene expression levels and DNA methylation levels. The DNA methylation levels may be potential targets of HCA. The present study revealed that the 8 overlapped genes, including annexin A2, chitinase 3-like 1, fibroblast growth factor receptor 4, mal, T-cell differentiation protein like, palladin, cytoskeletal associated protein, plasmalemma vesicle associated protein and SLC22A1, may be potential therapeutic targets of HCA.
Keywords: hepatocellular adenoma, differentially expressed genes, differentially methylated sites, DAVID
Introduction
Hepatocellular adenoma (HCA) is a benign liver tumor that occurs mainly in young females subsequent to the long-term use of oral contraceptives (1,2). It is a type of rare tumor with low morbidity (3). However, HCA may lead to hemorrhage, and even malignant transformation to hepatocellular carcinoma (HCC), which is the third leading cause of cancer-associated mortality worldwide (4–8). A rising incidence has been reported due to improved application of diagnostic imaging techniques (9). HCA is rare in children, men and post-menopausal women. The use of androgenic steroids for Fanconi's anemia or acquired aplastic anemia is a risk factor for the development of HCA (10). Other drugs are involved in its development, such as clomiphene, barbiturates and recombinant human growth hormone (11–13). Obesity and alcohol abuse have also been reported as risk factors for developing HCA (14).
Previously, ultrasound and magnetic resonance imaging (MRI) have been suggested as effective tools for the diagnosis of HCA and explore its biological mechanisms (15). According to the different genetic mutations, HCA is divided into 4 major molecular subgroups: Hepatocellular nuclear factor-1α (HNF1α)-mutated type HCA; β-catenin-mutated type HCA; inflammatory type HCA; and unclassified type HCA (8,14,16). The transcription factor 1 (TCF1) gene, which encodes HNF1α, has been identified in the liver (16). Overexpression of certain genes, including erb-b2 receptor tyrosine kinase 2, mechanistic target of rapamycin, platelet-derived growth factor α polypeptide, platelet-derived growth factor β polypeptide and cyclin D1, has been identified in HCA, and the products of these genes are associated with cell proliferation, cell cycle activation and angiogenesis (17).
In the human genome, GC-rich DNA sequences, also known as CpG islands, are frequently enriched in the first exon and the promoter (18). DNA methylation at CpG islands located upstream of a gene promoter is associated with differential expression of the gene. DNA methylation regulates gene silencing by directly inhibiting the binding of methylation-dependent transcriptional activators or indirectly altering the affinity of proteins, including methylated DNA binding domain protein, involved in chromatin remodeling (19–23). At present, DNA methylation is widely identified in human cancer, including HCC. It was reported that long interspersed nuclear element-1 (LINE-1) has lower DNA methylation levels in hepatitis virus and aflatoxin-associated HCC compared with normal liver tissue (24,25). In addition, hypomethylation of LINE-1 was associated with advanced disease and poorer survival in HCC (26). The DNA methylation level of spermidine/spermine N1-acetyltransferase family member 2 (SAT2) also has a significant role in liver carcinogenesis. It has been suggested that decreased SAT2 methylation of white blood cell DNA was significantly associated with increased HCC risk later in life (27).
It is challenging to diagnose HCC and HCA at an early stage. Numerous therapies are limited when HCC enters the advanced stage, as the advanced stage is accompanied by severe liver dysfunction (28). Therefore, it is necessary to identify early biomarkers of HCA. In the present study, data of the DNA methylation profile and gene expression profile was extracted from the Gene Expression Omnibus (GEO) database. Certain therapeutic targets and the related pathways that may be associated with the development of HCA were identified by microarray analysis. This may contribute to promoting available biomarkers for the early diagnosis, therapy and prognosis of HCA.
Materials and methods
Microarray data
The gene expression profile and DNA methylation profile were both downloaded from the GEO (http://www.ncbi.nlm.nih.gov/geo/) database. The gene expression profile (GSE7473) contained 41 samples, including 8 HNF1α-mutated HCA and the corresponding non-tumor liver samples (each sample was assessed four times using 11K_VJF-ARRAY; GPL3282), and 5 HNF1α-mutated HCA and 4 non-related non-tumor liver samples (the 9 samples were assessed using GPL96 Affymetrix Human Genome U133A Array). In the present study, the 9 samples that were assessed via GPL96 were used as the objects, and the 5 HNF1α-mutated HCA and 4 non-related non-tumor liver samples were classified as the case and control groups, respectively. The DNA methylation profile (GSE43091), provided by Pilati et al (29), contained 50 HCA and 4 normal liver tissues. These 54 samples were achieved by GPL13534 Illumina HumanMethylation450 BeadChip (HumanMethylation450_15017482).
Data preprocessing
The raw microarray data were converted into expression data using the affy package of R. The values of multiple probes that correspond to the same gene were summarized. For original DNA methylation data, the β value of every methylated site was calculated and normalized using the IMA package of R.
Identification of differentially methylated sites and differentially expressed genes (DEGs)
DEGs were identified using the limma package of R with P<0.05 and |log2 (fold-change)|>1. A paired Student's t-test was conducted on the methylation levels between HCA samples and normal samples, and the differentially methylated sites with adjusted P<0.05 and |Δβ|>0.2 were selected.
Functional enrichment analysis of DEGs
Gene Ontology (GO) and Kyoto Encyclopedia of Genes and Genomes (KEGG) pathway analysis of DEGs was performed using the Database for Annotation, Visualization and Integrated Discovery (DAVID). DAVID was used to perform functional annotation for a list of genes, gene functional classification or gene ID conversion. All GO terms and KEGG pathways with P<0.05 that contained at least five genes were selected for subsequent analysis.
Comprehensive analysis of gene expression profile and DNA methylation profile
The genes in which differentially methylated sites were located were identified using the annotation files of the methylation chip platform.
Results
Differentially methylated sites and differentially expressed genes
In total, 182 DEGs (53 upregulated and 129 downregulated) were identified in HCA. The volcano plot (Fig. 1) showed the distribution of DEGs. From the heatmap (Fig. 2), the case samples were found to be distinguished from the control samples. Additionally, a total of 3,902 differentially methylated sites were obtained, including 3,715 downregulated methylated sites and 187 upregulated methylated sites. These methylated sites were mostly located in the intergenic and gene-coding regions of genes (Fig. 3).
Figure 1.
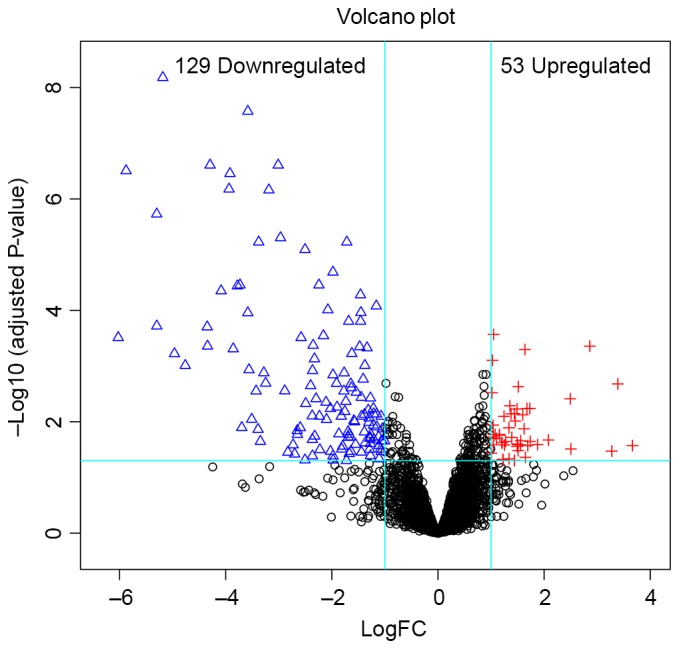
A volcano plot of differentially expressed genes. The red plus signs represent upregulated differentially expressed genes, the blue triangles represent downregulated differentially expressed genes, and the black circles represent non-differentially expressed genes. FC, fold-change
Figure 2.
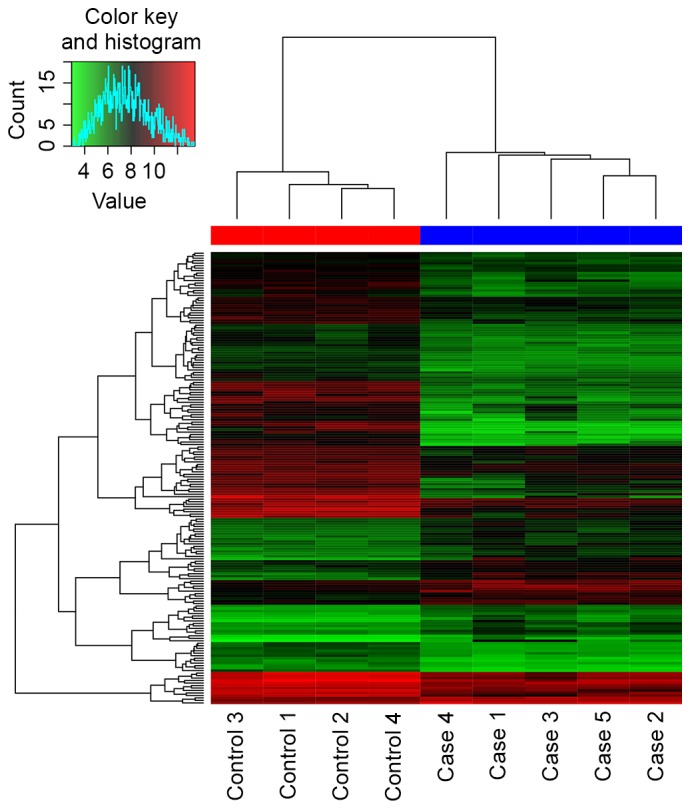
Two-way clustering analysis for metastasis in 5 hepatocellular nuclear factor-1α-mutated hepatocellular adenoma and 4 non-related non-tumor livers. Expression level was normalized per gene, and the relative value to the median among nine samples is shown by color. Red and black-red indicate high expression, and green represents relatively low expression.
Figure 3.
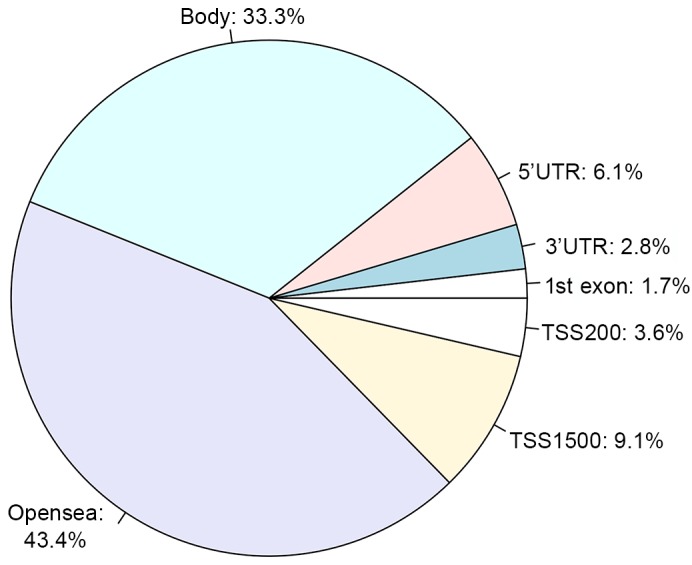
Location distribution of differentially methylated sites in genes. Opensea indicates the intergenic region; body indicates the gene coding region; 5′UTR indicates the 5′UTR region; 3′UTR indicates the 3′UTR region; 1st exon indicates the first expressed region; TSS200 indicates the 200 bp upstream of the transcription start site; and TSS1500 indicates the 1,500 bp upstream of the transcription start site. UTR, untranslated region.
Enriched GO terms and KEGG pathways
In the present study, a total of 238 enriched GO terms and 14 KEGG pathways were identified according to the criteria P<0.05. The top 20 enriched GO terms are listed in Table I. The majority of the enriched GO terms were involved in the organic acid metabolic process. The enriched KEGG pathways of the DEGs are shown in Table II. Certain KEGG pathways, for example the chemical carcinogenesis pathway, mineral absorption pathway and Bile secretion, were directly associated with HCA, and they may affect the development of HCA.
Table I.
Top 20 enriched GO terms for differentially expressed genes.
| Category | GO ID | GO name | Gene number | P-value |
|---|---|---|---|---|
| BP | GO:0006082 | Organic acid metabolic process | 54 | 1.89×10⁻²³ |
| BP | GO:0019752 | Carboxylic acid metabolic process | 51 | 2.08×10⁻²³ |
| BP | GO:0043436 | Oxoacid metabolic process | 51 | 2.88×10⁻²¹ |
| BP | GO:0032787 | Monocarboxylic acid metabolic process | 36 | 3.97×10⁻²⁰ |
| BP | GO:0042493 | Response to drug | 26 | 4.53×10⁻¹⁴ |
| BP | GO:0006805 | Xenobiotic metabolic process | 17 | 2.54×10⁻¹³ |
| BP | GO:0071466 | Cellular response to xenobiotic stimulus | 17 | 2.82×10⁻¹³ |
| BP | GO:0010038 | Response to metal ion | 21 | 3.60×10⁻¹³ |
| BP | GO:0009410 | Response to xenobiotic stimulus | 17 | 5.16×10⁻¹³ |
| BP | GO:0055114 | Oxidation-reduction process | 38 | 1.05×10⁻¹² |
| BP | GO:0010035 | Response to inorganic substance | 24 | 1.90×10⁻¹² |
| MF | GO:0016491 | Oxidoreductase activity | 31 | 2.60×10⁻¹² |
| BP | GO:0006629 | Lipid metabolic process | 40 | 1.54×10⁻¹¹ |
| MF | GO:0004497 | Monooxygenase activity | 13 | 2.02×10⁻¹¹ |
| BP | GO:0071294 | Cellular response to zinc ion | 7 | 4.12×10⁻¹¹ |
| CC | GO:0005615 | Extracellular space | 39 | 4.44×10⁻¹¹ |
| BP | GO:0044282 | Small molecule catabolic process | 19 | 4.76×10⁻¹¹ |
| BP | GO:0008202 | Steroid metabolic process | 19 | 1.20×10⁻¹⁰ |
| BP | GO:0071248 | Cellular response to metal ion | 12 | 2.21×10⁻¹⁰ |
| MF | GO:0020037 | Heme binding | 13 | 4.63×10⁻¹⁰ |
GO, Gene Ontology; CC, cellular component; MF, molecular function; BP, biological process.
Table II.
Enriched KEGG pathways for differentially expressed genes.
| KEGG pathway name | Gene number | P-value |
|---|---|---|
| Chemical carcinogenesis | 11 | 7.14×10−09 |
| Mineral absorption | 9 | 1.84×10−08 |
| Bile secretion | 10 | 3.21×10−08 |
| Tryptophan metabolism | 8 | 4.18×10−08 |
| Linoleic acid metabolism | 7 | 7.54×10−08 |
| Retinol metabolism | 9 | 1.44×10−07 |
| Drug metabolism-cytochrome P450 | 9 | 2.47×10−07 |
| Arginine and proline metabolism | 8 | 7.43×10−07 |
| Steroid hormone biosynthesis | 8 | 7.43×10−07 |
| Metabolism of xenobiotics by | ||
| cytochrome P450 | 8 | 5.61×10−06 |
| Serotonergic synapse | 8 | 1.31×10−04 |
| Arachidonic acid metabolism | 6 | 1.94×10−04 |
| Carbon metabolism | 6 | 1.44×10−03 |
| Glycolysis/gluconeogenesis | 5 | 1.78×10−03 |
KEGG, Kyoto Encyclopedia of Genes and Genomes.
Key genes in hepatocellular adenoma
In total, 12 DEGs that contained differentially methylated sites were identified in the case groups compared with the control groups (Fig. 4). Among the DEGs, 8 genes with inverse associations between gene expression level and DNA methylation level were identified, consisting of annexin A2 (ANXA2), chitinase 3-like 1 (CHI3L1), fibroblast growth factor receptor 4 (FGFR4), mal, T-cell differentiation protein like (MALL), palladin, cytoskeletal associated protein (PALLD), plasmalemma vesicle associated protein (PLVAP), pregnancy zone protein (PZP) and solute carrier family 22 member 1 (SLC22A1).
Figure 4.
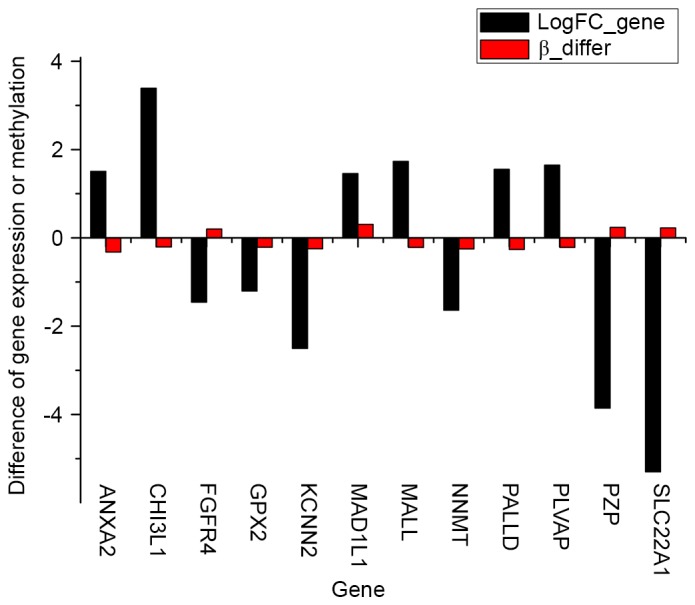
In total, 12 genes were differentially expressed and methylated in the case groups compared with the control groups. LogFC_Gene, fold-change in gene differential expression; Beta_differ, fold-change in gene methylation level; ANXA2, annexin A2; CHI3L1, chitinase 3-like 1; FGFR4, fibroblast growth factor receptor 4; MALL, mal, T-cell differentiation protein like; PALLD, palladin, cytoskeletal associated protein; PLVAP, plasmalemma vesicle associated protein; PZP, pregnancy zone protein; SLC22A1, solute carrier family 22 member 1.
Discussion
The development of human cancers is associated with two factors: Gradual accumulation and mutual interactions of genetic and epigenetic alterations (30). As one of the major characteristics in human cancers, epigenetic alterations may suggest the molecular mechanisms underlying malignant transformation (30–33). DNA methylation is one of these epigenetic mechanisms, and is widely found in human cancers, including HCA. At present, studies have reported that a family of DNA methyltransferase enzymes (DNMTs) mediates DNA methylation. DNMT1 was found to maintain methylation, whereas DNMT3A and DNMT3B induced de novo methylation (34). Promoter hypermethylation was associated with gene expression and resulted in transcriptional inhibition and loss of gene function. Certain studies have revealed that dysregulation of the removal and establishment of DNA methylation was involved in hepatocarcinogenesis (35,36). In HCC, hypermethylation mainly affects the expression of certain tumor suppressor genes, particularly the genes involving in cell differentiation, cell proliferation, cell adhesion, cellular metabolism, and DNA repair. Hypermethylated genes, including adenomatosis polyposis coli, Ras association domain family member 1 and suppressor of cytokine signaling 1, have been identified in chronic hepatitis and cirrhosis (20,37–40). Also, genes such as glutathione S-transferase pi 1, cyclin dependent kinase inhibitor 2A, cytochrome c oxidase subunit II, HIC ZBTB transcriptional repressor 1, and runt related transcription factor 3, which were frequently methylated, have been identified in dysplastic liver nodules (20,41–43).
Previously, the emergence of new diagnostic methods such as ultrasound, and novel treatment methods such as liver-directed therapy, has improved the prognosis of HCA (44,45). However, a limit remains in terms of its early diagnosis and curative potential. The present study used microarray technology to identify key factors, such as the genes, biological process and signal pathways, involved in HCA.
In the present study, DNA expression and methylation profiles were obtained by bioinformatics to identify the differentially methylated sites and DEGs in HCA compared with normal liver tissues. A total of 182 DEGs (53 upregulated and 129 downregulated) and 3,902 differentially methylated sites (187 upregulated and 3,715 downregulated) were identified. In addition, 8 overlapped genes with inverse correlations between methylation levels and gene expression levels were identified, including PZP and SLC22A1.
Important genes may be potential targets for HCA diagnosis or treatment. PZP is a major pregnancy-associated plasma protein that is strongly associated with α 2-macroglobulin (46). PZP is considered an auxiliary index for the identification of gynecological tumors. Berne (47) revealed that estrogen induced PZP expression, and PZP was found in the serum of women who usually took oral contraceptives containing estrogen. As the long-term use of oral contraceptives may lead to HCA, this indicates that PZP may be a major gene in HCA. Polyspecific organic cation transporters are involved in the uptake of positively charged and neutral small molecules, certain drugs and environmental toxins into organs including the liver, kidney and intestine (48). In 1967, the human organic cation transporter 1, which is encoded by SLC22A1, was first reported to remove >70% of the serotonin in the portal blood via filtration and metabolism in the liver (49). Solute carrier family 22 (organic cation transporter), member 1 is the major active influx protein responsible for the transport of imatinib mesylate into cells (50). The present study hypothesized that SLC22A1 may play a critical role in removing endogenous substances, drugs and other toxins associated with HCA.
According to the functional enrichment of DEG analysis, certain GO terms associated with metabolic process and response to drugs were identified, and the KEGG pathways closely associated with chemical carcinogenesis and mineral absorption were obtained. Chemical carcinogenesis has become synonymous with genotoxic events, which lead to DNA damage and genetic mutations (51). In addition, epigenetic effects, such as aberrant DNA methylation, have been identified as one of the key contributors to carcinogenesis. Aberrant DNA methylation has been widely studied in carcinogenesis (19,52,53). Although certain animal models, which reflect the association between exposure to chemical carcinogens and epigenetic effects, have been established, the specific mechanism of this process has yet to be clarified (54).
Overall, using bioinformatics analysis, DEGs, differentially methylated sites, significant GO terms and KEGG pathways were obtained. It was found that DEGs were mainly involved in acid metabolic processing and chemical carcinogenesis in HCA. Based on comprehensive bioinformatics analysis, 8 important DEGs, consisting of SLC22A1, PZP, ANXA2, CHI3L1, FGFR4, MALL, PALLD and PLVAP, were identified. These DEGs, which are related to HCA, may potentially act as biomarkers for detection, prognosis, monitoring and predicting therapeutic responses in HCA. However, additional experiments are required to confirm their function in HCA.
References
- 1.Nault JC, Bioulac-Sage P, Zucman-Rossi J. Hepatocellular benign tumors-from molecular classification to personalized clinical care. Gastroenterology. 2013;144:888–902. doi: 10.1053/j.gastro.2013.02.032. [DOI] [PubMed] [Google Scholar]
- 2.Bioulac-Sage P, Balabaud C, Zucman-Rossi J. Focal nodular hyperplasia, hepatocellular adenomas: Past, present, future. Gastroenterol Clin Biol. 2010;34:355–358. doi: 10.1016/j.gcb.2010.03.014. [DOI] [PubMed] [Google Scholar]
- 3.van Aalten SM, Witjes CD, de Man RA, Ijzermans JN, Terkivatan T. Can a decision-making model be justified in the management of hepatocellular adenoma? Liver Int. 2012;32:28–37. doi: 10.1111/j.1478-3231.2011.02667.x. [DOI] [PubMed] [Google Scholar]
- 4.Choi BY, Nguyen MH. The diagnosis and management of benign hepatic tumors. J Clin Gastroenterol. 2005;39:401–412. doi: 10.1097/01.mcg.0000159226.63037.a2. [DOI] [PubMed] [Google Scholar]
- 5.Buell JF, Tranchart H, Cannon R, Dagher I. Management of benign hepatic tumors. Surg Clin North Am. 2010;90:719–735. doi: 10.1016/j.suc.2010.04.006. [DOI] [PubMed] [Google Scholar]
- 6.Bioulac-Sage P, Laumonier H, Couchy G, Le Bail B, Sa Cunha A, Rullier A, Laurent C, Blanc JF, Cubel G, Trillaud H, et al. Hepatocellular adenoma management and phenotypic classification: The Bordeaux experience. Hepatology. 2009;50:481–489. doi: 10.1002/hep.22995. [DOI] [PubMed] [Google Scholar]
- 7.Micchelli ST, Vivekanandan P, Boitnott JK, Pawlik TM, Choti MA, Torbenson M. Malignant transformation of hepatic adenomas. Mod Pathol. 2008;21:491–497. doi: 10.1038/modpathol.2008.8. [DOI] [PubMed] [Google Scholar]
- 8.Zucman-Rossi J, Jeannot E, Nhieu JT, Scoazec JY, Guettier C, Rebouissou S, Bacq Y, Leteurtre E, Paradis V, Michalak S, et al. Genotype-phenotype correlation in hepatocellular adenoma: New classification and relationship with HCC. Hepatology. 2006;43:515–524. doi: 10.1002/hep.21068. [DOI] [PubMed] [Google Scholar]
- 9.Shanbhogue A, Shah SN, Zaheer A, Prasad SR, Takahashi N, Vikram R. Hepatocellular adenomas: Current update on genetics, taxonomy, and management. J Comput Assist Tomogr. 2011;35:159–166. doi: 10.1097/RCT.0b013e31820bad61. [DOI] [PubMed] [Google Scholar]
- 10.Velazquez I, Alter BP. Androgens and liver tumors: Fanconi's anemia and non-Fanconi's conditions. Am J Hematol. 2004;77:257–267. doi: 10.1002/ajh.20183. [DOI] [PubMed] [Google Scholar]
- 11.Carrasco D, Barrachina M, Prieto M, Berenguer J. Clomiphene citrate and liver-cell adenoma. N Engl J Med. 1984;310:1120–1121. doi: 10.1056/NEJM198404263101716. [DOI] [PubMed] [Google Scholar]
- 12.Vazquez JJ, Marigil MA. Liver-cell adenoma in an epileptic man on barbiturates. Histol Histopathol. 1989;4:301–303. [PubMed] [Google Scholar]
- 13.Espat J, Chamberlain RS, Sklar C, Blumgart LH. Hepatic adenoma associated with recombinant human growth hormone therapy in a patient with Turner's syndrome. Dig Surg. 2000;17:640–643. doi: 10.1159/000051977. [DOI] [PubMed] [Google Scholar]
- 14.Bioulac-Sage P, Rebouissou S, Thomas C, Blanc JF, Saric J, Sa Cunha A, Rullier A, Cubel G, Couchy G, Imbeaud S, et al. Hepatocellular adenoma subtype classification using molecular markers and immunohistochemistry. Hepatology. 2007;46:740–748. doi: 10.1002/hep.21743. [DOI] [PubMed] [Google Scholar]
- 15.Manichon AF, Bancel B, Durieux-Millon M, Ducerf C, Mabrut JY, Lepogam MA, Rode A. Hepatocellular adenoma: Evaluation with contrast-enhanced ultrasound and MRI and correlation with pathologic and phenotypic classification in 26 lesions. HPB Surg. 2012;2012:418745. doi: 10.1155/2012/418745. [DOI] [PMC free article] [PubMed] [Google Scholar]
- 16.Bluteau O, Jeannot E, Bioulac-Sage P, Marqués JM, Blanc JF, Bui H, Beaudoin JC, Franco D, Balabaud C, Laurent-Puig P, Zucman-Rossi J. Bi-allelic inactivation of TCF1 in hepatic adenomas. Nat Genet. 2002;32:312–315. doi: 10.1038/ng1001. [DOI] [PubMed] [Google Scholar]
- 17.Pelletier L, Rebouissou S, Paris A, Rathahao-Paris E, Perdu E, Bioulac-Sage P, Imbeaud S, Zucman-Rossi J. Loss of hepatocyte nuclear factor 1alpha function in human hepatocellular adenomas leads to aberrant activation of signaling pathways involved in tumorigenesis. Hepatology. 2010;51:557–566. doi: 10.1002/hep.23362. [DOI] [PubMed] [Google Scholar]
- 18.Antequera F, Bird A. Number of CpG islands and genes in human and mouse. Proc Natl Acad Sci USA. 1993;90:11995–11999. doi: 10.1073/pnas.90.24.11995. [DOI] [PMC free article] [PubMed] [Google Scholar]
- 19.Baylin SB, Jones PA. A decade of exploring the cancer epigenome-biological and translational implications. Nat Rev Cancer. 2011;11:726–734. doi: 10.1038/nrc3130. [DOI] [PMC free article] [PubMed] [Google Scholar]
- 20.Um TH, Kim H, Oh BK, Kim MS, Kim KS, Jung G, Park YN. Aberrant CpG island hypermethylation in dysplastic nodules and early HCC of hepatitis B virus-related human multistep hepatocarcinogenesis. J Hepatol. 2011;54:939–947. doi: 10.1016/j.jhep.2010.08.021. [DOI] [PubMed] [Google Scholar]
- 21.Pogribny IP, Rusyn I. Role of epigenetic aberrations in the development and progression of human hepatocellular carcinoma. Cancer Lett. 2014;342:223–230. doi: 10.1016/j.canlet.2012.01.038. [DOI] [PMC free article] [PubMed] [Google Scholar]
- 22.Suzuki MM, Bird A. DNA methylation landscapes: Provocative insights from epigenomics. Nat Rev Genet. 2008;9:465–476. doi: 10.1038/nrg2341. [DOI] [PubMed] [Google Scholar]
- 23.Fuks F, Hurd PJ, Wolf D, Nan X, Bird AP, Kouzarides T. The methyl-CpG-binding protein MeCP2 links DNA methylation to histone methylation. J Biol Chem. 2003;278:4035–4040. doi: 10.1074/jbc.M210256200. [DOI] [PubMed] [Google Scholar]
- 24.Kim BH, Cho NY, Shin SH, Kwon HJ, Jang JJ, Kang GH. CpG island hypermethylation and repetitive DNA hypomethylation in premalignant lesion of extrahepatic cholangiocarcinoma. Virchows Arch. 2009;455:343–351. doi: 10.1007/s00428-009-0829-4. [DOI] [PubMed] [Google Scholar]
- 25.Zhang YJ, Wu HC, Yazici H, Yu MW, Lee PH, Santella RM. Global hypomethylation in hepatocellular carcinoma and its relationship to aflatoxin B(1) exposure. World J Hepatol. 2012;4:169–175. doi: 10.4254/wjh.v4.i5.169.. [DOI] [PMC free article] [PubMed] [Google Scholar]
- 26.Tangkijvanich P, Hourpai N, Rattanatanyong P, Wisedopas N, Mahachai V, Mutirangura A. Serum LINE-1 hypomethylation as a potential prognostic marker for hepatocellular carcinoma. Clin Chim Acta. 2007;379:127–133. doi: 10.1016/j.cca.2006.12.029. [DOI] [PubMed] [Google Scholar]
- 27.Wu HC, Wang Q, Yang HI, Tsai WY, Chen CJ, Santella RM. Global DNA methylation levels in white blood cells as a biomarker for hepatocellular carcinoma risk: A nested case-control study. Carcinogenesis. 2012;33:1340–1345. doi: 10.1093/carcin/bgs160. [DOI] [PMC free article] [PubMed] [Google Scholar]
- 28.Graziadei I, Finkenstedt A, Stauber RE, Müller C, Trauner M, Vogel W. 78 Imatinib treatment for patients with advanced stage hepatocellular carcinoma: A multicenter phase II trial. Gastroenterology. 2010;138:S775–S776. doi: 10.1016/S0016-5085(10)63575-5. (Suppl 1) [DOI] [Google Scholar]
- 29.Pilati C, Letouzé E, Nault JC, Imbeaud S, Boulai A, Calderaro J, Poussin K, Franconi A, Couchy G, Morcrette G, et al. Genomic profiling of hepatocellular adenomas reveals recurrent FRK-activating mutations and the mechanisms of malignant transformation. Cancer Cell. 2014;25:428–441. doi: 10.1016/j.ccr.2014.03.005. [DOI] [PubMed] [Google Scholar]
- 30.You JS, Jones PA. Cancer genetics and epigenetics: Two sides of the same coin? Cancer cell. 2012;22:9–20. doi: 10.1016/j.ccr.2012.06.008. [DOI] [PMC free article] [PubMed] [Google Scholar]
- 31.Anwar SL, Lehmann U. DNA methylation, microRNAs, and their crosstalk as potential biomarkers in hepatocellular carcinoma. World J Gastroenterol. 2014;20:7894–7913. doi: 10.3748/wjg.v20.i24.7894. [DOI] [PMC free article] [PubMed] [Google Scholar]
- 32.Knudson AG. Cancer genetics. Am J Med Genet. 2002;111:96–102. doi: 10.1002/ajmg.10320. [DOI] [PubMed] [Google Scholar]
- 33.Rodriguez-Paredes M, Esteller M. Cancer epigenetics reaches mainstream oncology. Nat Med. 2011;17:330–339. doi: 10.1038/nm.2305. [DOI] [PubMed] [Google Scholar]
- 34.Cedar H, Bergman Y. Programming of DNA methylation patterns. Annu Rev Biochem. 2012;81:97–117. doi: 10.1146/annurev-biochem-052610-091920. [DOI] [PubMed] [Google Scholar]
- 35.Lee HS, Kim BH, Cho NY, Yoo EJ, Choi M, Shin SH, Jang JJ, Suh KS, Kim YS, Kang GH. Prognostic implications of and relationship between CpG island hypermethylation and repetitive DNA hypomethylation in hepatocellular carcinoma. Clin Cancer Res. 2009;15:812–820. doi: 10.1158/1078-0432.CCR-08-0266. [DOI] [PubMed] [Google Scholar]
- 36.Park HJ, Yu E, Shim YH. DNA methyltransferase expression and DNA hypermethylation in human hepatocellular carcinoma. Cancer Lett. 2006;233:271–278. doi: 10.1016/j.canlet.2005.03.017. [DOI] [PubMed] [Google Scholar]
- 37.Csepregi A, Röcken C, Hoffmann J, Gu P, Saliger S, Müller O, Schneider-Stock R, Kutzner N, Roessner A, Malfertheiner P, Ebert MP. APC promoter methylation and protein expression in hepatocellular carcinoma. J Cancer Res Clin Oncol. 2008;134:579–589. doi: 10.1007/s00432-007-0321-y. [DOI] [PMC free article] [PubMed] [Google Scholar]
- 38.Lehmann U, Berg-Ribbe I, Wingen LU, Brakensiek K, Becker T, Klempnauer J, Schlegelberger B, Kreipe H, Flemming P. Distinct methylation patterns of benign and malignant liver tumors revealed by quantitative methylation profiling. Clin Cancer Res. 2005;11:3654–3660. doi: 10.1158/1078-0432.CCR-04-2462. [DOI] [PubMed] [Google Scholar]
- 39.Hua D, Hu Y, Wu YY, Cheng ZH, Yu J, Du X, Huang ZH. Quantitative methylation analysis of multiple genes using methylation-sensitive restriction enzyme-based quantitative PCR for the detection of hepatocellular carcinoma. Exp Mol Pathol. 2011;91:455–460. doi: 10.1016/j.yexmp.2011.05.001. [DOI] [PubMed] [Google Scholar]
- 40.Wang L, Wang WL, Zhang Y, Guo SP, Zhang J, Li QL. Epigenetic and genetic alterations of PTEN in hepatocellular carcinoma. Hepatol Res. 2007;37:389–396. doi: 10.1111/j.1872-034X.2007.00042.x. [DOI] [PubMed] [Google Scholar]
- 41.Lee S, Lee HJ, Kim JH, Lee HS, Jang JJ, Kang GH. Aberrant CpG island hypermethylation along multistep hepatocarcinogenesis. Am J Pathol. 2003;163:1371–1378. doi: 10.1016/S0002-9440(10)63495-5. [DOI] [PMC free article] [PubMed] [Google Scholar]
- 42.Nishida N, Kudo M, Nagasaka T, Ikai I, Goel A. Characteristic patterns of altered DNA methylation predict emergence of human hepatocellular carcinoma. Hepatology. 2012;56:994–1003. doi: 10.1002/hep.25706. [DOI] [PubMed] [Google Scholar]
- 43.Shim YH, Yoon GS, Choi HJ, Chung YH, Yu E. p16 Hypermethylation in the early stage of hepatitis B virus-associated hepatocarcinogenesis. Cancer Lett. 2003;190:213–219. doi: 10.1016/S0304-3835(02)00613-4. [DOI] [PubMed] [Google Scholar]
- 44.Boas FE, Do B, Louie JD, Kothary N, Hwang GL, Kuo WT, Hovsepian DM, Kantrowitz M, Sze DY. Optimal imaging surveillance schedules after liver-directed therapy for hepatocellular carcinoma. J Vasc Interv Radiol. 2015;26:69–73. doi: 10.1016/j.jvir.2014.09.013. [DOI] [PubMed] [Google Scholar]
- 45.Kong WT, Wang WP, Huang BJ, Ding H, Mao F, Si Q. Contrast-enhanced ultrasound in combination with color doppler ultrasound can improve the diagnostic performance of focal nodular hyperplasia and hepatocellular adenoma. Ultrasound Med Biol. 2015;41:944–951. doi: 10.1016/j.ultrasmedbio.2014.11.012. [DOI] [PubMed] [Google Scholar]
- 46.Christensen U, Simonsen M, Harrit N, Sottrup-Jensen L. Pregnancy zone protein, a proteinase-binding macroglobulin. Interactions with proteinases and methylamine. Biochemistry. 1989;28:9324–9331. doi: 10.1021/bi00450a012. [DOI] [PubMed] [Google Scholar]
- 47.Berne BH. Alpha-2 pregnoglobulin (pregnancy zone protein)-An estrogen-dependent macroglobulin elevated in pregnancy and oral contraception. Clin Chem. 1973;19:657. [Google Scholar]
- 48.Boxberger KH, Hagenbuch B, Lampe JN. Common drugs inhibit human organic cation transporter 1 (OCT1)-mediated neurotransmitter uptake. Drug Metab Dispos. 2014;42:990–995. doi: 10.1124/dmd.113.055095. [DOI] [PMC free article] [PubMed] [Google Scholar]
- 49.Thomas DP, Vane JR. 5-hydroxytryptamine in the circulation of the dog. Nature. 1967;216:335–338. doi: 10.1038/216335a0. [DOI] [PubMed] [Google Scholar]
- 50.Cao C, Li X, Liu T, Zhang L, Shen K, Zhu H. Human organic cation transporter 1 protein levels of granulocytes can optimize imatinib therapy in patients with chronic myeloid leukemia. Acta Haematol. 2015;133:199–204. doi: 10.1159/000365437. [DOI] [PubMed] [Google Scholar]
- 51.Loeb LA, Harris CC. Advances in chemical carcinogenesis: A historical review and prospective. Cancer Res. 2008;68:6863–6872. doi: 10.1158/0008-5472.CAN-08-2852. [DOI] [PMC free article] [PubMed] [Google Scholar]
- 52.Fraga MF, Herranz M, Espada J, Ballestar E, Paz MF, Ropero S, Erkek E, Bozdogan O, Peinado H, Niveleau A, et al. A mouse skin multistage carcinogenesis model reflects the aberrant DNA methylation patterns of human tumors. Cancer Res. 2004;64:5527–5534. doi: 10.1158/0008-5472.CAN-03-4061. [DOI] [PubMed] [Google Scholar]
- 53.Yamamoto E, Yamano HO, Suzuki H, Kamimae S, Imai K, Shinomura Y, Toyota M. The role of aberrant DNA methylation in carcinogenesis of colorectal tumor with K-ras mutation. Japan J Mol Tumor Marker Res. 2010;25:37–38. (In Japanese) [Google Scholar]
- 54.Pogribny IP, Rusyn I. Environmental toxicants, epigenetics, and cancer. Adv Exp Med Biol. 2013;754:215–232. doi: 10.1007/978-1-4419-9967-2_11. [DOI] [PMC free article] [PubMed] [Google Scholar]