

Abstract
The intensity of the total choline (tCho) signal in spectroscopic images of tumors is spatially heterogeneous. The likewise heterogeneous physiologic tumor microenvironment may contribute to this heterogeneity. We therefore investigated the relationship between hypoxia, choline metabolites, and choline kinase (Chk) in a human prostate cancer model. Human PC-3 prostate cancer cells were engineered to express enhanced green fluorescent protein (EGFP) under hypoxic conditions. These PC-3-5HRE-EGFP cells were characterized in culture and as tumors transplanted in mice using 1H magnetic resonance spectroscopy (MRS) and MRS imaging (MRSI) combined with EGFP fluorescence microscopy and imaging. Hypoxic EGFP-fluorescing tumor regions colocalized with regions of high tCho in combined MRSI and optical imaging studies. Cellular phosphocholine (PC) and tCho concentrations as well as Chk expression levels significantly increased following exposure of PC-3 cells to hypoxia. A putative promoter region located 5′ of the translation start site of the human chk-α gene was cloned and luciferase (Luc)-based reporter vector constructs were generated. Luc reporter assays provided evidence that some of the putative hypoxia response elements (HRE) within this putative chk-α promoter region functioned in vitro. Chromatin immunoprecipitation assays using an antibody against hypoxia-inducible factor (HIF)-1α showed that HIF-1 can directly bind this region of the endogenous chk-α promoter in hypoxic PC-3-5HRE-EGFP cells. These data suggest that HIF-1 activation of HREs within the putative chk-α promoter region can increase Chk-α expression within hypoxic environments, consequently increasing cellular PC and tCho levels within these environments.
Introduction
The alteration of choline phospholipid metabolism in cancer cells is a well-established observation (1–4) and several of the enzymes and pathways causing these alterations have been identified (5–7). However, the conditions and composition of the tumor microenvironment in vivo, which is for example characterized by hypoxia, which modulate these alterations, have not been extensively studied.
The increased levels of phosphocholine (PC) in prostate and other cancers (4) result in an elevation of the total choline (tCho)-containing compound signal detected in preclinical (8) and clinical 1H magnetic resonance spectroscopy (MRS) and MRS imaging (MRSI) studies (9, 10). In prostate cancer, this tCho signal, combined with the citrate signal, has been shown to correlate with staging of the disease by the Gleason score and has shown promise in clinical 1H MRSI studies of prostate cancer to noninvasively evaluate prostate cancer aggressiveness (10). An overexpression of choline kinase (Chk) has been identified as one of the major causes of increased PC in clinical prostate cancers (11). Chk overexpression and increased activity has also been shown in malignant cells and tumors of the lung, colon, breast, and ovaries (7, 11–13). In mammalian cells, the three known isoforms of Chk are encoded by two separate genes, chk-α and chk-β (14), with two functional isoforms Chk-α1 and Chk-α2 resulting from alternative splicing of the chk-α transcript (14). Homodimeric and heterodimeric forms of Chk confer its enzymatic activity (14). Serum (15), hormones (16, 17), mitogens, and growths factors, such as insulin (15, 18, 19), platelet-derived growth factor (19, 20), fibroblast growth factor (19, 20), epidermal growth factor (18), prolactin (21), and estrogens (22), can activate Chk. Carcinogens can induce Chk-α expression (14), possibly due to a xenobiotic-responsive element in the putative promoter region of the chk-α gene (14). Pharmacologic (23) and RNA interference–mediated (12) targeting of Chk are currently being explored as potential anticancer therapies. These studies have confirmed that Chk contributes to malignant transformation and progression, as down-regulating Chk resulted in increased differentiation (12) and reduced proliferation of breast cancer cells (12, 23) and reduced tumor xenograft growth (23).
The spatial distribution of the tCho signal detected by MRSI in malignant prostate tumors (9, 10), as well as in breast (24) and brain (25) tumors, is frequently heterogeneous. The causes for this heterogeneity are largely unknown because molecular characterizations of excised tumor specimens typically report on the entire sample. Therefore, information on the spatial heterogeneity of enzyme distributions, especially in relation to the tumor micro-environment, is not retained. Hypoxia is known to exist in several cancers, including prostate cancer (26). These hypoxic tumor microenvironments pose a problem for radiation and chemotherapy (27, 28); cancer cells located in hypoxic environments undergo adaptive responses, which render them resistant to radiation and chemotherapy, resulting in recurrence (29). Cells adapt to hypoxia by stabilizing the a subunit of hypoxia-inducible transcription factor-1 (HIF-1), which is ubiquitinated and degraded under normoxic conditions. HIF-1 functions as transcriptional activator for several genes containing hypoxia response elements (HREs) within promoter/enhancer regions of these genes (30). Thus, HIF-1 modulates the expression of, among others, vascular endothelial growth factor (VEGF), inducible nitric oxide synthase, heme oxygenase 1 glucose transporter, and the glycolytic enzymes aldolase A, phosphoglycerate kinase 1, enolase 1, and lactate dehydrogenase A by up-regulating their gene expression in hypoxic regions (30).
We have previously described a human prostate cancer cell line, PC-3-5HRE-EGFP, with inducible enhanced green fluorescent protein (EGFP) expression under the regulation of a HRE-containing promoter (31). The availability of this prostate cancer model expressing EGFP within hypoxic microenvironments has now allowed us to investigate the relationship between hypoxia, the MRSI-detectable tCho and PC concentrations, and Chk regulation. This will further our understanding of the role of hypoxia in the heterogeneous distribution of tCho in vivo. Combined 1H MRSI and optical imaging was performed on PC-3-5HRE-EGFP prostate cancer xenografts. The effects of hypoxia on cellular PC, glycerophosphocholine (GPC), and free choline (Cho) concentrations were also assessed in wild-type PC-3 and PC-3-5HRE-EGFP cells in culture using 1H MRS of cell extracts. Chk protein levels were detected by immunoblotting in parallel experiments. To delineate the molecular pathways leading to the hypoxia-induced changes in these prostate cancer models, we cloned a portion of the putative human chk-α promoter and identified putative functional HREs within it using luciferase (Luc)-based reporter assays. Finally, we directly tested for in vivo binding of HIF-1 to the endogenous chk-α promoter in human PC-3 prostate cancer cells maintained under hypoxia using chromatin immunoprecipitation (ChIP) assays. These studies provide compelling evidence that hypoxia regulates Chk expression and consequently cellular and tumoral PC and tCho concentrations in this prostate cancer xenograft model by means of HIF-1α signaling.
Materials and Methods
Prostate cancer cell models, induction, and detection of hypoxia
An androgen-independent human prostate cancer cell line, PC-3 (32, 33), derived from a metastatic lesion of a prostatic adenocarcinoma in the lumbar vertebra, was obtained from the American Type Culture Collection. Wild-type PC-3 cells were maintained as previously described (4). To generate PC-3 cells that express EGFP under hypoxic conditions as an internal, HIF-1–driven hypoxia sensor (Fig. 1A), PC-3 cells were stably transfected with a construct containing five copies of the HRE of the human VEGF-A gene ligated to the cDNA of EGFP, which generated PC-3-5HRE-EGFP as previously described (31).
Figure 1.

A, simplified diagram depicting the 5HRE-EGFP construct, which is activated by HIF-1 (HIF-1α/HIF-1β dimer) only under hypoxic conditions as HIF-1α is continuously degraded under normoxic conditions. HIF-1 binds HREs in the 5HRE-EGFP construct resulting in EGFP expression, which can be detected by fluorescence microscopy and imaging. B, bright-field (top) and EGFP fluorescence (bottom) microscopic images (40 × lens) of the same FOVs from normoxic (left) and hypoxic (right) live PC-3-5HRE-EGFP cells where hypoxia induces robust EGFP fluorescence. C, immunoblots of EGFP levels in total protein from cell lysates indicate little or no EGFP expression under normoxia (left lane), whereas high EGFP protein expression was found under hypoxic (right lane) conditions. Actin immunoblotting was performed as a loading control.
Wild-type PC-3 or PC-3-5HRE-EGFP human prostate cancer cells were exposed to hypoxic conditions in a commercially available culture chamber (BioSpherix Ltd.). This humidified culture chamber was maintained at 37°C and equilibriated with a mixture of 0.3% to 0.5% O2 and 5% CO2 for the required time intervals using controlled N2 and CO2 gas infusions (BioSpherix Ltd.). In some experiments, hypoxia was mimicked with 200 μmol/L CoCl2 (31). Controls were placed in a standard cell culture incubator at 37°C in a humidified atmosphere containing 21% O2 and 5% CO2.
EGFP expression in normoxic control and hypoxic PC-3-5HRE-EGFP cell cultures was detected by fluorescence microscopy using a 20× objective attached to a Nikon inverted microscope, equipped with a filter set for 450 to 490 nm excitation and 500 to 550 nm emission and a Nikon Coolpix digital camera (Nikon Instruments, Inc.). EGFP expression was verified in corresponding PC-3-5HRE-EGFP protein lysates subjected to SDS-PAGE and by immunoblotting with anti-EGFP antibody (BD Biosciences) as described below.
Tumor xenograft studies
Solid PC-3-5HRE-EGFP tumor xenografts were obtained by inoculating 2 × 10⁶ PC-3-5HRE-EGFP cells in 0.1 mL HBSS (Sigma-Aldrich) s.c. in the right flank of male severe combined immunodeficient (SCID) mice. Tumor xenografts reached their final experimental size of 297 ± 51 mm3 (mean ± SE, n = 18) within 8 weeks. As previously described, low oxygen tension of pO2 of ~0 mmHg was detected in EGFP-fluorescing regions, and higher oxygen tensions comparable with normal muscle tissue were detected in nonfluorescing peripheral tumor regions in in vivo measurements using a fiber-optic oxygen probe (31).
Combined in vivo MRSI and ex vivo EGFP fluorescence imaging
Twenty-one tumors were studied with combined MRSI and EGFP fluorescence imaging. MRSI was performed on preclinical MR scanners using two-dimensional chemical shift imaging (CSI) sequences. The BASSALE sequence was implemented on a horizontal bore 4.7 T GE-CSI (Bruker Biospin Corp.) spectrometer (n = 7) as previously described (34, 35). A standard two-dimensional CSI spin-echo sequence was used on a 4.7 T Bruker Avance (Bruker BioSpin Corp.) spectrometer (n = 14). Male SCID mice bearing PC-3-5HRE-EGFP tumor xenografts were anesthetized as previously described (31). The tumor was placed inside a home-built solenoid coil, mounted on a heated cradle (31). A reference image from a 4-mm-thick central tumor slice was acquired using a spin-echo sequence (msme-tomo, Bruker). Water-suppressed MRSI was performed on the same 4-mm-thick central slice, with an in-plane resolution of 0.5 mm × 0.5 mm per pixel for BASSALE or 1 mm × 1 mm per pixel for the two-dimensional CSI sequence with VAPOR water suppression and the following variables: echo time (TE) of 272 or 136 ms (two cases), repetition time of 1,086 ms, field of view (FOV) of 1.6 cm × 1.6 cm, 256 phase encode steps (16 × 16 voxels), number of scans (NS) of 6 for BASSALE and 8 for two-dimensional CSI, block size of 1,024, and sweep width of 4,000 Hz. Reference two-dimensional CSI images of the unsuppressed water signal were acquired of the same slice with TE = 15 ms and NS = 2, with all other variables remaining the same.
Following these MRSI studies, mice were sacrificed and each tumor was marked for spatial referencing and sectioned to obtain a freshly cut 2-mm-thick central slices coarsely matching the central MRSI-imaged slice. Bright-field and EGFP fluorescence images of the same FOV were acquired from both sides of this central fresh tumor slice with a 1× objective on the Nikon inverted microscope described above to visualize hypoxia.
In vivo MRSI and ex vivo EGFP fluorescence data processing, coregistration of MRSI with EGFP fluorescence images, and subsequent colocalization analysis
Spectroscopic images of the tCho-containing compound signal at 3.2 ppm and the water signal at 4.7 ppm were generated from the MRSI data sets using an in-house IDL program. These MRSI, EGFP fluorescence, and bright-field images from the same FOV were imported in the freeware program ImageJ 1.37v1 and converted to 8-bit grayscale images. Water MRSI or the spin-echo image along with corresponding tCho MRSI image, as well as EGFP fluorescence along with corresponding bright-field image, which were spatially registered in ImageJ, underwent the same image transformations. The bright-field images from both sides of the tumor slice, along with EGFP fluorescence images, were registered to each other by rigid body transformation using the TurboReg plug-in.2 The averaged image of the coregistered EGFP fluorescence images from both sides of the central tumor slice was generated to give a more accurate representative of the overall fluorescence image throughout the central tumor slice.
Coregistration of the microscopic EGFP to the corresponding tCho MRSI image was achieved by registering the EGFP-registered, averaged bright-field image, which was considered the source image, to the tCho MRSI-registered water MRSI or spin-echo image, which was considered the target image, by affine transformation (36) using the TurboReg plug-in. Coregistration of the EGFP and tCho images could not be achieved for 3 of the 21 tumors because of drastic shape alteration of the central slice following excision.
To evaluate whether hypoxic regions contain high tCho levels, we subjected the coregistered EGFP fluorescence and tCho images to colocalization analysis using the Colocalization_Finder plug-in3 in ImageJ. Two points were considered colocalized if their respective intensities were strictly higher than the threshold of their channels along with their intensity ratio settings. The threshold in each channel was set to a range from 50 to 255 (outlined by a yellow rectangular), and an additional intensity ratio threshold of 50% was applied (outlined by two red lines). For each tumor data set (n = 18), Pearson’s colocalization coefficient, rp, the overlap coefficient, r0, and Manders’ coefficients, k1, and k2, were calculated as previously published (37).
Dual-phase extraction of cells, MR data acquisition, and processing
Approximately 108 wild-type PC-3 or PC-3-5HRE-EGFP cells were harvested following 24 h of normoxic or hypoxic exposure and fractionated into lipid and water-soluble extracts using a dual-phase extraction method based on methanol/chloroform/water (1:1:1, v/v/v) as previously described (6, 12, 38). The samples were dissolved in deuterated solvents containing the concentration and chemical shift standards 3-(trimethylsilyl)propionic-2,2,3,3-d4 acid (TSP; Sigma-Aldrich) for water-soluble fractions or tetramethylsilane (TMS; Cambridge Isotope Laboratories, Inc.) for lipid fractions. Fully relaxed 1H MR spectra of the extracts were acquired on a Bruker Avance 500 spectrometer operating at 11.7 T using a 5-mm HX inverse probe as previously described (6, 12). MR spectra were processed, and the signal integrals listed below were measured using Bruker XWIN-NMR 3.5 software (Bruker BioSpin). Integrals of the N-(CH3)3 signal of Cho at 3.209 ppm, PC at 3.227 ppm, GPC at 3.236 ppm, and TSP at 0 ppm in the water-soluble extract 1H MR spectra, and of phosphatidylcholine at 3.220 ppm and TMS at 0 ppm in the lipid 1H MR spectra, were determined and normalized to cell size, number, volume, and the respective concentration standard as previously described (4–6, 12).
Protein lysates, gel electrophoresis, and immunoblotting
Following normoxic or hypoxic exposure, ~3 × 10⁶ cells at 60% to 70% confluence were homogenized with lysis buffer containing a protease inhibitor cocktail (Sigma-Aldrich) as previously described (12, 39). Total protein, 2.5 μg for EGFP detection or 50 μg for Chk detection, was loaded in each lane. SDS-PAGE and immunoblotting were performed as previously described (12, 39). Blocked membranes were incubated for 24 h with appropriate dilutions of mouse monoclonal anti-EGFP antibody (Clontech), custom-made polyclonal rabbit anti-Chk antibody as previously described (12), or mouse monoclonal anti-β-actin antibody (Sigma-Aldrich). Washed membranes were incubated with appropriate second-step horseradish peroxidase–conjugated antibodies (Amersham), developed with SuperSignal West Pico chemiluminescent substrate (Pierce Biotechnology), and captured on Blue Bio film (Denville Scientific).
Cloning of the Chk promoter
The genomic sequence of the putative human chk-α promoter was obtained by performing a BLAST search in National Center for Biotechnology Information4 using the known promoter sequence of the rat chk-α gene (D37884) as query sequence. A 2.3-kb region at the 5′-end of the human chk-α gene on chromosome 11 (NT_033903), immediately upstream of the translation start site, was found to contain several putative HRE sites with the core sequence RCGTG. Due to its high GC content, this 2.3-kb region was cloned as four smaller overlapping fragments, and formamide [5% (v/v) final concentration] was added in all PCRs. The four overlapping sequences were PCR amplified from human genomic DNA (Sigma-Aldrich). The paired sense (S) and antisense (AS) primer sequences used for the cloning of these fragments (Chk) were as follows: Chk S-1, 5′-GCGAGACAGAGTCTTGTTATGTTGGC-3′; Chk AS-1, 5′-CAGGGGCTTAGGAAATCCAGTGC-3′; Chk S-2, 5′-GGCAGCAGAATGGCGTGAACC-3′; Chk AS-2, 5′-CTCCCGCAGCCTCAGTTTCCC-3′; Chk S-3, 5′-CGCCACACCGCCTCCCCATTG-3′; Chk AS-3, 5′-GGCAGCGTCCACAACGCCAGTAGC-3′; Chk S-4, 5′-CAGTAGCCTCCAGACACGTTTCCTGCC-3′; and Chk AS-4, 5′-CAGAATTTTGGTTTTCATGCCCGACAG-3′. PCR products were subcloned into the pCR2.1 TA vector (Invitrogen). The full 2.3-kb promoter region was obtained by appropriate endonuclease digestions and ligation of these four overlapping fragments. Each of the four fragments alone, as well as several subligations of two or three consecutive fragments, and the full-length 2.3-kb chk-α promoter were cloned into the pGL4-basic Luc reporter vector (Promega). The partial promoter reporter constructs contain different putative HRE sites.
Firefly Luc-based reporter assays
Approximately 4 × 10⁴ cells per well were plated in 24-well plates 24 h before transfection and cultured overnight. Wells were transfected with 1 μg of the full-length pGL4-Chk-α-Luc reporter construct or one of the truncated putative HRE-containing reporter constructs, along with 0.25 μg of an EGFP (Amaxa, Inc.) or 5 ng Renilla Luc (Promega) expression plasmid, to normalize the Luc reading to the EGFP reading and account for variable transfection efficiencies. Following overnight incubation, plates were transferred to the hypoxia chamber or maintained under normoxia as described above. Luc expression was assayed using a Luc assay kit (Promega). Cells were lysed according to the manufacturer’s protocol and Luc activity and EGFP fluorescence were measured with a Victor V3 multiplate reader (Perkin-Elmer). Values were reported relative to the normoxic control readings as ratios (hypoxia to normoxia). Each experimental condition was measured in triplicate and each experiment was repeated at least twice.
Chromatin immunoprecipitation
ChIP was carried out following established protocols (40) using wild-type PC-3 cells. Approximately 107 cells were exposed to normoxic control conditions or hypoxia (<1% O2) for 24 h as described above. Cells were fixed by adding formaldehyde, at a concentration of 1% (v/v), for 5 min at 37°C and quenched by addition of glycine to give 0.125 mol/L concentration. Cells were lysed, and nuclei were isolated and lysed by nuclei lysis buffer as previously described (40). Samples were sonicated to shear DNA-protein complexes into fragments ranging from 600 to 1,000 bp of DNA. Chromatin-protein complexes were immunoprecipitated using anti-HIF-1α (Upstate USA), anti-histone deacetylase 3 (Upstate USA), or anti-glyceraldehyde-3-phosphate dehydrogenase (GAPDH; Santa Cruz Biotechnology, Inc.) antibodies. Anti-GAPDH samples and samples prepared under normoxia served as negative controls. Addition of 5 mol/L NaCl at 65°C overnight reversed sample cross-linking. DNA was extracted from proteins using phenol/chloroform/isoamyl alcohol (25:24:1), precipitated with ammonium acetate, resuspended in water, and subsequently analyzed by PCR using primers specific for the human chk-α promoter, ChIP S-1 and ChIP AS-1, which flank HRE sites 3 to 5, as follows: ChIP S-1, 5′-CAGCGTCCACAACGCCAGTAG-3′ and ChIP AS-1, 5′-AACCGAGGTCTGAAGGAGGGAAG-3′. The PCR product was amplified within 25 cycles and analyzed by ethidium bromide agarose gel electrophoresis using standard protocols.
Statistical analysis of experiments
An unpaired two-tailed t test (α = 0.05) was used to detect significant differences between experimental groups using the JMP software package (Brooks/Cole-Thomson Learning). P values of <0.05 were considered to be significant.
Results
Following exposure to 24 h of hypoxia (0.3–0.5% O2), human PC-3 cells stably transfected with the 5HRE-EGFP construct (Fig. 1A) exhibited bright EGFP fluorescence as shown in Fig. 1B. Exposure of PC-3-5HRE-EGFP cells to normoxic control conditions resulted in undetectable EGFP fluorescence (Fig. 1B). These findings were validated by immunoblots of total protein from corresponding normoxic and hypoxic cell lysates probed with anti-EGFP antibody. Hypoxic PC-3-5HRE-EGFP cells displayed an immunoreactive EGFP band, whereas normoxic cells did not (Fig. 1C), proving that EGFP was expressed only under hypoxic conditions.
To evaluate the relationship between hypoxia and the 1H MRS-detectable tCho signal, solid tumors derived from PC-3-5HRE-EGFP cells inoculated in male SCID mice were studied by a combination of in vivo MRSI to detect tCho and ex vivo optical fluorescence imaging to detect hypoxia-mediated EGFP expression. Figure 2 displays a typical data set from a representative PC-3-5HRE-EGFP tumor. A complete 1H MRSI data set together with a representative 1H MR spectrum from this 1H MRSI data set localized within a tumor region with relatively high tCho levels are displayed in Fig. 2A and B. In Fig. 2C, the 1H MRSI data set shown in Fig. 2A has been processed to display the tCho map overlaid with the corresponding spin density map to spatially reference the tCho distribution to the tumor morphology. Figure 2D shows the EGFP fluorescence image overlaid with the corresponding bright-field image from a fresh tumor slice matching the tCho map in Fig. 2C. A comparison of the tCho and EGFP images from this PC-3-5HRE-EGFP tumor revealed a coarse colocalization between the tCho and EGFP distributions.
Figure 2.

A, example of CSI MRSI data set from a PC-3-5HRE-EGFP tumor (550 mm3) obtained with a spatial resolution of 0.5 mm ×0.5 mm ×4.0 mm. B, spectrum from a single 0.5 mm at ×0.5 mm ×4.0 mm voxel showing tCho 3.2 ppm and lactate/triglycerides (lac/triglyc) at 1.3 ppm (TE = 272 ms). C, triplanar view of a tCho map (displayed in red) generated from the data set shown in Fig. 2A, fused with the corresponding spin-echo image displayed in blue. D, EGFP expression in hypoxic regions in a fresh tissue slice matching the MRSI slice, overlaid on a white light image. Comparison of C and D reveals a coarse colocalization between the tCho and EGFP distributions.
All PC-3-5HRE-EGFP tumors (n = 18) exhibited a heterogeneous distribution of tCho levels within the tumor, as did the EGFP fluorescence, indicating a heterogeneous distribution of hypoxic regions within these tumors. To assess the level of colocalization between tCho and EGFP in PC-3-5HRE-EGFP tumors quantitatively, we first registered the EGFP to the tCho image by warping the optical imaging data set containing the EGFP image to the 1H MRSI/MRI data set containing the tCho MRSI image. Figure 3A shows representative example images of a warped bright-field image with its corresponding warped EGFP fluorescence image as well as the corresponding tCho MSRI image. Overlay of the tCho image displayed in red and the warped EGFP fluorescence image in green showed partial colocalization of tCho and EGFP as evident from the yellow pixels (Fig. 3A). The pixel intensity correlation diagram of the tCho and EGFP image (Fig. 3A) exhibited a high correlation of red tCho with green EGFP pixel intensities, as evident from the large number of pixels concentrated on a straight line y = x (Fig. 3A). All colocalized pixels within the thresholds of 50 < y < 255, 50 < x < 255, y/x > 50%, and x/y > 50% are displayed in white on the tCho and EGFP overlay image (Fig. 3A), showing a relatively high degree of colocalization of tCho and EGFP in hypoxic regions. The pixel intensity correlation diagrams of 18 PC-3-5HRE-EGFP tumors are summed in Fig. 3B. The high number of pixels localized on the straight line y = x indicates good colocalization of EGFP fluorescence (green) and tCho signal (red). Pearson’s colocalization coefficient from these 18 tumors was rp = 0.389 ± 0.043, the overlap coefficient was r0 = 0.944 ± 0.003, and the Manders’ coefficients were k1 = 0.907 ± 0.025 and k2 = 0.998 ± 0.032 (all values are mean ± SE, n = 18). The relatively good colocalization of tCho with EGFP and vice versa confirmed that hypoxic tumor regions with high EGFP expression contained increased tCho.
Figure 3.

A, the warped bright-field image (top left) was used to guide the concurrent warping of the corresponding EGFP fluorescence image (top center). Thus, the hypoxia-induced EGFP fluorescence and the corresponding tCho MRSI data set (top right) were coregistered as described in Materials and Methods. In the resulting overlay image (bottom left), the tCho MRSI image has been rendered in red, whereas EGFP fluorescence is shown in green so that colocalization becomes yellow. Bottom center, colocalization of tCho (red) and EGFP (green) was quantified by generating pixel intensity correlation diagrams of both images. Here, pixels within the yellow rectangular region and bounded by the red lines correspond to the pixels displayed in white in the overlay image shown in the bottom right panel. Therefore, an EGFP fluorescence and tCho MRSI point were only considered as colocalized if their respective intensities were higher than the threshold intensity [e.g., those points with intensities that ranged from 50 to 255 (yellow rectangular) plus an additional intensity ratio threshold of 50% that is bounded by the two red lines]. B, the sum of all pixel intensity correlation diagrams was generated to quantify the colocalization of the EGFP fluorescence (green) with the tCho MRSI signal and vice versa in all 18 tumors. The high number of pixels localized on what would be a straight line defined by y = x indicates good colocalization of EGFP fluorescence and tCho signal. This is indicative of increased tCho levels in tumor regions with high EGFP expression.
To further test our hypothesis that hypoxia positively regulates tCho levels, we measured cellular PC, GPC, and Cho levels in hypoxic versus normoxic wild-type PC-3 and PC-3-5HRE-EGFP cells in culture. Figure 4 shows that PC (P < 0.05) as well as tCho (P < 0.05) concentrations and the PC to GPC ratio (P < 0.05 for wild-type and P < 0.01 for PC-3-5HRE-EGFP) significantly increased following hypoxic exposure compared with normoxia. Because PC was the choline-containing metabolite responsible for the hypoxia-mediated increase in tCho in PC-3 cells, and Chk converts Cho to PC, we tested for changes in Chk expression levels following hypoxia. Immunoblots of cell lysates, which were probed with our custom-made anti-Chk antibody (12), showed that Chk protein levels were significantly higher following 24 h of hypoxia compared with normoxic control conditions in wild-type PC-3 and PC-3-5HRE-EGFP human prostate cancer cells (Fig. 4A and B). These results indicate that hypoxia increases cellular PC and thus tCho levels by inducing Chk protein expression in prostate cancer cells.
Figure 4.

Expanded regions of the 1H MR spectra of normoxic (left) and hypoxic (right) PC-3-5HRE-EGFP cells (A) and wild-type PC-3 cells (B) with corresponding immunoblots probed with Chk antibody. Actin immunoblotting was performed as a loading control. C, quantification of 1H MR spectra for wild-type PC-3 (left; n = 3) and PC-3-5HRE-EGFP (right; n = 4) PC-3 cell extracts from cells exposed to 24 h of hypoxic conditions and normoxic controls. Columns, mean; bars, SD. *, P < 0.05; **, P < 0.01.
As data from prostate tumor xenografts and cell culture showed that hypoxia drove up tCho and PC concentrations along with Chk protein expression levels, we tested for putative HRE sites within the human chk-α promoter region. The human chk-α promoter region was identified by a comparative BLAST search using the known rat chk-α promoter sequence (41). Figure 5 displays a region in the human genomic DNA that encompasses a 2.3-kb sequence immediately upstream of the translation start site of the human chk-α gene. Six putative HRE sites in this sequence are denoted by vertical bars to mark their nucleotide positions relative to the translation start site, with the core sequence RCGTG. This putative human chk-α promoter sequence has a high GC content and is TATA less, and to date, its core promoter has not yet been identified. Fragments of the putative human chk-α promoter, designated P2 to P7 (Fig. 5), which contained different numbers of putative HREs, as well as the full-length 2.3-kb sequence, designated P1 (Fig. 5), were tested for their response to hypoxia by pGL4-based Luc reporter assays in wild-type PC-3 cells. Hypoxic conditions were induced by treating cells for 24 h with 200 μmol/L CoCl2, which stabilizes HIF-1α and acts as a hypoxia mimetic. Figure 6A shows that the 2.3-kb (P1) construct pGL4-Chk-α-Luc (+1 to −2309 nucleotides) was not induced following CoCl2 treatment. However, the Luc reporter constructs containing truncations P4 to P7, which are devoid of the P2 (+1 to −670 nucleotides) portion, did respond by displaying hypoxia-induced Luc activity (Fig. 6A). Comparable with the pGL4-Chk-α-Luc, constructs P2 and P3 were not induced by CoCl2 treatment (Fig. 6A). These findings indicate that the P2 region of this putative human chk-α promoter may have transcriptional repressor activity. The pGL4-P5-Luc reporter construct (P5: −338 to −1068 nucleotides) displayed the strongest response to the hypoxia mimetic CoCl2, with a 2-fold induction by CoCl2 (n = 3; P < 0.02 hypoxia versus normoxia). The P5 sequence contains four putative HRE core binding sites (Fig. 5). Figure 6B shows the time course of Luc activity induction in PC-3 cells transiently transfected with pGL4-P5-Luc after 6, 12, 18, and 24 h of hypoxic exposure in a culture chamber containing pO2 < 1%. Induction of Luc activity first occurred at 12 h and continued through 18 and 24 h of hypoxic exposure, exhibiting maximum induction at 24 h (n = 3; P < 0.05 for 24 h versus 6 or 12 h). No additional significant increase in Luc induction was detected for time periods longer than 24 h (data not shown). Figure 6C shows that transient transfection of pGL4-P5-Luc in wild-type PC-3 as well as PC-3-5HRE-EGFP cells resulted in 2-fold (wild-type PC-3, n = 3; P < 0.05 compared with 12 h) and 1.6-fold (PC-3-5HRE-EGFP, n = 2) induction of Luc activity, respectively, following 24 h of exposure to hypoxia. These findings indicate that the sequence within the putative human chk-α promoter designated as P5 (Fig. 5), which contains four putative HREs, can transmit the hypoxia-mediated transcription induction of human chk-α in PC-3 prostate cancer cells.
Figure 5.
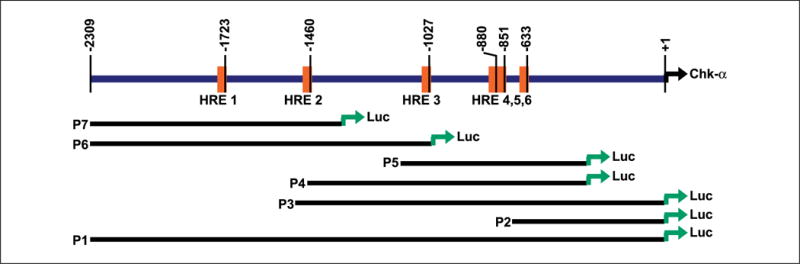
Schematic diagram of the putative human chk-α promoter region-firefly Luc-based reporter assay constructs. Top, the 2.3-kb region of the human chk-α gene, which is immediately upstream of the translation start site (+1). Putative HRE binding sites (core sequence RCGTG) are labeled HRE 1 to HRE 6 and represented by vertical orange bars. Bottom, P1, entire 2.3-kb Luc reporter construct; P2 to P7, Luc-reported constructs of truncated regions of this 2.3-kb sequence. All constructs were contained in the pGL4-basic vector and tested for endogenous HIF-1–mediated hypoxia-induced Luc expression in transient transfections of wild-type PC-3 and PC-3-5HRE-EGFP cells.
Figure 6.

A, the effect of hypoxia on Luc expression from the putative chk-α promoter region constructs, depicted in Fig. 5, was first tested by transient transfection of wild-type PC-3 cells with these constructs followed by exposure of these cells to the hypoxia mimetic CoCl2 (200 μmol/L) for 24 h. Y axis, induction was evaluated as the increase in Luc expression recorded during hypoxia relative to that observed during normoxia. Thus, in case of constructs P1 to P3, Luc expression was repressed under these conditions. Columns, mean (n = 3); bars, SD. *, P < 0.02, hypoxia compared with normoxia. B, wild-type PC-3 cells transiently transfected with the most responsive pGL4-P5-Luc reporter construct were exposed to hypoxic conditions in a hypoxic culture chamber (pO2 < 1%), which resulted in increased Luc activity at 24 h, indicative of HIF-1α stabilization and the apparent binding of HIF-1 to P5. Values are again reported as hypoxia to normoxia ratios. Columns, mean (n = 3); bars, SD. *, P < 0.05, groups were compared as indicated in the figure. C, hypoxic exposure of wild-type PC-3 (black columns) and PC-3-5HRE-EGFP (gray columns) cells transfected with pGL4-P5-Luc resulted in an induction of Luc activity at 24 h. Columns, mean (n = 2–3); bars, SD. *, P < 0.05, groups were compared as indicated in the figure. D, direct hypoxia-induced binding of HIF-1 to a region within the putative human chk-α promoter was shown in PC-3 cells by ChIP. Following normoxia or hypoxia (hypoxic culture chamber; pO2 < 1%), cross-linked chromatin-protein complexes from the treated PC-3 cells were immunoprecipitated with anti-HIF-1α antibody or control antibodies. A 282-bp sequence within the putative chk-α promoter, encompassing HREs 3 to 5, as depicted in Fig. 5, was PCR amplified from these precipitates using the primers ChIP S-1 and ChIP AS-1 (see Materials and Methods). Lane 1, total unprocessed chromatin; lane 2, anti-HIF-1α antibody precipitation following hypoxia; lane 3, anti-histone deacetylase 3 antibody precipitation following hypoxia; lane 4, anti-GAPDH antibody precipitation following hypoxia; lane 5, anti-HIF-1α precipitation following normoxia. Identical volumes from the final precipitations were used in the PCR.
ChIP assays were performed to determine whether stabilized HIF-1 can interact with putative HRE sites of the endogenous human chk-α promoter within the nucleus of live PC-3 prostate cancer cells. Chromatin isolated from PC-3 cells subjected to normoxic or hypoxic conditions (pO2 < 1%) was immunoprecipitated with anti-HIF-1α antibody, and precipitated DNA was PCR amplified using the primers ChIP S-1 and ChIP AS-1. These primers are specific to the region of the putative human chk-α promoter that encompasses HRE 3, 4, and 5 (Fig. 5). Figure 6D (lane 2) shows that use of this specific primer pair resulted in the amplification of a 282-bp PCR product following DNA precipitation from hypoxic PC-3 cells using an anti-HIF-1α antibody. The same amplification product was observed in positive control experiments, in which the same 282-bp chk-α promoter sequence was amplified from total unprocessed chromatin (lane 1) and from the ChIP DNA precipitated with an anti-histone deacetylase 3 antibody (lane 3). In contrast, nonspecific antibody-mediated precipitations resulted in DNA templates that were not amplified with these ChIP S-1 and ChIP AS-1 primers (lane 4). In addition, no amplification was seen in normoxic control PC-3 samples that were precipitated by anti-HIF-1α antibody (lane 5). These results indicate that HIF-1 binds to the endogenous human chk-α promoter in vivo in hypoxic PC-3 cells and mediates transcription.
Discussion
This multimodal molecular imaging study provides evidence that hypoxia can up-regulate Chk expression in cultured prostate cancer cells. This up-regulation of Chk can be detected as an increase of PC in cells and as an increase of tCho in vivo. We showed that a large proportion of high tCho-containing regions colocalized with the EGFP fluorescence from hypoxic regions within the tumors. These results were supported by cell culture data in the same human prostate cancer line, which showed that exposure to hypoxia increased Chk expression along with an elevation in cellular PC and tCho concentrations. Additionally, we cloned a portion of the putative promoter region of the human chk-α gene and showed with Luc-based reporter assays that an apparently functional hypoxia-inducible region exists within this region of the human chk-α gene. ChIP assays further corroborated and strengthened this finding by showing in vivo binding of HIF-1α to the endogenous chk-α promoter region in PC-3 prostate cancer cells.
Most genes with HREs in the promoter region function during the adaptive response of cells to hypoxia (42). It is therefore likely that the hypoxia-induced up-regulation of Chk-α and PC is part of the response of cancer cells to adapt and survive in hypoxic environments. The HIF-1α pathway has also been associated with human cancer progression and poor prognosis, and several genes that are transcriptionally activated through functional HREs are associated with cancer progression (30, 43). Likewise, Chk has been implicated in oncogenesis (11, 44). Chk is overexpressed in several cancers (11–13), where the increased Chk levels can confer increased proliferation rates (12, 23). Similarly, high PC levels are associated with a more aggressive cancer phenotype (4, 5, 13). Thus, Chk is gaining importance as a potential target for anticancer therapy (12, 23), which can be monitored noninvasively by 1H MRS and MRSI (12, 45). The data obtained here provide an additional mechanism of action to explain the existence of tCho heterogeneity in tumors. Given that Chk can be up-regulated in hypoxic regions, it would be useful to investigate the effect of down-regulating Chk to sensitize hypoxic cells to radiation or chemotherapy. Thus, Chk-targeted anticancer therapy may be used in combination with radiation or chemotherapy to target both hypoxic and normoxic cancer cells.
Hypoxic regions of tumors have long proven to be resilient and unresponsive to both radiotherapy and chemotherapy (27, 28, 43). Such resistance to treatment contributes to the incidence of cancer recurrence (29). Our results indicate that MRSI detection of tCho and its heterogeneity might prove to be a useful biomarker not only of tumor aggressiveness and progression but also of tumor hypoxia. tCho can be imaged noninvasively in prostate cancers by 1H MRS and MRSI (9, 10) and positron emission tomography using 11C- and 18F-labeled choline derivatives (46, 47). Although we observed elevated tCho within a large portion of hypoxic regions, regions of high tCho without EGFP were also occasionally observed. The latter indicates that factors other than hypoxia also contributed to the spatial heterogeneity of the tumoral tCho levels. Other factors and conditions of the tumor microenvironment, such as acidic extracellular pH (48, 49) as well as paracrine signaling between cancer cells and stromal cells (50), can also alter Chk and tCho levels and should be investigated. Although our cell studies showed a significant increase of both Chk and PC at 24-h exposure to hypoxia, some of the variability in colocalization may have also arisen from time-dependent differences between the Chk and the EGFP response to hypoxia in tumors. Additional studies validating these observations in other tumor models are also necessary before increased tCho can be used as an endogenous marker to assist in the evaluation of tumor hypoxia.
Acknowledgments
Grant support: NIH grants P50 CA103175 and R01 CA73850.
We thank Gary Cromwell for maintaining the cell lines and inoculating the mice, Meiyappan Solaiyappan for the reconstructed three-dimensional image shown in Fig. 2C, and Dr. Mahendran Botlagunta for assistance with the ChIP assay.
Footnotes
References
- 1.Negendank W. Studies of human tumors by MRS: a review. NMR Biomed. 1992;5:303–24. doi: 10.1002/nbm.1940050518. [DOI] [PubMed] [Google Scholar]
- 2.Podo F. Tumour phospholipid metabolism. NMR Biomed. 1999;12:413–39. doi: 10.1002/(sici)1099-1492(199911)12:7<413::aid-nbm587>3.0.co;2-u. [DOI] [PubMed] [Google Scholar]
- 3.Glunde K, Ackerstaff E, Mori N, et al. Choline phospholipid metabolism in cancer: consequences for molecular pharmaceutical interventions. Mol Pharm. 2006;3:496–506. doi: 10.1021/mp060067e. [DOI] [PubMed] [Google Scholar]
- 4.Ackerstaff E, Pflug BR, Nelson JB, et al. Detection of increased choline compounds with proton nuclear magnetic resonance spectroscopy subsequent to malignant transformation of human prostatic epithelial cells. Cancer Res. 2001;61:3599–603. [PubMed] [Google Scholar]
- 5.Aboagye EO, Bhujwalla ZM. Malignant transformation alters membrane choline phospholipid metabolism of human mammary epithelial cells. Cancer Res. 1999;59:80–4. [PubMed] [Google Scholar]
- 6.Glunde K, Jie C, Bhujwalla ZM. Molecular causes of the aberrant choline phospholipid metabolism in breast cancer. Cancer Res. 2004;64:4270–6. doi: 10.1158/0008-5472.CAN-03-3829. [DOI] [PubMed] [Google Scholar]
- 7.Iorio E, Mezzanzanica D, Alberti P, et al. Alterations of choline phospholipid metabolism in ovarian tumor progression. Cancer Res. 2005;65:9369–76. doi: 10.1158/0008-5472.CAN-05-1146. [DOI] [PubMed] [Google Scholar]
- 8.Fricke ST, Rodriguez O, Vanmeter J, et al. In vivo magnetic resonance volumetric and spectroscopic analysis of mouse prostate cancer models. Prostate. 2006;66:708–17. doi: 10.1002/pros.20392. [DOI] [PubMed] [Google Scholar]
- 9.Swanson MG, Vigneron DB, Tabatabai ZL, et al. Proton HR-MAS spectroscopy and quantitative pathologic analysis of MRI/3D-MRSI-targeted postsurgical prostate tissues. Magn Reson Med. 2003;50:944–54. doi: 10.1002/mrm.10614. [DOI] [PubMed] [Google Scholar]
- 10.Zakian KL, Sircar K, Hricak H, et al. Correlation of proton MR spectroscopic imaging with Gleason score based on step-section pathologic analysis after radical prostatectomy. Radiology. 2005;234:804–14. doi: 10.1148/radiol.2343040363. [DOI] [PubMed] [Google Scholar]
- 11.Ramirez de Molina A, Rodriguez-Gonzalez A, Gutierrez R, et al. Overexpression of choline kinase is a frequent feature in human tumor-derived cell lines and in lung, prostate, and colorectal human cancers. Biochem Biophys Res Commun. 2002;296:580–3. doi: 10.1016/s0006-291x(02)00920-8. [DOI] [PubMed] [Google Scholar]
- 12.Glunde K, Raman V, Mori N, et al. RNA interference-mediated choline kinase suppression in breast cancer cells induces differentiation and reduces proliferation. Cancer Res. 2005;65:11034–43. doi: 10.1158/0008-5472.CAN-05-1807. [DOI] [PubMed] [Google Scholar]
- 13.Nakagami K, Uchida T, Ohwada S, et al. Increased choline kinase activity and elevated phosphocholine levels in human colon cancer. Jpn J Cancer Res. 1999;90:419–24. doi: 10.1111/j.1349-7006.1999.tb00764.x. [DOI] [PMC free article] [PubMed] [Google Scholar]
- 14.Aoyama C, Liao H, Ishidate K. Structure and function of choline kinase isoforms in mammalian cells. Prog Lipid Res. 2004;43:266–81. doi: 10.1016/j.plipres.2003.12.001. [DOI] [PubMed] [Google Scholar]
- 15.Warden CH, Friedkin M. Regulation of choline kinase activity and phosphatidylcholine biosynthesis by mitogenic growth factors in 3T3 fibroblasts. J Biol Chem. 1985;260:6006–11. [PubMed] [Google Scholar]
- 16.Vigo C, Vance DE. Effect of diethylstilboestrol on phosphatidylcholine biosynthesis and choline metabolism in the liver of roosters. Biochem J. 1981;200:321–6. doi: 10.1042/bj2000321. [DOI] [PMC free article] [PubMed] [Google Scholar]
- 17.Pelech SL, Vance DE. Regulation of phosphatidylcholine biosynthesis. Biochim Biophys Acta. 1984;779:217–51. doi: 10.1016/0304-4157(84)90010-8. [DOI] [PubMed] [Google Scholar]
- 18.Uchida T. Stimulation of phospholipid synthesis in HeLa cells by epidermal growth factor and insulin: activation of choline kinase and glycerophosphate acyltransferase. Biochim Biophys Acta. 1996;1304:89–104. doi: 10.1016/s0005-2760(96)00109-9. [DOI] [PubMed] [Google Scholar]
- 19.Chung T, Huang JS, Mukherjee JJ, et al. Expression of human choline kinase in NIH 3T3 fibroblasts increases the mitogenic potential of insulin and insulin-like growth factor I. Cell Signal. 2000;12:279–88. doi: 10.1016/s0898-6568(00)00065-6. [DOI] [PubMed] [Google Scholar]
- 20.Jimenez B, del Peso L, Montaner S, et al. Generation of phosphorylcholine as an essential event in the activation of Raf-1 and MAP-kinases in growth factors-induced mitogenic stimulation. J Cell Biochem. 1995;57:141–9. doi: 10.1002/jcb.240570114. [DOI] [PubMed] [Google Scholar]
- 21.Ko KW, Cook HW, Vance DE. Reduction of phosphatidylcholine turnover in a Nb 2 lymphoma cell line after prolactin treatment. A novel mechanism for control of phosphatidylcholine levels in cells. J Biol Chem. 1986;261:7846–52. [PubMed] [Google Scholar]
- 22.Neeman M, Degani H. Early estrogen-induced metabolic changes and their inhibition by actinomycin D and cycloheximide in human breast cancer cells: 31P and 13C NMR studies. Proc Natl Acad Sci U S A. 1989;86:5585–9. doi: 10.1073/pnas.86.14.5585. [DOI] [PMC free article] [PubMed] [Google Scholar]
- 23.de Molina AR, Banez-Coronel M, Gutierrez R, et al. Choline kinase activation is a critical requirement for the proliferation of primary human mammary epithelial cells and breast tumor progression. Cancer Res. 2004;64:6732–9. doi: 10.1158/0008-5472.CAN-04-0489. [DOI] [PubMed] [Google Scholar]
- 24.Jacobs MA, Barker PB, Bottomley PA, et al. Proton magnetic resonance spectroscopic imaging of human breast cancer: a preliminary study. J Magn Reson Imaging. 2004;19:68–75. doi: 10.1002/jmri.10427. [DOI] [PubMed] [Google Scholar]
- 25.Stadlbauer A, Gruber S, Nimsky C, et al. Preoperative grading of gliomas by using metabolite quantification with high-spatial-resolution proton MR spectroscopic imaging. Radiology. 2006;238:958–69. doi: 10.1148/radiol.2382041896. [DOI] [PubMed] [Google Scholar]
- 26.Movsas B, Chapman JD, Hanlon AL, et al. Hypoxia in human prostate carcinoma: an Eppendorf Po2 study. Am J Clin Oncol. 2001;24:458–61. doi: 10.1097/00000421-200110000-00009. [DOI] [PubMed] [Google Scholar]
- 27.Harrison L, Blackwell K. Hypoxia and anemia: factors in decreased sensitivity to radiation therapy and chemotherapy? Oncologist. 2004;9(Suppl 5):31–40. doi: 10.1634/theoncologist.9-90005-31. [DOI] [PubMed] [Google Scholar]
- 28.Thomlinson RH, Gray LH. The histological structure of some human lung cancers and the possible implications for radiotherapy. Br J Cancer. 1955;9:539–49. doi: 10.1038/bjc.1955.55. [DOI] [PMC free article] [PubMed] [Google Scholar]
- 29.Brizel DM, Scully SP, Harrelson JM, et al. Tumor oxygenation predicts for the likelihood of distant metastases in human soft tissue sarcoma. Cancer Res. 1996;56:941–3. [PubMed] [Google Scholar]
- 30.Greijer AE, van der Groep P, Kemming D, et al. Upregulation of gene expression by hypoxia is mediated predominantly by hypoxia-inducible factor 1 (HIF-1) J Pathol. 2005;206:291–304. doi: 10.1002/path.1778. [DOI] [PubMed] [Google Scholar]
- 31.Raman V, Artemov D, Pathak AP, et al. Characterizing vascular parameters in hypoxic regions: a combined magnetic resonance and optical imaging study of a human prostate cancer model. Cancer Res. 2006;66:9929–36. doi: 10.1158/0008-5472.CAN-06-0886. [DOI] [PubMed] [Google Scholar]
- 32.Kaighn ME, Narayan KS, Ohnuki Y, et al. Establishment and characterization of a human prostatic carcinoma cell line (PC-3) Invest Urol. 1979;17:16–23. [PubMed] [Google Scholar]
- 33.Ohnuki Y, Marnell MM, Babcock MS, et al. Chromosomal analysis of human prostatic adenocarcinoma cell lines. Cancer Res. 1980;40:524–34. [PubMed] [Google Scholar]
- 34.Shungu DC, Glickson JD. Band-selective spin echoes for in vivo localized 1H NMR spectroscopy. Magn Reson Med. 1994;32:277–84. doi: 10.1002/mrm.1910320302. [DOI] [PubMed] [Google Scholar]
- 35.Bhujwalla ZM, Shungu DC, Glickson JD. Effects of blood flow modifiers on tumor metabolism observed in vivo by proton magnetic resonance spectroscopic imaging. Magn Reson Med. 1996;36:204–11. doi: 10.1002/mrm.1910360206. [DOI] [PubMed] [Google Scholar]
- 36.Thevenaz P, Ruttimann UE, Unser M. A pyramid approach to sub-pixel registration based on intensity. IEEE Trans Image Process. 1998;7:27–41. doi: 10.1109/83.650848. [DOI] [PubMed] [Google Scholar]
- 37.Manders EMM, Verbeek FJ, Aten JA. Measurement of co-localization of objects in dual-colour confocal images. J Microsc. 1993;169:375–82. doi: 10.1111/j.1365-2818.1993.tb03313.x. [DOI] [PubMed] [Google Scholar]
- 38.Tyagi RK, Azrad A, Degani H, et al. Simultaneous extraction of cellular lipids and water-soluble metabolites: evaluation by NMR spectroscopy. Magn Reson Med. 1996;35:194–200. doi: 10.1002/mrm.1910350210. [DOI] [PubMed] [Google Scholar]
- 39.Glunde K, Guggino SE, Solaiyappan M, et al. Extracellular acidification alters lysosomal trafficking in human breast cancer cells. Neoplasia. 2003;5:533–45. doi: 10.1016/s1476-5586(03)80037-4. [DOI] [PMC free article] [PubMed] [Google Scholar]
- 40.Wells J, Farnham PJ. Characterizing transcription factor binding sites using formaldehyde crosslinking and immunoprecipitation. Methods. 2002;26:48–56. doi: 10.1016/S1046-2023(02)00007-5. [DOI] [PubMed] [Google Scholar]
- 41.Uchida T. Regulation of choline kinase R: analyses of alternatively spliced choline kinases and the promoter region. J Biochem (Tokyo) 1994;116:508–18. doi: 10.1093/oxfordjournals.jbchem.a124554. [DOI] [PubMed] [Google Scholar]
- 42.Semenza GL. Hypoxia-inducible factor 1: oxygen homeostasis and disease pathophysiology. Trends Mol Med. 2001;7:345–50. doi: 10.1016/s1471-4914(01)02090-1. [DOI] [PubMed] [Google Scholar]
- 43.Harris AL. Hypoxia—a key regulatory factor in tumour growth. Nat Rev Cancer. 2002;2:38–47. doi: 10.1038/nrc704. [DOI] [PubMed] [Google Scholar]
- 44.Ramirez de Molina A, Gutierrez R, Ramos MA, et al. Increased choline kinase activity in human breast carcinomas: clinical evidence for a potential novel antitumor strategy. Oncogene. 2002;21:4317–22. doi: 10.1038/sj.onc.1205556. [DOI] [PubMed] [Google Scholar]
- 45.Al-Saffar NM, Troy H, Ramirez de Molina A, et al. Noninvasive magnetic resonance spectroscopic pharmacodynamic markers of the choline kinase inhibitor MN58b in human carcinoma models. Cancer Res. 2006;66:427–34. doi: 10.1158/0008-5472.CAN-05-1338. [DOI] [PubMed] [Google Scholar]
- 46.Glunde K, Jacobs MA, Bhujwalla ZM. Choline metabolism in cancer: implications for diagnosis and therapy. Expert Rev Mol Diagn. 2006;6:821–9. doi: 10.1586/14737159.6.6.821. [DOI] [PubMed] [Google Scholar]
- 47.Gambhir SS. Molecular imaging of cancer with positron emission tomography. Nat Rev Cancer. 2002;2:683–93. doi: 10.1038/nrc882. [DOI] [PubMed] [Google Scholar]
- 48.Gatenby RA, Gawlinski ET, Gmitro AF, et al. Acid-mediated tumor invasion: a multidisciplinary study. Cancer Res. 2006;66:5216–23. doi: 10.1158/0008-5472.CAN-05-4193. [DOI] [PubMed] [Google Scholar]
- 49.Galons JP, Job C, Gillies RJ. Increase of GPC levels in cultured mammalian cells during acidosis. A 31P MR spectroscopy study using a continuous bioreactor system. Magn Reson Med. 1995;33:422–6. doi: 10.1002/mrm.1910330317. [DOI] [PMC free article] [PubMed] [Google Scholar]
- 50.Mori N, Natarajan K, Chacko VP, et al. Choline phospholipid metabolites of human vascular endothelial cells altered by cyclooxygenase inhibition, growth factor depletion, and paracrine factors secreted by cancer cells. Mol Imaging. 2003;2:124–30. doi: 10.1162/15353500200303127. [DOI] [PubMed] [Google Scholar]