

Abstract
Suspensions of colloidal particles form a variety of ordered planar structures at an interface in response to an a.c. or d.c. electric field applied normal to the interface1–3. This field-induced pattern formation can be useful, for example, in the processing of materials. Here we explore the origin of the ordering phenomenon. We present evidence suggesting that the long-ranged attraction between particles which causes aggregation is mediated by electric-field-induced fluid flow. We have imaged an axially symmetric flow field around individual particles on a uniform electrode surface. The flow is induced by distortions in the applied electric field owing to inhomogeneities in the ‘double layer’ of ions and counterions at the electrode surface. The beads themselves can create these inhomogeneities, or alternatively, we can modify the electrode surfaces by lithographic patterning so as to introduce specified patterns into the aggregated structures.
Our experiments were performed in planar, rectangular wells, fabricated by sandwiching ~50-μm polymer (Kapton) spacers between a bottom electrode of oxide-capped silicon, SiOx, and a top electrode of indium tin oxide, ITO (SiOx/ITO); a pair of indium tin oxide electrodes (ITO/ITO) was also used in some cases. In this simple two-electrode arrangement, currents were monitored (in constant-voltage mode) by a potentiostat. Carboxylated (anionic) and aminated (cationic) polystyrene beads of 1 μm or 2 μm diameter, and with a titrated (total) surface charge density of ~50μC/cm−2, were obtained from Molecular Probes (Eugene, OR). Polystyrene beads in the range 2–20 μm were obtained from Polysciences (Warrington, PA). Beads were suspended in aqueous sodium azide solution and observed in epifluorescence or reflection differential interference contrast.
The photographs in Fig. 1 depict planar aggregates of beads adjacent to a uniform SiOx electrode in configurations of increasing internal order: gaseous (Fig. 1a), liquid (Fig. 1b) and crystalline (Fig. 1d) states, as well as a possible hexatic state (Fig. 1c), resembling that identified in other planar systems4, are readily identified. These stationary, dissipative states are separated by reversible transitions3. In ITO/ITO cells, transitions occur in response to a varying d.c. voltage whereas, in SiOx/ITO (as well as in ITO/ITO cells), they occur in response to a varying a.c. voltage (at typical frequencies of ≤ 1 kHz). Under conditions pertinent to Fig. 1, the crystalline state appears at a typical voltage gradient of 0.025 V μm−1. Significantly, in cells formed with an insulating thermal oxide (SiOx) electrode, an applied d.c. voltage produces no effect. Cationic and anionic beads behave in essentially identical fashion. When the applied voltage is removed, the patterns disappear and, unless constrained by gravity, beads redistribute into the bulk.
Figure 1.
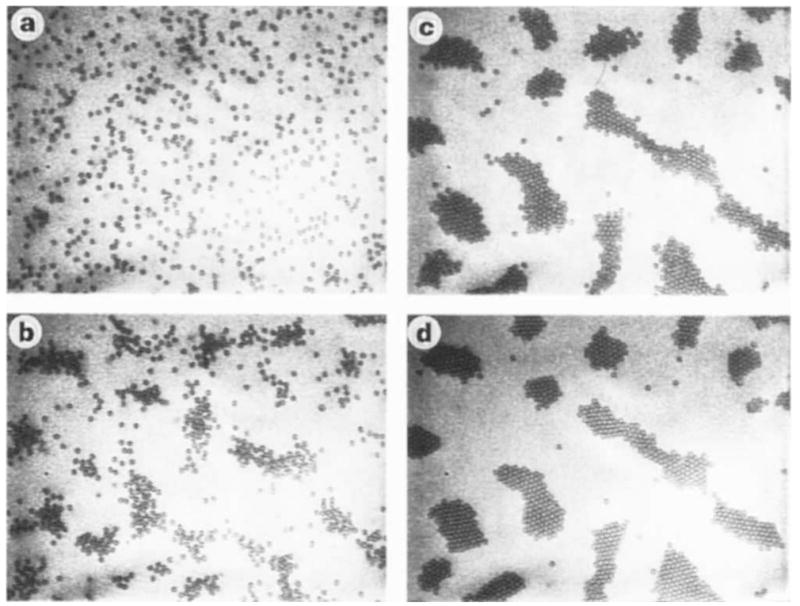
Sequence of increasingly ordered states of colloidal aggregates, a, gas (peak-to-peak voltage, Vpp = 0V); b, liquid (Vpp = 1.0V); c, hexatic(?) (Vpp = 1.4V); d, crystalline (Vpp = 1.5 V). All transitions are reversible. Observations were made in an SiOx/ITO cell (uniform electrodes) with a ~60-μm gap in response to an a.c. electric field of 1 kHz: the diameter of the carboxylated polystyrene beads is 2 μm. Images were obtained by reflection differential interference microscopy.
Remarkably, aggregates on uniform surfaces spontaneously form large-scale structures in two distinct morphologies. Under the same conditions as those producing the crystalline state (Fig. 1d), a network of finite elongated patches or interconnected bands is simultaneously observed on large scales (Fig. 2a)1. In response to increasingly higher fields (≥0.04 V μm −1, at typically several kilo-hertz), the crystalline state gives way to a configuration composed of mutually repelling particle clusters. Both morphologies display a characteristic scale, Λ, which exceeds the particle diameter, D, by an order of magnitude and does not vary significantly when the electrode spacing (‘gap’), L, is varied in the range 5D ≤ L ≤ 40D. For the pattern of bands (Fig. 2a), Λ corresponds to the ‘mesh size’ whereas for the pattern of clusters (Fig. 2b), it corresponds to the lattice parameter of the ordered ‘superlattice’ formed by the cluster centroids. Small clusters assume a characteristically faceted shape which depends on the number, n of beads in the cluster (Fig. 2c). Furthermore, they reveal an intriguing property: the nearest-neighbour distance of beads in a cluster decays rapidly with n, attaining its ‘bulk’ value for n ≥ 7.
Figure 2.
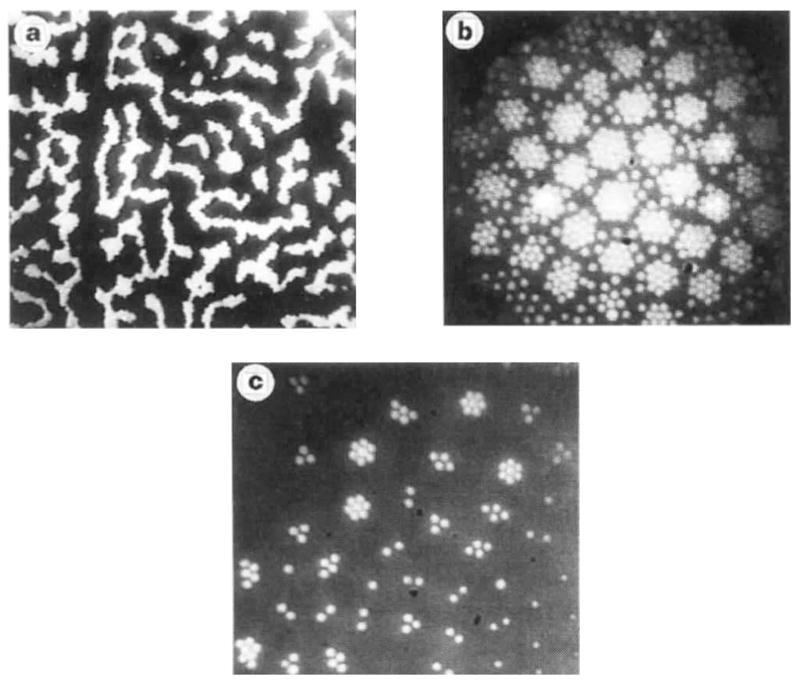
Large-scale morphologies displayed by colloidal aggregates on a uniform electrode, a, Network pattern of bands of (unresolved) beads observed under conditions favouring particle aggregation (see Fig. 1); the typical width of the bands corresponds to ~10 particle diameters, b, High-density (fluctuating) clusters, in a regime of large bead polarization (Vpp ≈ 0.2Vμm−1). c, Faceted clusters observed at low coverage in high a.c. fields (Vpp ≈ 0.1 V μm−1). The bead diameter is 2 μm; images were obtained by epifluorescence microscopy.
Similar patterns in the form of meandering stripes and circular domains have been observed in monomolecular films of certain amphiphiles5. The formation of macroscopic patterns in such Langmuir films is known to be governed by competing attractive and dipolar repulsive interactions whose balance sets the scale Λ (ref. 6). A standard lattice model of such systems with competing interactions reproduces the faceted shapes favoured by small clusters7.
As with Langmuir films, the repulsive interaction between beads in our colloidal arrays is likely to be dipolar. Specifically, dipoles appear as a result of the polarization of the bead double layer in the external field8,9. Direct evidence of a dipolar interaction is furnished by our observation of vertical strings of beads in high (~0.4 V μm−1, 1 MHz) fields. The same dipolar polarization would also account for the attraction of the beads to the electrode double layer, a region characterized by a high electric field. Importantly, this dielectrophoretic force would operate in the a.c. as well as in the d.c. regime.
We attribute the attractive interaction leading to clustering of beads in the plane of the electrode to electroosmotic flow, which can arise as a result of spatial perturbations in the lateral current distribution introduced by the colloidal beads themselves or by explicit electrode patterning.
To investigate the possible role of fluid flow in the formation of colloidal arrays1, small beads (1 μm) were employed as tracers to image the flow field associated with individual, large (20 μm) beads resting on the bottom electrode. The flow field is toroidal, with closed stream lines and with a radial component focused on the large bead (Fig. 3); typical velocities are estimated to be in the range of 1–10 μm s−1. Irrespective of the sign of the applied a.c. voltage, in-flow occurs predominantly along the electrode surface. Recirculation produces vertical fluid motion, but the large bead remains close to the electrode.
Figure 3.

Illustration of the mutual advection of beads in their respective flow fields. Pairs of forces acting along lines connecting pairs of particles are shown, along with the resultant force toward the centroid. Inset, sketch (in side view) of toroidal flow field, as observed in the vicinity of an individual bead.
The flow acts on an individual bead (of radius R) with a drag force, Fs ≈ 6πηRν, η and ν respectively denoting viscosity and fluid velocity. In the vertical direction, this force must be balanced by dielectrophoresis and (for large beads) gravity moving beads towards the electrode. In the plane of the electrode, the interaction of the flows associated with two adjacent beads can produce an attractive interaction. That is, a stationary ‘test’ bead positioned in the flow of another bead at a distance r would experience an attractive force due to drag. The flow field of each bead is approximately dipolar (Fig. 3), and we consequently expect the force to decay as r−3. Although we have not visualized the flow in a cluster of beads directly, our estimate suggests that the relevant Reynolds number is small, νρD/η ≪ 1, so that the velocity fields of individual beads will add linearly. As illustrated for a set of three beads in Fig. 3, the vectorial addition of the corresponding forces yields a resulting force directed toward the centroid of the set. Accordingly, we suggest that the drag forces generated by converging lateral flows close to the electrode are essential in producing the effective attraction which counterbalances the dipolar repulsion and leads to the formation of bead clusters.
To address the question as to how an applied d.c. or a.c. electric field generates the observed flow, we investigated the connection between field-induced flow and the local electrochemical properties of spatially patterned SiOx electrodes. In the example of Fig. 4, photolithography served to introduce a stripe pattern by etching a thermal oxide layer. We find that, on such topographically patterned electrodes, beads assemble in regions of lower oxide thickness and correspondingly higher local current density; initial observations (not shown) indicate that suitable illumination of the semiconductor electrode can produce similar effects. This observation is consistent with additional experiments on patterned SiOx in which we employed small tracer particles to facilitate the direct visualization of fluid flow to regions of high current density. These results point to variations in the spatial current distribution as a critical factor in producing flow.
Figure 4.
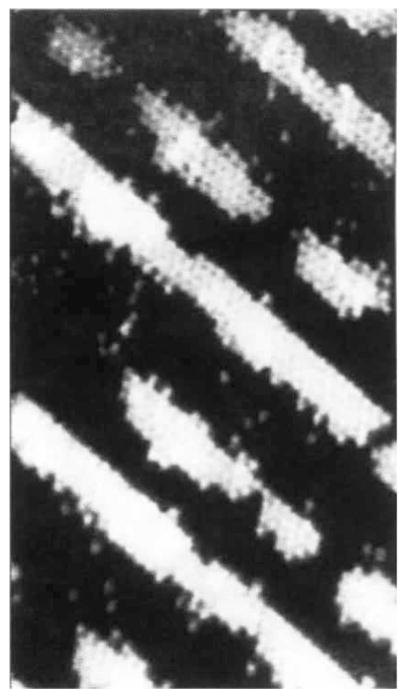
Effect of lithographic patterning of SiOx electrode. Crystalline arrays of beads, formed in response to an applied a.c. voltage, are confined to etched regions of the surface, characterized by thin oxide. Note that the inter-stripe spacing of the pattern is not constant across the field of view. The bead diameter is 1 μm. Images were obtained by epifluorescence microscopy.
We account for our observations by invoking a model based on electro-osmotic flow. As with electrokinetic phenomena in general, electro-osmotic flow originates in the action of an electric field on the double layer associated with a charged electrode surface immersed in an electrolyte8,9. In contrast to the standard geometry of planar electro-osmosis10, the applied field in our experiments is directed normal to the electrode surface. Nevertheless, any spatial modulation in the interfacial electrochemical potential suffices to generate lateral fluid flow. Specifically, a feature of transverse dimension R introduces a transverse variation, ∇⊥J ≈ J0/R in the (ionic) current distribution, J0. The corresponding potential gradient acts on mobile charges in the Debye layer of the electrode, and, as shown in our experiments with patterned surfaces, the resulting electro-osmotic flow is directed toward regions of high current density.
We derive an order-of-magnitude estimate of the fluid velocity as follows. For simplicity, we assume that within the electrode double-layer ionic current is carried by a single species of (excess) charge e and concentration n. The viscous balance governing the solvent flow within the Debye layer of the electrode is: η∇v − ∇p − en∇Φ = 0, v representing the fluid velocity, Φ the electric potential, and p the pressure. The electrochemical potential, μ = kTlogn + eΦ, determines the current, J = − (enD/kT)∇μ, so that we may express en∇Φ in the form en∇Φ = − (kT/eD)J − kT∇n. This substitution yields the balance equation η∇2v − ∇p̄; + (kT/eD)J = 0. The pressure with osmotic correction, p̄ ≡ p − kTn, is eliminated by taking a curl so that: η∇2∇ × v + (kT/eD)∇ × J = 0. The relevant vertical scale is set by the Debye length, lD, and we approximate and ∇ × J/e → ∇⊥Jz/e, yielding for the transverse fluid velocity the expression . With kT/ηD ≈ 4 nm, and a Debye length lD ≈ 300 Å, a value of 10mAcm−2 for the current density gives a velocity of ~7.5 μm s−1. Inspection of the balance equation shows that the fluid must flow in the direction of higher current density. Magnitude and direction of the fluid velocity are thus consistent with our flow decoration experiments.
We note several points. First, the velocity, ν, is determined by variations in the number current, J/e. Assuming a 1 : 1 electrolyte, it is therefore independent of the sign of the predominant charge carrier and independent of the direction of the applied field. Provided that experimental frequencies are low compared to the characteristic frequency, , the double layer recharges essentially instantaneously when the field is reversed. Second, our analysis suggests that the maximum velocity is attained in the limit R→ lD so that . Third, because the field-induced force acting on the fluid is confined to the electrode double layer, we expect the fluid velocity to attain is maximal value in the vicinity of the interface. That is what we observe.
Our model addresses the situation where the current is modulated directly, that is by patterning of the electrode surface. The presence of a bead near the electrode surface has an analogous effect: the bead obstructs the flow of current and introduces a dipolar enhancement in the current density surrounding the bead. In accordance with our argument, we expect lateral flow in the boundary layer converging towards the bead, as observed. The flow pattern associated with dense-packed bead arrays remains to be examined more carefully.
Acknowledgments
We thank R. Wong for advice on silicon processing. M.S. acknowledges helpful conversations with A. Ajdari and M. Trau.
References
- 1.Richetti F, Prost J, Barois PJ. Phys Lett. 1984;45:L1137–L1143. [Google Scholar]
- 2.Giersig M, Mulvaney P. Langmuir. 1993;9:3408–3413. [Google Scholar]; J Phys Chem. 1993;97:6334–6336. [Google Scholar]
- 3.Trau M, Saville DA, Aksay IA. Science. 1996;272:706–709. doi: 10.1126/science.272.5262.706. [DOI] [PubMed] [Google Scholar]
- 4.Seul M, Murray CA. Science. 1993;262:558–560. doi: 10.1126/science.262.5133.558. [DOI] [PubMed] [Google Scholar]
- 5.Seul M, Chen VS. Phys Rev Lett. 1993;70:1658–1661. doi: 10.1103/PhysRevLett.70.1658. [DOI] [PubMed] [Google Scholar]
- 6.Seul M, Andelman D. Science. 1995;267:476–484. doi: 10.1126/science.267.5197.476. [DOI] [PubMed] [Google Scholar]
- 7.Hurley MM, Singer SJ. J Phys Chem. 1992;96:1951–1956. [Google Scholar]
- 8.Dukhin SS, Derjaguin BV. In: Surface and Colloid Science Vol. 7. Matijević E, editor. Wiley; New York: 1974. [Google Scholar]
- 9.Russell WB, Saville DA, Schowalter WR. Colloidal Dispersions. Cambridge Univ. Press; 1989. [Google Scholar]
- 10.Anderson JL. Annu Rev Fluid Mech. 1989;21:61–99. [Google Scholar]