

Abstract
Gene silencing by heterochromatin is proposed to occur in part from the ability of HP1 proteins to spread across large regions of the genome, compact the underlying chromatin and recruit repressive activities1–3. Here we identify a new property of the human HP1α protein: the ability to form phase-separated droplets. While unmodified HP1α is soluble, either phosphorylation of its N-terminal extension or DNA binding promotes the formation of phase-separated droplets. Phosphorylation driven phase-separation can be promoted or reversed by specific HP1α ligands. Known components of heterochromatin such as nucleosomes and DNA preferentially partition into the HP1α droplets but other molecules such as the transcription factor TFIIB show no preference. Using single-molecule DNA curtains we find that unmodified and phosphorylated HP1α induce rapid compaction of DNA strands into puncta, though with different characteristics. We show by direct protein delivery into mammalian cells that an HP1α mutant incapable of phase separation in vitro forms smaller and fewer nuclear puncta than phosphorylated HP1α. These findings suggest that heterochromatin mediated gene silencing may occur in part through sequestration of compacted chromatin in phase-separated HP1 droplets, which are dissolved or formed by specific ligands based on nuclear context.
In humans three major HP1 paralogs have been identified, HP1α, β and γ. These paralogs contain a Chromodomain (CD) that binds the histone H3 lysine 9 methyl (H3K9me) mark, a Chromoshadow domain (CSD) that dimerizes and provides an interface for recruiting diverse ligand proteins, a Hinge (H) region connecting the CD and CSD, and unstructured N- and C-termini (Fig. 1a)2,4. HP1β and HP1γ show >90% percent conservation of sequence in their CD and CSD domains, yet perform functions quite different than HP1α5,6. While HP1α is commonly associated with silenced heterochromatic regions, HP1β and HP1γ play both gene silencing and gene activating roles7. A plausible hypothesis is that the less conserved and less structured regions (Hinge, N- and C-termini) are responsible for the unique properties of the different HP1 proteins8–11. Recent work has shown that phosphorylation of the N-terminal extension of human HP1α (Fig. 1a, NTE) is important for formation of heterochromatin foci in cells12. The corresponding phosphorylation sites are absent in HP1β and HP1γ13. NTE phosphorylation increases affinity for an H3K9 trimethylated tail peptide and enhances specificity for the H3K9 trimethyl mark within nucleosomes5. To investigate if NTE phosphorylation has additional effects on HP1α, we generated different types of phosphorylated HP1α proteins as described previously (Fig. 1a)12. Phosphorylation was validated by mass-spectrometry and H3K9me3 peptide binding (Extended Data Figs. 1 & 7d)5,12. To separate the effects of phosphorylation on either the NTE or the hinge, which also gets phosphorylated in vivo, we generated two mutants of HP1α (Fig 1a, nPhos-HP1α& hPhos-HP1α).
Figure 1.
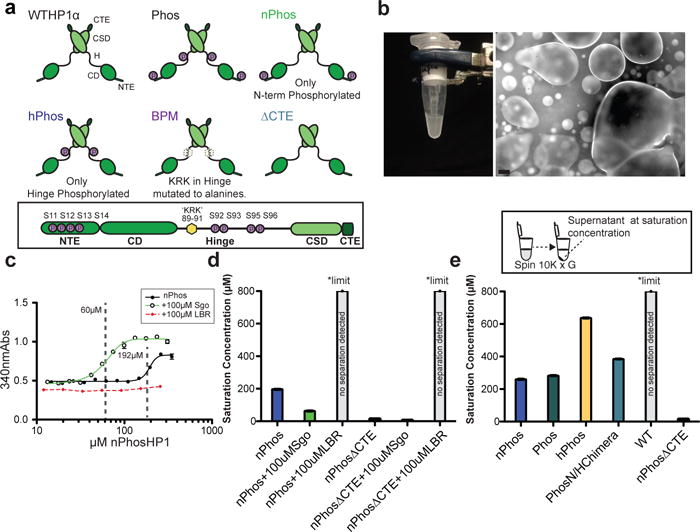
Phase separation by HP1α. a, Schematics of HP1α mutants. CTE-C-Terminal Extension, CSD-ChromoShadowDomain, H-Hinge, CD-ChromoDomain, NTE-N-Terminal Extension. b, Left panel: Phase separation of nPhos-HP1αat 4°C, 75 mM KCl, 20 mM HEPES pH 7.2. Right panel: Micrograph of phase separated nPhos-HP1α taken at 10×. Scale bar is 50 μm. c, Turbidity assay using a sigmoid function to measure saturation concentration. Dotted vertical lines indicate calculated saturation concentration. d, Saturation concentrations for nPhos-HP1α and nPhos-ΔCTE-HP1α with and without Sgo or LBR peptides. e, Saturation concentrations of different HP1α proteins using spin-down assay (inset). Measurements entailed three independent experiments (n=3), error bars reflect standard error of the mean (s.e.m).
While working with nPhos-HP1α we observed the formation of a turbid solution upon cooling the protein on ice (Fig. 1b, left panel). The turbid solution became clear upon raising the temperature or upon treatment with alkaline phosphatase (SI videos a and d). Investigation of the turbid material under a microscope revealed liquid droplets (Fig. 1b, right panel, SI video b). Together, these observations are indicative of phase separation, a characteristic of proteins with intrinsically disordered regions and the capacity for multi-valency14,15. Indeed the NTE, Hinge, and CTE regions contain sequences with a high propensity for intrinsic disorder16. Unlike nPhos-HP1α, wild-type HP1α did not phase separate upon cooling. We quantified the saturation concentration for phase separation using two independent methods at room temperature (~22–24°C) (see Figs. 1c&1e, & Methods). This is the concentration at which the HP1α solution will appear as two separate phases. The nPhos-HP1α, Phos-HP1α and hPhos-HP1α proteins had saturation concentrations in increasing order while WT HP1α, HP1β, and HP1γ did not show detectable phase separation at the highest concentration tested (Fig. 1e and Extended Data Fig. 2). Replacing the NTE serines in HP1α with glutamates (nE-HP1α) did not cause any phase separation (Extended Data Fig. 2).
Given that phase-separation is associated with multi-valent interactions, we investigated if nPhos-HP1α forms higher order oligomers. We found that nPhos-HP1α does form higher order oligomers beyond a dimer (Fig. 2a and Extended Data Fig. 3a&b) in contrast to WT HP1α and HP1β, which do not show detectable higher-order oligomerization. Overall HP1 proteins that were competent for phase-separation displayed higher-order oligomerization, while those that did not phase-separate appeared incapable of higher-order oligomerization (Fig. 2a and Extended Data Fig. 3a&b). These data suggest that phase separation depends on inter-dimer contacts. Pairwise distance measurements using SAXS (Small Angle X-ray Scattering) indicated that nPhos-HP1α is substantially more elongated molecule than WT HP1α (Dmax ~220 Å vs. 130 Å, respectively, Fig. 2b). The extended conformation upon phosphorylation was further supported by SEC-MALS (Size Exclusion Chromatography-Multi Angle Light Scattering) studies (Extended Data Fig 6a).
Figure 2.
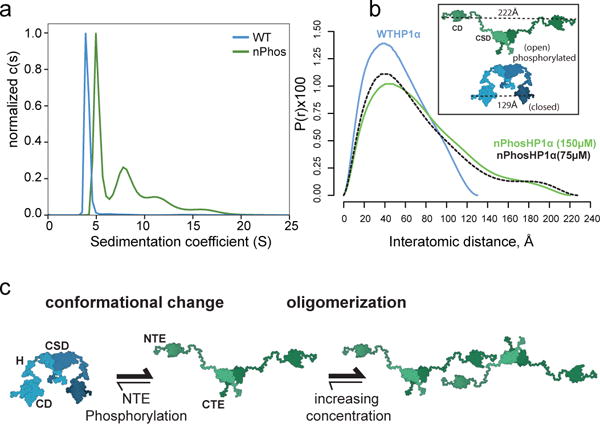
NTE Phosphorylation promotes HP1α oligomerization and conformational change. a, Sedimentation Velocity AUC analysis of 300 μM WT HP1α and nPhos-HP1α. b, P(r) distributions of WT HP1αand nPhos-HP1α obtained SAXS. A 2-fold dilution (green solid vs. black dashed lines) does not significantly change the Dmax for nPhos-HP1α suggesting data reports predominantly on dimeric state (Extended Data Fig. 5). Inset: models describing two possible conformations for the HP1α dimer generated as described in Methods. c, Model for how HP1α switches between a compact and extended state: the N-terminal phosphates interact with basic hinge residues to stabilize inter-dimer contacts in the extended state and promote higher-order oligomerization. Traces from three independent experiments shown in a and b (n=3).
We hypothesized that the extended conformation exposes positively charged hinge residues, allowing the phosphorylated NTE in one dimer to interact with hinge residues in another dimer (Fig. 2c). To test this possibility, we mutated a conserved basic patch in the hinge to alanines (residues 89–91, basic patch mutant) (Fig. 1a, Phosbpm-HP1α). Phosbpm-HP1α was defective for both phosphorylation driven oligomerization and phase-separation (Extended Data Figs. 2a, 3a&c). Further, amongst various chimeras of HP1β and HP1α that we generated, only the chimera that has both the hinge and phosphorylated NTE of HP1α swapped into HP1β formed higher-order oligomers (Extended Data Fig. 3d, PhosNH-α/βchimera). These results suggest that sequence features of both the hinge and NTE that are specific to HP1α are required for oligomerization.
To identify HP1α regions that help stabilize the compact conformation of WT HP1α we performed cross-linking by BS3 (bis(sulfosuccinimidyl)suberate) followed by mass spectrometry (Extended Data Fig. 1d). We found several putative inter-HP1α cross-links between the CTE and the hinge (21 out of 74, supplemental table). Deleting the 14 aa CTE in the context of NTE phosphorylation (nPhosΔCTE-HP1α) lowers the saturation concentration by ~10 fold compared to nPhos-HP1α (Fig. 1d&e). These results suggest that interactions between the CTE and the hinge stabilize the HP1α dimer in a compact auto-inhibited state that cannot make multivalent interactions (Fig. 2c). We therefore hypothesized that ligands which bind the CSD-CSD interface might alter the equilibrium between the closed and open states of nPhos-HP1α regulating the ability of the CTE to stabilize the compact state. The Shugoshin 1 (Sgo1) and the lamin B receptor (LBR) proteins have been shown to directly interact with the CSD dimer of HP1α via a specific PxxVxl-like sequence in Shugoshin, and a different sequence in LBR1,3. We therefore investigated the effects of these sequences as peptides on the phase separation properties of nPhos-HP1α.
Consistent with previous work, both peptides bind specifically to the CSD-CSD dimer (Extended Data Fig. 7a&b)1,17. Interestingly the Sgo peptide promoted phase separation, lowering the saturation concentration by ~3-fold when added at a concentration of 100 μM (Figs. 1d&e, video in SI video c). The Sgo peptide also promoted nPhos-HP1α oligomerization (Extended Data Fig. 7c). In contrast, addition of the LBR peptide inhibited phase separation (Fig. 1c&d) and did not promote nPhos-HP1α oligomerization (Extended Data Fig. 7c). H3K9 methylated and unmethyated tail peptides and equivalent concentrations of spermine also promoted phase-separation (Extended Data Fig. 8a). As the H3 tail peptide is rich in lysines and arginines, these results suggest that in addition to specific ligands such as the Sgo peptide, which directly regulate HP1α oligomerization, other molecules can contribute to phase separation though general electrostatic effects (Extended Data Fig. 8).
In the model in Figure 2c, the phosphates on the NTE make bridging interactions with the hinge region of a neighboring dimer. The hinge also binds DNA in the context of HP1α and HP1β5. We therefore wondered if DNA could bridge adjacent HP1 molecules and through its inherent multi-valency promote phase-separation. Saturating concentrations of DNA resulted in droplet formation by WT HP1α but surprisingly did not cause droplet formation with HP1β (Fig. 3a). Mutating the basic patch in the HP1α hinge that is proposed to interact with DNA eliminated droplet formation (Fig. 3a). To better understand this phenomenon we used a DNA curtain assay and total internal reflection fluorescence microscopy (TIRFM) to visualize the effects of HP1 on λ-DNA substrates (Figs. 3b&c) via the fluorescent dye YOYO-1, which intercalates into DNA4.
Figure 3.
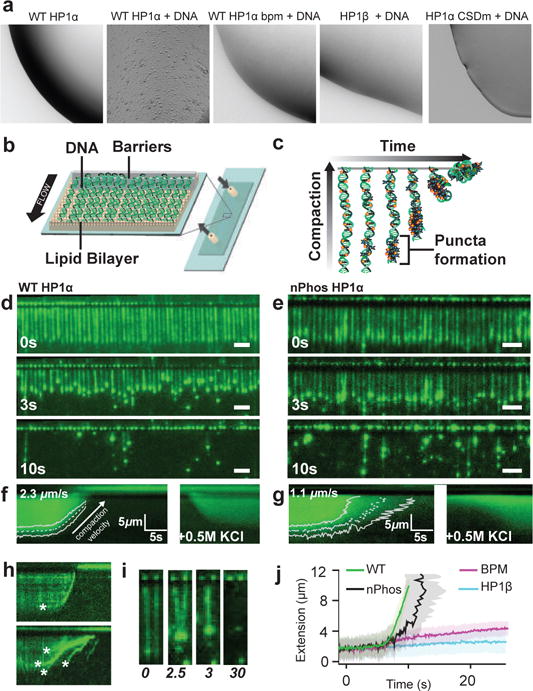
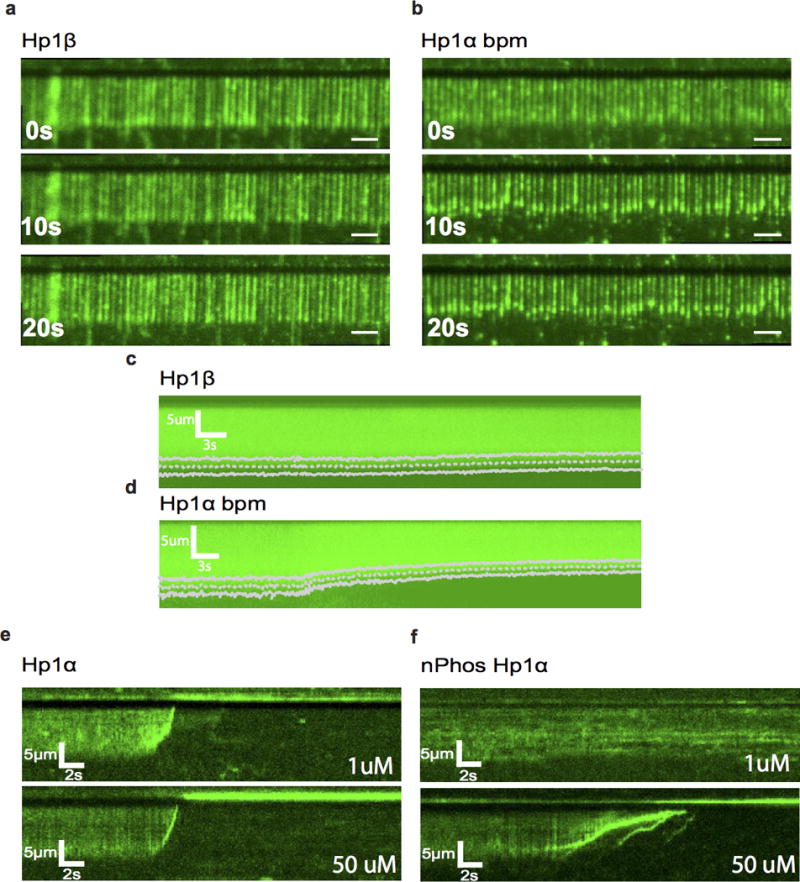
Consequences of interactions with DNA. a, DNA binding causes droplet formation with WT HP1α but not HP1β. Mutating HP1α hinge residues (bpm) or disrupting CSD dimer (CSDm) inhibits DNA-driven phase separation. b, Schematic of DNA curtains. A fluid lipid bilayer in the flow cell allows diffusion of tethered DNA strands to nanofabricated barriers with buffer flow (black arrow indicates direction) c, Cartoon of DNA compaction assay. DNA labeled with intercalating dye YOYO (yellow stars) is compacted (vertical arrow) over time (horizontal arrow) with the addition of HP1α. Wide-field TIRF microscopy images of DNA compaction by d, WT-HP1α and e nPhos-HP1α at different time points, scale bars are 5 μm. Average kymograms for f, WT-HP1α (N = 422) and g nPhos-HP1 α (N = 371) overlayed with fits for average compaction speed (dashed line) and standard deviation (solid lines). h, Individual kymograms showing compaction by WT HP1α (top) and nPhos-HP1α (bottom). i, four panels showing time-course of DNA compaction by WT HP1α in trans, time at bottom in seconds. Asterisks indicate formation of individual puncta. j, Overlayed trajectories of DNA compaction by HP1α (WT, nPhos, and BPM) and HP1β.
The action of WT HP1α on DNA appears to be cooperative as suggested by the emergence of fluorescent puncta, a result of local compaction leading to higher local concentrations of YOYO-1 labeled DNA (Figs. 3c,d&e). A non-cooperative mechanism would manifest as a global increase in fluorescence during compaction. Typically, for WT HP1α, a single puncta appears, followed by rapid [vav = 2.25 μm/s +/− 0.026, (SEM)] compaction of the rest of the 48.5 kbp (~12 μm) λ-DNA molecule without increased fluorescence outside the puncta (Figs. 3d&f and SI video g). This compaction appears largely driven by electrostatic interactions, as increasing monovalent salts reverses compaction (Fig. 3f&g). In contrast, YOYO-1 intensity was less localized and DNA strands often exhibited multiple fluorescent puncta during initial DNA binding and compaction by nPhos-HP1α (Fig. 3e,g&h), suggesting that cooperative binding to the DNA is disturbed by phosphorylation of HP1α. Further, WT HP1α was able to compact DNA at much lower concentrations (Extended Data Fig. 9e). Finally, while nPhos-HP1α was able to completely compact λ-DNA, it compacted the DNA at a slower rate [1.1 μm/s +/− 0.15, (SEM)] with much more variation than WT HP1α (Figs. 3f,g&h).
In some instances, inter-strand DNA interactions were clearly visible indicating bridging across μm scales (Fig. 3i). Such linking would require, at a minimum, mesoscale protein-DNA networks consisting of ~100 individual WT-HP1α dimers. Thus the energetics of phase separation could play a crucial role in the dynamics of DNA binding, compaction, and organization, without the formation of macroscopic droplets. Interestingly, despite containing several positively charged residues in its hinge, HP1β was unable to compact DNA or produce puncta (Figure 3j and Extended Data Fig. 9a&c), consistent with the inability of HP1β to form droplets with DNA (Fig. 3a). The DNA compaction behavior of bpm-HP1α was severely attentuated (Figure 3j and Extended Data 9b&d), indicating that, like the ability to phase separate and bind DNA, DNA compaction by HP1α involves this basic patch in the hinge.
Based on these data, we propose that phosphorylation and DNA binding play related roles. In this model, the NTE phosphates in one dimer make electrostatic interactions with basic residues in the hinge of another dimer resulting in (i) relief of CTE mediated auto-inhibition and (ii) exposure of specific residues for making higher-order interactions (Figs. 2c and Extended Figure 8c). Binding of DNA to the hinge could analogously displace the CTE in WT HP1α thereby exposing new interaction surfaces. In addition, binding of multiple WT HP1α molecules to DNA could increase the local concentration of WT HP1α, possibly further promoting higher-order HP1α interactions and droplet formation. Alternatively, bridging of two regions of DNA by one WT HP1α dimer could locally alter DNA conformation in a manner that promotes the binding of additional WT HP1α dimers, without higher-order oligomerization. Our model also implies that NTE phosphorylation should compete with DNA binding and helps explain why DNA compaction by nPhos-HP1α is less cooperative and slower compared to that observed with WT HP1α (Extended Figure 8c). Consistent with such competition, previous work has shown that NTE phosphorylation of HP1α reduces DNA binding5.
We next investigated how known nuclear components interact with phase-separated HP1α. We used Cy3 labeled components to visualize and measure their partitioning into nPhos-HP1α droplets (Fig. 4a). Core nucleosomes, 147bp dsDNA and Aurora B kinase, a known interaction partner of HP1α, all localized within the droplets. H3K9 trimethylated twelve nucleosome arrays labeled with YOYO-1 were also readily incorporated into nPhos-HP1α droplets. In contrast, reduced Cy3 maleimide dye and Cy3 labeled bacterial Hsp90 appeared to be excluded from the nPhos-HP1α droplets (Fig. 4a). A spin down assay gave qualitatively similar results (Extended Figure 8b). Using this assay we also found that a core transcription factor, TFIIB, was neither enriched in nor excluded from the HP1α phase. These results imply that macromolecules that interact with HP1α can remain solvated in the HP1α dominated phase, while others are either excluded or partition according to volume.
Figure 4.
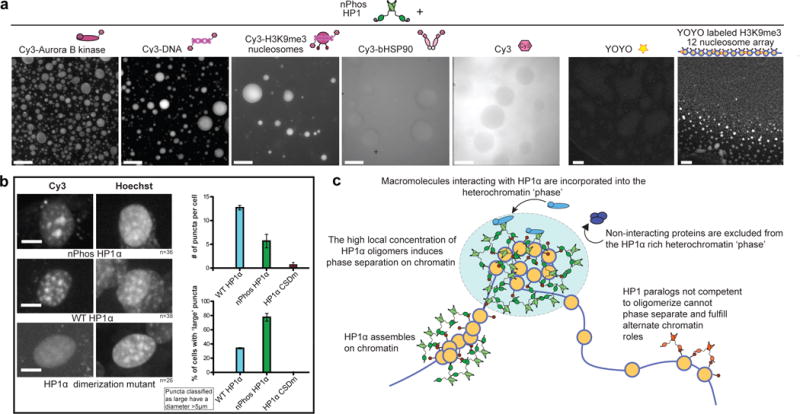
Partitioning of specific macromolecules into HP1α phase and behavior of HP1α molecules in cells. a, Micrographs of phase separated nPhos-HP1α droplets with either Cy3 labeled or YOYO labeled macro-molecules visualized using Cy3 fluorescence or YOYO fluorescence, respectively. For each panel a representative micrograph is shown from three independent experiments. Scale bar is 50 μm. b, NIH3T3 cells transduced with Cy3 labeled HP1 proteins and classification of puncta distribution. Right, top plot: average number of distinct puncta per cell. Right, bottom plot: percentage of cells that have at least one large puncta. A large puncta is defined as having a diameter > 5μm in any direction within XY dimension of a Z projection. Scale bar is 10 μm. Error bars represent standard error of the mean. nPhos-HP1α (N=36), WT-HP1 α(N=38), and CSDm-HP1α(N=26). c, Model for the role of regulated phase separation in chromatin organization.
The results in Fig. 4a raised the possibility that phase-separation helps compartmentalize heterochromatin components in cells. We therefore investigated how the phase-separation behavior of HP1α correlates with its localization within the nucleus. We directly delivered chemically labeled HP1 proteins into NIH3T3 cells using the Chariot delivery system18. We used direct protein delivery to ensure high levels of NTE phosphorylation and because genetically encoded GFP-tags inhibit phosphorylation driven phase separation in vitro (Extended Data Fig. 2). We labeled the HP1 proteins with Cy3 using a small C-terminal ‘KCK’ tag, which is permissive for phase separation (Extended Data Fig. 2). After 90 minutes, large (>5 μm) were observed in a higher proportion of cells with nPhos-HP1α compared to WT HP1α, while the average number of puncta were fewer for nPhos-HP1α vs. WT HP1α. These results are consistent with the higher oligomerization and multivalency of nPhos-HP1α vs. WT HP1α (Fig. 4b). An HP1α mutant that is defective in dimerization and DNA driven phase-separation, CSDm-HP1α, displayed substantially more diffuse localization (Fig. 4b).
Spreading of heterochromatin has been proposed to arise in part from oligomerization of HP1 proteins on H3K9 methylated chromatin8. Work with the S.pombe HP1 protein, Swi6, has demonstrated such higher-order oligomerization and its importance for silencing in vivo19. To date however, higher-order oligomerization of human HP1 proteins has not been reported20,21. Instead, previous work suggests that dimers of HP1α and HP1β bridge nucleosomes and compact chromatin20,22,23. Here we show that higher-order oligomerization of HP1α can be promoted by NTE phosphorylation (Fig. 2a) and further that higher-order oligomerization is strongly correlated with phase-separation. Simple calculations assuming one phosphorylated HP1α dimer bound per nucleosome give the local concentration of HP1α on extended chromatin with 20 bp DNA linkers as > 100 μM, comparable to the saturation concentrations measured in this study. Ligands such as Shugoshin and LBR can further increase or decrease the saturation concentration. Thus depending on nuclear context, heterochromatin could exist in a more permissive soluble state or a less permissive phase-separated state. In addition, the two different drivers of phase-separation, DNA binding and NTE phosphorylation, could provide qualitatively different means of regulating heterochromatin. For example, phase-separation coupled to DNA binding may be utilized when rapid chromatin compaction is needed. Notably, WT HP1α compacts λ-phage DNA at rates ~15 times faster than its own capsid packaging motor, though against smaller forces (Fig. 3)24. In contrast, NTE phosphorylation may provide a means to regulate the size of heterochromatin bodies because phosphorylation enables large-scale assemblies without DNA binding.
Substantial work has been carried out on non-membrane bound cellular bodies such as the nucleolus and P granules15,25. It has been speculated that chromatin organization may also entail phase-separation mechanisms26,27. Our findings provide experimental evidence for such a possibility. A role for phase-separation in HP1 heterochromatin is also suggested by work in Drosophila28. Most simply, phase-separated HP1α droplets allow the means to physically sequester and compact chromatin while enabling recruitment of repressive factors (Fig. 4c). However many fundamental questions remain: what is the nature of the physicochemical environment within phase-separated heterochromatin; how do other heterochromatin components alter this environment; and is a predominant HP1α conformation maintained in the phase-separated state? Building on the approaches used to study other phase-separated cellular bodies will provide powerful ways to address these questions15,25.
METHODS
Protein Purification
Full length human HP1α was cloned into a pBH4 expression vector, mutants were made using site-directed mutagenesis following the fastcloning protocol and proteins were purified from E. coli.28 Phosphorylated HP1 was obtained by coexpression with the catalytic subunits of CKII in a pRSF-Duet vector. HP1 proteins were purified from E. coli Rosetta (DE3) strains as follows. Cells were grown to OD .4 at 30°C in 2XLB with 50 μg/mL Carbenecillin and 25 μg/mL Chloramphenicol. For coexpression with the pRSFduet CKII plasmid, 25 μg/mL Kanamycin was added. Cells were then grown to OD .8 at 18°C and induced with .3 mM Isopropy-β-D-thiogalactopyranoside for 14 hours. Harvested cells were resuspended in lysis buffer (1XPBS pH 7.2, 300 mM NaCl, 10% glycerol, 7.5 mM Imidazole, and protease inhibitors phenylmethanesulfonyl fluoride, Pepstatin A, Aprotinin, and Leupeptin). Following lysis in an C3 Emulsiflex(Avestin), cell debris was removed by centrifugation at 25,000g for 35 minutes. Clarified lysate was incubated with Cobalt-NTA affinity resin (Clontech) for 40 minutes at 4°C. Resin was then washed with ~50 mLs of lysis buffer and eluted with 20 mM HEPES pH 7.2, 150 mM KCl, and 400 mM Imidizole. Proteins were cleaved overnight with 3 mg/mL TEV protease while dialyzing into 20 mM HEPES pH 7.2, 150 mM KCl, 3 mM DTT to remove imidazole. Protein was then injected on a Mono-Q 4.6/100 PE anion exchange column (GE), washed, and eluted with a 120–800 mM KCl gradient over 15 column volumes. Protein was then concentrated in an Amicon Ultracel-10K spin concentrator before injection on a Superdex-75 16/60 size exclusion column run with storage buffer (20 mM HEPES pH 7.2, 200 mM KCl, 1 mM DTT, 10% glycerol). Proteins were concentrated to ~1 mM in Amicon concentrators before flash freezing in LN2. Concentrations were measured by UV absorbance at 280 nM and using the calculated extinction coefficient ε=29,495. Removal of the 14 aa CTE in the context of unphosphorylated HP1α (ΔCTE-HP1) leads to rapid degradation and an unstable protein. However co-expression of ΔCTE HP1α with CKII stabilizes the protein (nPhos ΔCTE-HP1α). The nPhos ΔCTE-HP1α protein was concentrated by dialysis against 35000 polyethylene glycol at 25°C due to its propensity to form hydrogels during spin concentration. WT and phosphorylated proteins were subsequently concentrated in this manner to ensure no artifacts were observed by AUC.
Human TFIIB and Aurora B DNA sequences were ordered in gBlocks from IDT and cloned into the pBH4 vector. Proteins were purified similar as described above, though a Mono-S cation exchange column was used in place of the Mono-Q.
The nPhos-HP1α mutant has serine residues in the hinge mutated to alanines, such that it can only be phosphorylated in the NTE. In contrast, the hPhos-HP1α mutant has serine residues of the NTE mutated to alanines such that it can only be phosphorylated in the hinge.
Sedimentation Velocity Analytical Ultracentrifugation
Proteins were dialyzed into HEPES 7.2, 75 mM KCl, and 1 mM DTT overnight at 4°C. Concentrations were checked by UV absorbance at 280 nM. The samples were incubated at the appropriate temperature for 50 minutes in a pre-equilibrated rotor under vacuum. Runs were performed at 50K rpm for 8–10 hours in a Beckman XL/A analytical ultracentrifuge. Scans were collected at 250 or 280 nm with a radial step size of 0.003 cm at approximately 60-second intervals. Runs were completed in triplicate to ensure no experimental artifacts were incorporated into the analysis. SV analysis was done with SEDFIT/SEDPHAT(NIH) software and plots were generated using GUSSI.29,30 Experimental Parameters were calculated using the Sednterp software and were as follows: HP1α vbar-.72820, HP1β vbar-.72794, buffer density-1.002, buffer viscocity-.0089. Attempts to assess the oligomerization properties of nPhosΔCTE-HP1α were inconclusive as the lowest concentrations of nPhosΔCTE-HP1α that are detectable by AUC displayed substantial phase-separation.
SEC-MALS
Proteins were injected on a Shodex KW-803 column at 25°C. Buffer was 20 mM HEPES pH 7.2 and 75 mM KCl with 1 mM DTT. Samples were run again at pH 6.8 to exclude possible influence of column interaction on elution volume. BSA standard was run previous to injections for internal calibration.
SAXS measurement and analysis
All samples were dialyzed prior to measurement to obtain a matching buffer. SAXS experiments were done using an in-house instrument (Anton Paar SAXSESS MC2) with line-collimated illumination. Buffer subtracted data were inspected for aggregation using Guinier plot. Further data processing was done using custom software written in Python & Fortran90 using the NumPy, SciPy, Matplotlib and PyQtGraph libraries (UCSFsaxs, code available at https://github.com/delnatan/UCSFsaxs). The software implements a bayesian algorithm for determining the optimal maximum particle diameter and smoothing factor to fit the scattering data to a pairwise interatomic distance distribution, P(r)31. This was done by solving a regularized least squares equation (in matrix form, matrices are bolded):
Where J is the least-squares objective function, and x is the P(r) to be solved. b is the scattering intensity vector. L is a banded matrix that approximates second-order derivative. Alpha is the smoothing factor that balances data overfitting and smoothness of the P(r). Matrix Z consists of zeros everywhere except on the first and last element, which is set to 1. Matrix Z penalizes nonzero values for the end-point of the P(r) with an arbitrarily large value, beta (which is set to be 100 times alpha). This optimization was done using the Non-Negative Least Squares (NNLS) routine from SciPy.Optimize.
Models in Figure 2b (inset) were generated using the ensemble optimization method from SAXS envelopes and two crystalized HP1 domains CSD(3Q6S) and CD(3FDT), and the structures represent two possible conformations for the HP1α dimer.32,33
Cross-linking Mass-Spectrometry and Phosphopeptide Analysis
WT HP1α was cross-linked with 1 mM BS3 for 5 min, at room temperature and quenched by addition of 10 mM Tris base. Samples were resolved by SDS-PAGE using precast 4–20% Bis-Tris gels and stained by Coomassie. Gel bands corresponding to monomeric and dimeric HP1α were excised and trypsin digested34. Extracted peptides were desalted and analyzed on an Orbitrap Velos (Thermo Scientific) mass spectrometer coupled with a nanoelectrospray ion source and NanoAcquity UPLC system (Waters). Peptides were separated on a 15 cm × 75 μm ID PepMap C18 column (Thermo) using a 60-minute gradient from 3–28% acetonitrile containing 0.1% formic acid. Precursor MS scans were measured in the Orbitrap analyzer scanning from 350–1800 m/z (mass resolution: 30,000). The six most intense triply charged or higher precursors were isolated in the linear ion trap (isolation window: 4 m/z), dissociated by HCD (normalized collision energy: 30), and the product ion spectra were measured in the Orbitrap (mass resolution: 7,500). A 30 sec dynamic exclusion window was applied. Three technical replicates were analyzed per condition.
Peaklists were generated using Proteome Discoverer (Thermo) and searched using Protein Prospector 5.14.2035. An initial unbiased search of the data against SwissProt (535248 entries from March 21, 2012) showed the sample to consist of predominantly human HP1α by spectral counts (> 90%). Subsequent searches for cross-linked peptides were restricted to the sequence of human HP1α and the next 15 most abundant proteins which consisted of minor contaminants from E coli as well as residual TEV protease. Additionally, randomized versions of these proteins were included in the search database for false discovery rate analysis (FDR). Cross-linking searches were performed against the 85 most intense product ion peaks with the following parameters: enzyme specificity: tryptic, 3-missed cleavages; mass tolerance: 8 ppm (precursor), 25 ppm (product); cross-linking reagent: DSS/BS3; variable modifications: phosphorylation at Ser/Thr/Tyr, oxidation at Met, N-terminal Glu to pyroGlu conversion, loss of Met and/or acetylation at the protein N-terminus, dead-end modification of Lys by semi-hydrolyzed BS3; constant modification: carbamidomethylation of Cys. Cross-linked peptides were reported with a Prospector score greater than 20 and score difference greater than 6.5 corresponding to an FDR below 1%. Inter-molecular HP1α cross-links were putatively assigned by taking the set of cross-linked residue pairs uniquely identified in the dimer gel bands when compared to the corresponding monomer bands.
Phosphopeptide analysis of N-term phosphorylated HP1α was performed on a Q-Exactive Plus Orbitrap instrument (Thermo) from in-solution trypsinized sample. Peptides were analyzed directly (without phospho-enrichment). Three technical replicates were run, and phosphopeptides were searched for as variable modifications on Ser and Thr residues using Protein Prospector.
Native-MS
Native mass spectrometry was carried out using the Exactive Plus EMR instrument (Thermo Scientific, San Jose, CA, Lu et al., 2015) that was externally calibrated using a 5 mg/mL CsI solution prepared in water. Prior to analysis, the protein samples were buffer-exchanged into 150 mM ammonium acetate, pH 7.5 using MicroBiospin-6 columns (Bio-Rad, Hercules, CA) that had been pre-equilibrated in the same buffer. Protein samples were introduced into the mass spectrometer using offline Au/Pd-coated borosilicate emitters (NanoES Spray Capillaries, Medium, ES380, Thermo Scientific) at a flow rate of 10–40 nL/min. Spectra were acquired over the range m/z 500 – 20,000 in positive ion mode, were averaged, and then exported for deconvolution and subsequent generation of the zero-charge mass values using PeakSeeker and Unidec36,37. Samples were analyzed with the following experimental parameters: spray voltage (0.8 – 1.5 kV), injection flatapole = 5; inter flatapole lens = 5; bent flatapole = 5; transfer multipole = 2; C-trap entrance lens = 2, source DC offset (25 V), fragmentation energies (CE = 25 and CID = 65), injection times (200 μsec), trapping gas pressure (7.5), resolution (17,500 arbitrary units), capillary temperature (250 °C), S-len RF levels (200 V), microscans (10), and AGC (1e6).
Saturation concentration measurements
These experiments were carried out at room temperature (~22–24°C) in a buffer containing 75 mM KCl, 20mM HEPES pH 7.2, and 1 mM DTT.
Centrifugal spin-down assay
In this method we spun the phase separated material at 10,000g, which created a two phase solution, with the low concentration phase existing in the top layer and the high concentration HP1α phase existing at the bottom of the tube (Fig. 1e). The concentration of HP1α in the top layer was measured to obtain the saturation concentration of phase separation. 10 μL samples were incubated at the appropriate temperature for 5 minutes then spun at 10,000×G for 5 minutes in a tabletop centrifuge. 4 μL of supernatant was removed for A280 measurements in triplicate on a nanodrop instrument. Pipetting or vortexing returned the sample to a turbid solution (SI video f).
Turbidity method
This assay measures the turbidity of the phase-separated solution by absorbance at 340 nm (Fig. 1c). In this method, the saturation concentration was defined by the concentration at which the turbidity was at a half maximal value. Serial dilutions were performed in 12 tube PCR strips. 20 μL of sample was then added to a clear bottom 384 well plate (Corning) and absorbance was read at 340 nm in a Spectramax M5 plate reader. For peptide addition, 1 μL of peptide at the appropriate concentration was added, mixed, and incubated for 5 minutes before reading.
Microscopy
Microscopy of the droplets was done on a Leica Axiovert 200M microscope using a 10× or 40× air objective. For Cy3 detection samples were excited with a 520 nm laser and a 560±20 nm emission filter. A custom nitrogen chamber was used for cooling experiments to eliminate condensation. Imaging of YOYO labeled arrays and NIH3T3 cells was performed on a Nikon Eclipse confocal microscope through an Andor Zyla 4.2 cMOS camera. Image analysis was done in ImageJ and Python. For images of droplets, images were background corrected by dividing by a blank image to remove apparent spots on the objective. Micrographs of nPhos-HP1α and H3K9me3 12 nucleosome arrays were labeled with YOYO dye and visualized using a 488 laser.
Protein labeling
A ‘GSKCK’ peptide tag inserting a labile cysteine was cloned in C-terminal to the sequence of HP1. Cysteine 133 was mutated to a serine to favor C-term labeling. Proteins were dialyzed into labeling buffer (20 mM HEPES pH 7.2, 350 mM KCl, .5 mM TCEP) and concentration adjusted to 200 μM. A 1:1 molar ratio of Cy3 maleimide to HP1 was added to 100 μL of protein, mixed, and then quenched with an excess of β-mercaptoethanol after 5 seconds. Free dye was separated from labeled protein using illustra G-50 columns. All proteins were determined to be 40–45% labeled with Cy3 as determined by Cy3 dye absorption and A280 measurements, using 150,000M−1cm−1 at 552 nm for Cy3 and 29,495 M−1cm−1 at 280 nm for HP1α.
Cell Culture and imaging
NIH/3T3 cells (CRL-1658) were ordered from ATCC. Cells were grown in DMEM H-21 media supplemented with 10% bovine calf serum at 37°C and 5% CO2. ~10,000 cells were plated on a glass bottom Corning Cyclic Olefin 96 well plate in a total volume of a 100 μL and grown to confluence overnight .3 μg of total labeled protein was quantified using a nanodrop instrument and transduced with the Chariot carrier peptide system. Chariot (Active Motif, CA) is a non-cytotoxic agent and efficiently delivers proteins into nuclei. Cells were washed once with PBS and fixed with 4% paraformaldehyde after 90 minutes. Fixing solution was removed after a further 15 minutes and replaced with 1 μg/ml Hoechst 33342 in PBS. Live imaging experiments confirmed no artifacts in nuclear structure were obtained during fixation. Cells were then visualized on a Nikon Ti eclipse confocal microscope. Cells with Cy3 signal in the nucleus were imaged with a 40× objective using 16 μm Z-stacks taken with .5 μm step size. Cells appearing dead or dividing by Hoechst staining were excluded. Cells were transduced in duplicate on different wells for technical replicates, and transduced on separate passages of cells for experimental replicates.
Nucleosome Array Construction
A protocol from previous work was modified.38 Reconstituted 12-mer arrays were assembled using DNA templates and Xenopus histones in the presence of carrier DNA to ensure proper loading. Carrier DNA was digested from the pUC19 vector backbone by DraI and PAGE purified. Array DNA was digested from the pUC57 backbone plasmid using EcoRV and PAGE purified. Dialysis from 2-.2 M NaCl was performed to assemble histone octomers on DNA. A sample of the reconstituted array was digested with HpaI and run on a native 5% polyacrylamide gel to ensure proper assembly. The arrays were then purified on a 5–25% sucrose gradient. Samples were spun at 35,000 rpm at 4°C for 8h in a Beckman Ti-55 rotor. After centrifugation, samples were collected and analyzed by digestion on a polyacrylamide gel. Samples were pooled, concentrated, and stored at −80°C.
Constructs
-
1HIS-TEV-HP1 α :
- MGHHHHHHDYDIPTTENLYFQGSGKKTKRTADSSSSEDEEEYVVEKVLDRRVVKGQVEYLLKWKGFSEEHNTWEPEKNLDCPELISEFMKKYKKMKEGENNKPREKSESNKRKSNFSNSADDIKSKKKREQSNDIARGFERGLEPEKIIGATDSCGDLMFLMKWKDTDEADLVLAKEANVKCPQIVIAFYEERLTWHAYPEDAENKEKETAKS*
KCK HP1: ‘GSKCK’ sequence added to C-terminus and labile cysteine 133 mutated to serine
bpm HP1α: K89, R90, K91 mutated to alanine
nPhos HP1α: S92, S95, S97 mutated to alanine and co-expressed with CKII
ΔCTE HP1α: amino acids 178–192 (PEDAENKEKETAKS) removed
hPhos HP1α: amino acids S11, S12, S13, S14 mutated to alanine and co-expressed with CKII
nE: S11-14 mutated to glutamic acid
-
2HIS-TEV-ΝΗα/βChimera (N-terminus and Hinge from HP1α with the Chromodomain, Chromoshadow domain, and CTE from HP1β):
- MGHHHHHHDYDIPTTENLYFQGSGKKTKRTADSSSSEDEEEYVVEKVLDRRVVKGKVEYLLKWKGFSDEDNTWEPEENLDCPDLISEFMKKYKKMKEGENNKPREKSESNKRKSNFSNSADDIKSKKKREQSNDIARGFARGLEPERIIGATDSSGELMFLMKWKNSDEADLVPAKEANVKCPQVVISFYEERLTWHSYPSEDDDKKDDKN*
-
3HIS-TEV-Ntermα/βChimera (N-terminus from HP1α with the Hinge, Chromodomain, Chromoshadow domain, and CTE from HP1β):
- MGHHHHHHDYDIPTTENLYFQGSGKKTKRTADSSSSEDEEEYVVEKVLDRRVVKGKVEYLLKWKGFSDEDNTWEPEENLDCPDLIAEFLQSQKTAHETDKSEGGKRKADSDSEDKGEESKPKKKKEESEKPRGFARGLEPERIIGATDSSGELMFLMKWKNSDEADLVPAKEANVKCPQVVISFYEERLTWHSYPSEDDDKKDDKN*
-
3HIS-TEV-HP1βHuman HP1β
- MGHHHHHHDYDIPTTENLYFQGMGKKQNKKKVEEVLEEEEEEYVVEKVLDRRVVKGKVEYLLKWKGFSDEDNTWEPEENLDCPDLIAEFLQSQKTAHETDKSEGGKRKADSDSEDKGEESKPKKKKEESEKPRGFARGLEPERIIGATDSSGELMFLMKWKNSDEADLVPAKEANVKCPQVVISFYEERLTWHSYPSEDDDKKDDKN*
-
4HIS-TEV-TFIIB- Human transcription initiation factor IIB
- MGHHHHHHDYDIPTTENLYFQGMASTSRLDALPRVTCPNHPDAILVEDYRAGDMICPECGLVVGDRVIDVGSEWRTFSNDKATKDPSRVGDSQNPLLSDGDLSTMIGKGTGAASFDEFGNSKYQNRRTMSSSDRAMMNAFKEITTMADRINLPRNIVDRTNNLFKQVYEQKSLKGRANDAIASACLYIACRQEGVPRTFKEICAVSRISKKEIGRCFKLILKALETSVDLITTGDFMSRFCSNLCLPKQVQMAATHIARKAVELDLVPGRSPISVAAAAIYMASQASAEKRTQKEIGDIAGVADVTIRQSYRLIYPRAPDLFPTDFKFDTPVDKLPQL*
-
5HIS-TEV-Aurora B Kinase-Human serine/threonine kinase aurora-B.
- MGHHHHHHDYDIPTTENLYFQGMAQKENSYPWPYGRQTAPSGLSTLPQRVLRKEPVTPSALVLMSRSNVQPTAAPGQKVMENSSGTPDILTRHFTIDDFEIGRPLGKGKFGNVYLAREKKSHFIVALKVLFKSQIEKEGVEHQLRREIEIQAHLHHPNILRLYNYFYDRRRIYLILEYAPRGELYKELQKSCTFDEQRTATIMEELADALMYCHGKKVIHRDIKPENLLLGLKGELKIADFGWSVHAPSLRRKTMCGTLDYLPPEMIEGRMHNEKVDLWCIGVLCYELLVGNPPFESASHNETYRRIVKVDLKFPASVPTGAQDLISKLLRHNPSERLPLAQVSAHPWVRANSRRVLPPSALQSVA*
Peptides
Sgo1 (derived from human Shogushin-like protein 1): NVSLYPVVKIRRLSLSPKKNK
LBR (derived from human Lamin B Receptor): DIKEARREVEVKLTPLILKP
H3 (derived from Xenopus histone H3): ARTKQTARK(me3)STGGKA
Identical peptides with N-terminal fluorescein were used for anisotropy studies. All peptides were purchased from BioBasic.
DNA curtains experiments
Microfluidic devices were fabricated and DNA curtain assays were performed as previously described39,40. Briefly, after flowcell assembly, a lipid bilayer was deposited on the surface of the sample chamber and λ-phage DNA was anchored to the bilayer through a biotin-streptavidin linkage. The DNA was then aligned along the leading edges of diffusion barriers through the application of hydrodynamic force. HP1 compaction assays were conducted in reaction buffer containing 20 mM HEPES (pH 7.2), 70 mM KCl, 2 mg/ml BSA, 0.8% glucose, YOYO-1 and a glucose oxidase-catalase oxygen-scavenging system. HP1 was diluted in reaction buffer to a concentration of 50 μM, and then injected into the flow cell to begin each experiment. In order to reverse compaction, HP1 was flushed from the sample chamber with reaction buffer supplemented with 0.5 M KCl. Compaction rates were determined by tracking YOYO-1 fluorescence of DNA molecules with custom software written in python and using the scikit-image package.
Data availability
All relevant data are included in the main manuscript, extended data figures and supplementary information files. Any additional data are available from the corresponding author upon reasonable request.
Extended Data
Extended Data Figure 1. Mass-spectrometric analysis of HP1α proteins. Cross-linking Mass Spectrometry of HP1α identifies extensive interactions between the Chromoshadow domain(CSD) and the hinge region.
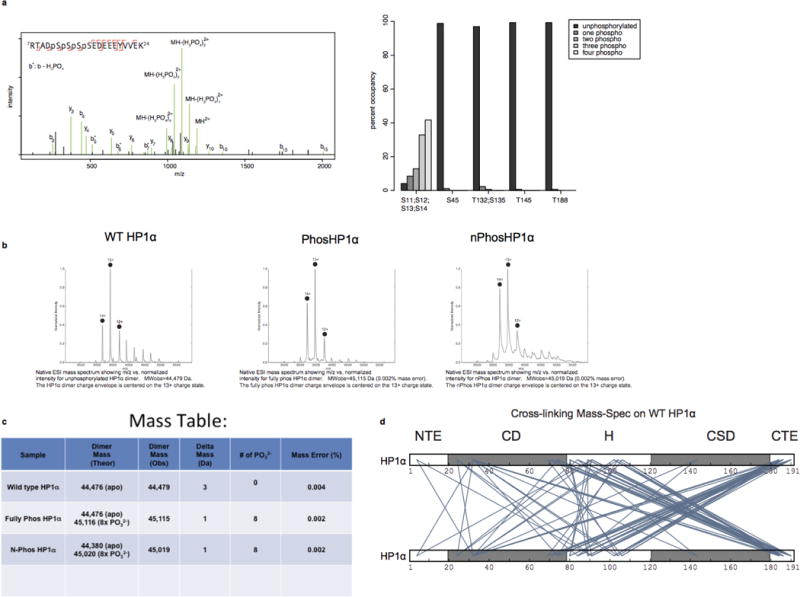
a, Phosphorylation of HP1α occurs almost exclusively at the N-terminus. Left panel: Annotated HCD product ion spectra of a quadruply phosphorylated, doubly charged HP1α peptide at Ser11, Ser12, Ser13, Ser14. Neutral loss of phosphoric acid from b-ions is indicated by b*. Right panel: Relative occupancy of observed HP1α phosphorylation sites as estimated by spectral counting. 41.7% of product ion spectra from peptides containing Serines 11–14 were observed quadruply phosphorylated (393 of 943 spectra). An additional 32.9% (310 spectra), 12.8% (121 spectra), and 8.5% (80 spectra) were identified triply, doubly, and singly phosphorylated, respectively, while only 4.1% (39 spectra) were observed with no phosphorylation. In contrast, phosphorylation was observed at other positions (Ser45, Thr132 and/or Ser135, Thr145, and Thr 188) with 1–2.5% occupancy (1059, 2243, 1586, 1042 total spectra observed for peptides containing these residues). b, Native MS charge state envelopes for WT, Phos- and nPhos- HP1α. c, Table with predicted and observed masses is also shown. The deconvoluted masses fit best to dimeric HP1α modified by 8-phosphates in Phos-HP1α and nPhos-HP1α samples. d, Cross-links were identified by separating cross-linked HP1α by SDS-PAGE and excising bands corresponding to monomeric and dimeric HP1α. Putative inter protein cross-links, diagrammed here, were identified by taking the set of cross-links that are unique to the dimer band (from three replicates). Only cross-links identified by 4 or more product ion spectra are shown for clarity.
Extended Data Figure 2. Phase separation is an isoform specific capability of phosphorylated HP1αthat is perturbed by GFP fusions.
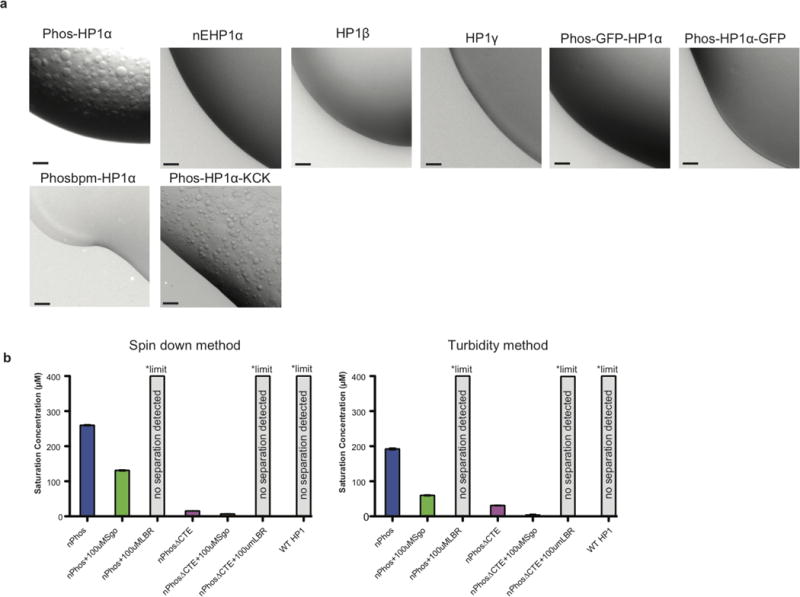
a, 1 μL of a solution of 400 μM of each protein was spotted on a plastic coverslip and imaged at 10×, scale bars are 50 μm. Buffer was 75 mM KCl, 20 mM HEPES pH 7.2, 1 mM DTT. Phos-HP1α is phosphorylated in the N-terminus and hinge, nE-HP1α has the N-terminal serines replaced with glutamates, Phos GFP-HP1α is a N-terminal GFP fusion phosphorylated in the N-terminus and hinge, Phos-HP1α-GFP is a C-terminal GFP fusion phosphorylated in the N-terminus and hinge, Phosbpm-HP1α has the ‘KRK’ hinge sequence mutated to alanines and phosphorylated in the N-terminus and hinge, Phos-HP1α-KCK has a C-terminal ‘GSKCK’ tag added and phosphorylated in the N-terminus and hinge. b, Complete comparison of saturation concentration measurements between spin down assay (left) and 340nm turbidity based measurement (right), some data is repeated from figure 1.
Extended Data Figure 3. Estimation of oligomeric potential by sedimentation velocity analytical ultracentrifugation.
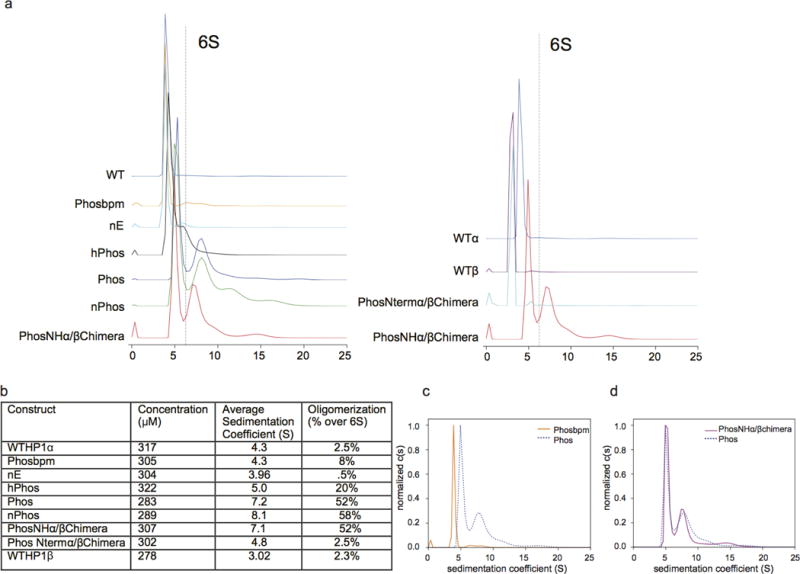
a, Representative sedimentation velocity runs from high concentration HP1 samples. Percentage of the loaded sample higher than 6S was quantified to estimate oligomeric species higher that a dimer. b, Table showing the comparison of high concentration AUC runs. Average sedimentation coefficient was quantified by integrating from 1–20S and higher order oligomers were estimated by integrating signal from 6–20S. c, Analytical ultracentrifugation c(S) analysis of fully phosphorylated HP1α and the fully phosphorylated basic patch mutant. d, Analytical centrifugation c(S) analysis of fully phosphorylated HP1α and the fully phosphorylated HP1α/β chimera (PhosNH-α/βchimera). Representative traces from three independent experiments are shown in a,b,c and d (n=3).
Extended Data Figure 4. Estimation of HP1α dimerization affinity by isothermal calorimetry and analytical ultracentrifugation.
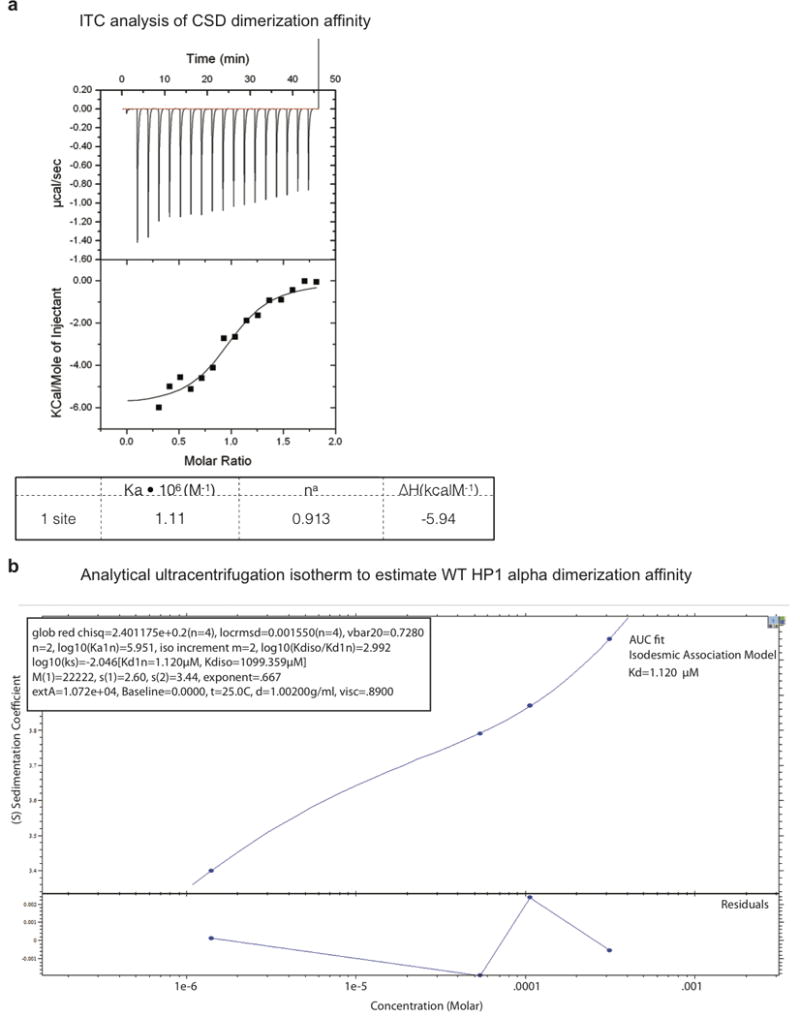
a, Isothermal calorimetry data showing the measured dimerization Kd for the HP1α CSD domain. The calculated Kd is 1.1 μM. b, An analytical ultracentrifugation isotherm used to estimate the dimerization Kd for WT HP1α. Estimated Kd for dimerization using an isodesmic association model is 1.12 μM.
Extended Data Figure 5. Scattering and Guinier fits of SAXS on WT and nPhos HP1α show homogeneous populations.
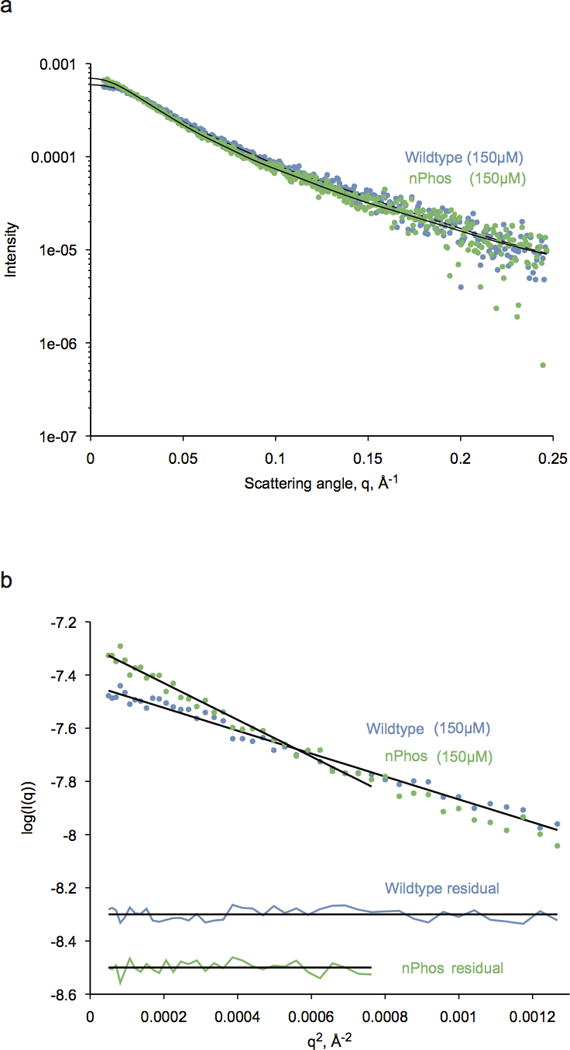
a, Raw X-ray scattering intensity of WT (blue points) and nPhos-HP1 (green points) at 3.5 mg/mL (150μM) concentration. Black lines are Fourier transforms of the fitted interatomic distance distribution, P(r), with chi-square values of 1.186 and 1.199 for WT and nPhos, respectively. b, Guinier plots of WT (blue points) and nPhos-HP1 (green points) at 150μM. Black lines are linear fits to the data plotted as log-intensity versus q2. The range of data used in the linear fits extend up to q*Rg of 1.3. The corresponding residuals for each fit are shown below as vertically-shifted horizontal lines for clarity.
Extended Data Figure 6. Phosphorylated HP1α elutes as an extended dimer when examined by SEC-MALS.
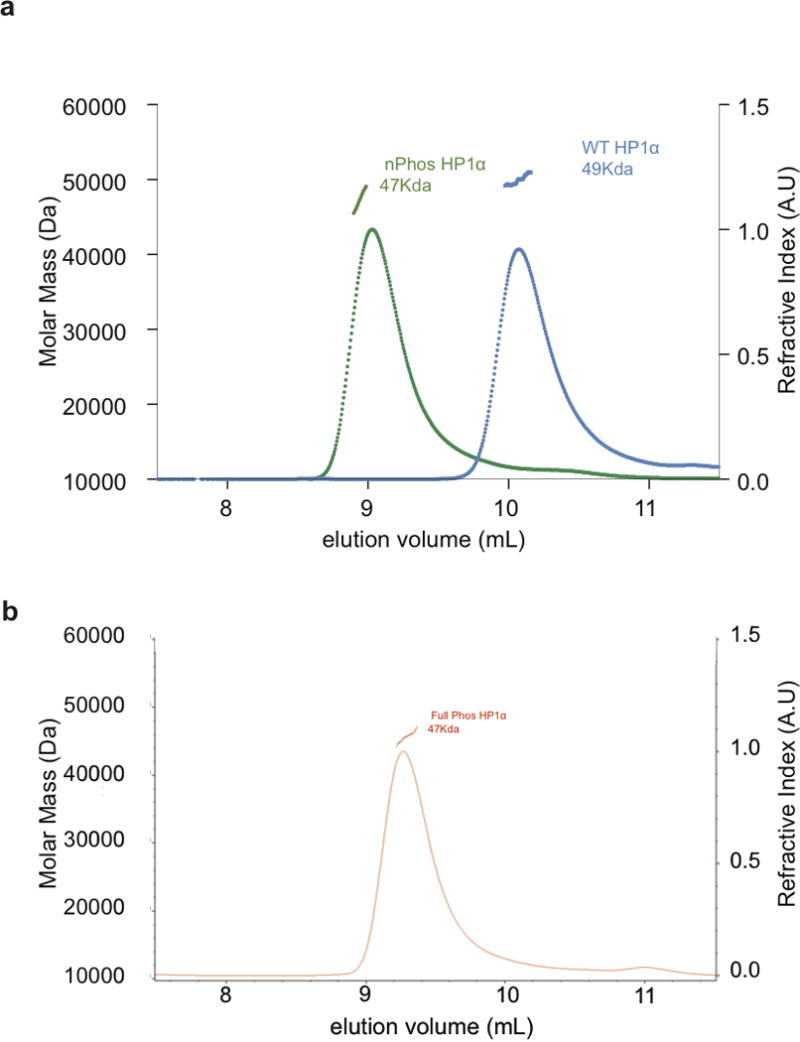
a, Elution profiles of WT HP1 and nPhos-HP1 examined by SEC-MALS. The horizontal green, and blue lines correspond to the calculated masses for nPhos HP1 and WT HP1 respectively. b, MALS trace of fully phosphorylated HP1α run under identical conditions to those in a.
Extended Data Figure 7. Measuring Shogushin 1, Lamin B Receptor, H3K9me3 peptide affinity, and the effect of Shogushin peptide binding on oligomerization.
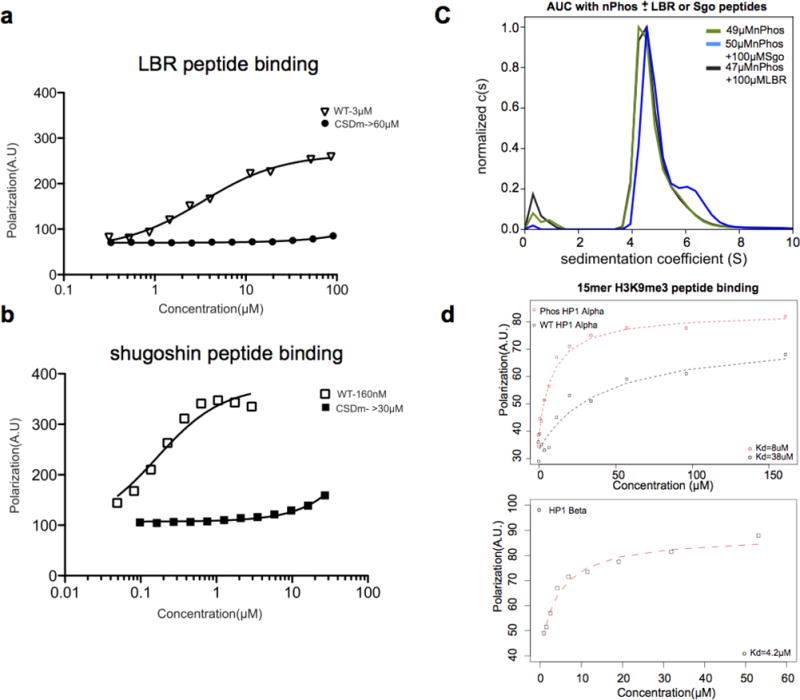
a, b, Fluorescence anisotropy plots showing the Kd measurements (values in μM next to symbols for WT vs. CSDm) for LBR and Sgo1 peptide binding to WT HP1α and the I163A CSD mutant (CSDm) which can no longer form dimers. c, Comparative AUC runs of ~50 μM nPhos HP1α with and without 100 μM Shogushin peptide or LBR peptide. d, Fluorescence anisotropy plots with a 15mer trimethylated H3K9 peptide showing the relevant HP1 isoforms can bind the nucleosome tail.
Extended Data Figure 8. Effects of additional ligands on saturation concentrations.
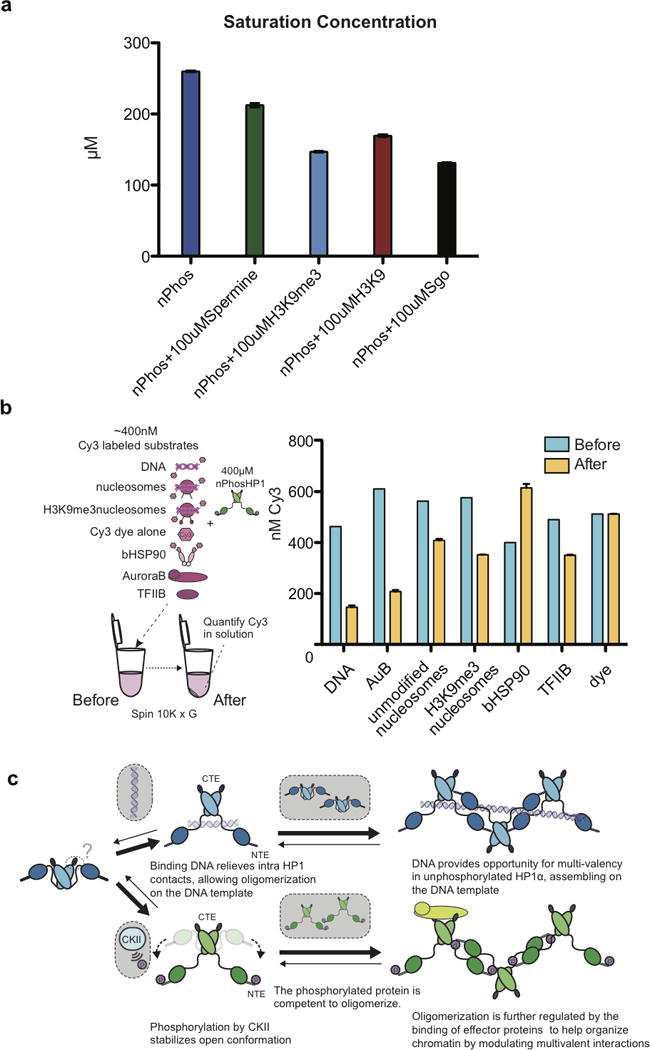
a, Bar graphs displaying the effects of 100 μM of the polyamine spermine along with the H3K9 and H3K9me3 peptides on phase separation behavior. b, Schematic of the assay used to quantify the partitioning of Cy3 labeled substrates into the two phases. The blue bars represent the total concentration of the labeled species before spin down; the orange bars represent the concentration of Cy3-labeled species remaining in the upper phase after spin down. The lower phase contains HP1α at a higher concentration than in the upper phase. Error bars represent standard error of the mean from three independent measurements. c, Model for phosphorylation or DNA driven HP1α phase separation. Phosphorylation or DNA binding relieves intra HP1 contacts and opens up the dimer. The location(s) of the intra- and inter-dimer contacts that change during this transition are not fully understood, but are predicted to involve interactions between the CTE, hinge, and NTE.
Extended Data Figure 9. Consequences of the interaction between HP1 and DNA.
Wide-field TIRF microscopy images of DNA compaction by a, HP1β and b, HP1α bpm at different time points, scale bars are 5μm. Average kymograms for c, HP1β (N = 368) and d, HP1α bpm (N = 318) overlayed with fits for average compaction speed (dashed line) and standard deviation (solid lines). Individual kymograms showing compaction by e, WT HP1α and f, nPhos-HP1α at different protein concentrations.
Extended Data Figure 10. Additional micrographs of NIH3T3 cells transduced with HP1.
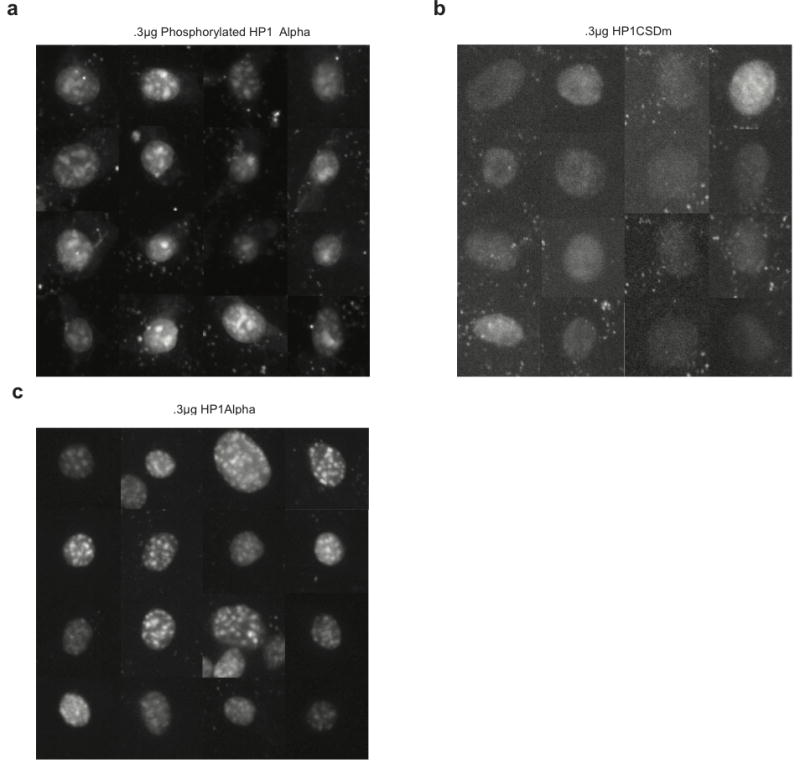
NIH3T3 cells transduced with .3 μg of HP1 proteins and imaged under identical conditions. a, nPhos, b, CSDm, c, WT HP1α
Supplementary Material
Acknowledgments
We thank Roger Cooke for the peltier device, Richard (Stefan) Isaac for nucleosome arrays, Andrew Lyon and Pat O’Farrell for stimulating conversations, Daniele Canzio, Lisa Racki and Coral Zhou for helpful comments and discussions and Igal Sterin and Ricardo Almeida for valuable cell culture help. This work was supported by an NSF pre-doctoral fellowship to A.G.L, funding from the UCSF Program for Breakthrough Biomedical Research (PBBR) provided by the Sandler Foundation to S.R., grants from the NIH (8P41GM103481 and 1S10D016229) to A.L.B, and grants from NIH (R01GM108455) and PBBR (New Frontier Research Award) to G.J.N.
Footnotes
Author Contributions
A.G.L developed the overall experimental plan with guidance from G.J.N and carried out the majority of the experiments and their interpretation. D.E. developed and implemented new software for analyzing the SAXS data and helped conceive further experiments, M.J.T performed and analyzed the cross-linking and phosphate mapping MS experiments, J.B.J. performed the native MS experiments with guidance from A.L.B. D.A.A. provided guidance on SAXS experiments. M.K. performed and analyzed the DNA curtains experiments and S.R, oversaw their design and interpretation. G.J.N. and A.G.L wrote the bulk of the manuscript with major contributions from S.R. G.J.N oversaw the overall project.
The authors declare no competing financial interests.
References
- 1.Yamagishi Y, Sakuno T, Shimura M, Watanabe Y. Heterochromatin links to centromeric protection by recruiting shugoshin. Nature. 2008;455:251–255. doi: 10.1038/nature07217. [DOI] [PubMed] [Google Scholar]
- 2.Eissenberg JC, Elgin SC. The HP1 protein family: getting a grip on chromatin. Current Opinion in Genetics & Development. 10:204–210. doi: 10.1016/s0959-437x(00)00058-7. [DOI] [PubMed] [Google Scholar]
- 3.Domain-specific Interactions of Human HP1-type Chromodomain Proteins and Inner Nuclear Membrane Protein LBR*. 1997:1–8. doi: 10.1074/jbc.272.23.14983. [DOI] [PubMed] [Google Scholar]
- 4.Greene EC, Wind S, Fazio T, Gorman J, Visnapuu M-L. In: Single Molecule Tools: Fluorescence Based Approaches, Part A. Walter NG, editor. Vol. 472. Academic Press; 2010. pp. 293–315. [Google Scholar]
- 5.Nishibuchi G, et al. N-terminal phosphorylation of HP1alpha increases its nucleosome-binding specificity. Nucleic Acids Res. 2014;42:12498–12511. doi: 10.1093/nar/gku995. [DOI] [PMC free article] [PubMed] [Google Scholar]
- 6.Canzio D, Larson A, Narlikar GJ. Mechanisms of functional promiscuity by HP1 proteins. Trends in Cell Biology. 24:377–386. doi: 10.1016/j.tcb.2014.01.002. [DOI] [PMC free article] [PubMed] [Google Scholar]
- 7.Vakoc CR, Mandat SA, Olenchock BA, Blobel GA. Histone H3 Lysine 9 Methylation and HP1γ Are Associated with Transcription Elongation through Mammalian Chromatin. Molecular Cell. 2005;19:381–391. doi: 10.1016/j.molcel.2005.06.011. [DOI] [PubMed] [Google Scholar]
- 8.Locke J, Kotarski MA, Tartof KD. Dosage-dependent modifiers of position effect variegation in Drosophila and a mass action model that explains their effect. Genetics. 1988;120:181–198. doi: 10.1093/genetics/120.1.181. [DOI] [PMC free article] [PubMed] [Google Scholar]
- 9.Smothers JF, Henikoff S. The Hinge and Chromo Shadow Domain Impart Distinct Targeting of HP1-Like Proteins. Molecular and Cellular Biology. 2001;21:2555–2569. doi: 10.1128/MCB.21.7.2555-2569.2001. [DOI] [PMC free article] [PubMed] [Google Scholar]
- 10.Kilic S, Bachmann AL, Bryan LC, Fierz B. Multivalency governs HP1[alpha] association dynamics with the silent chromatin state. Nat Commun. 6 SP doi: 10.1038/ncomms8313. [DOI] [PMC free article] [PubMed] [Google Scholar]
- 11.Mishima Y, et al. Hinge and Chromoshadow of HP1α Participate in Recognition of K9 Methylated Histone H3in Nucleosomes. J Mol Biol. 2013;425:54–70. doi: 10.1016/j.jmb.2012.10.018. [DOI] [PubMed] [Google Scholar]
- 12.Hiragami-Hamada K, et al. N-Terminal Phosphorylation of HP1 Promotes Its Chromatin Binding. Molecular and Cellular Biology. 2011;31:1186–1200. doi: 10.1128/MCB.01012-10. [DOI] [PMC free article] [PubMed] [Google Scholar]
- 13.Mol Cell Proteomics-2009-LeRoy-2432-42. 2009 doi: 10.1074/mcp.M900160-MCP200. [DOI] [PMC free article] [PubMed] [Google Scholar]
- 14.Li P, et al. Phase transitions in the assembly of multivalent signalling proteins. Nature. 2012;483:336–340. doi: 10.1038/nature10879. [DOI] [PMC free article] [PubMed] [Google Scholar]
- 15.Banani SF, Lee HO, Hyman AA, Rosen MK. Biomolecular condensates: organizers of cellular biochemistry. Nat Rev Mol Cell Biol. 2017 doi: 10.1038/nrm.2017.7. [DOI] [PMC free article] [PubMed] [Google Scholar]
- 16.Velez G, et al. Evidence supporting a critical contribution of intrinsically disordered regions to the biochemical behavior of full-length human HP1. Journal of Molecular Modeling. 2016:1–17. doi: 10.1007/s00894-015-2874-z. [DOI] [PMC free article] [PubMed] [Google Scholar]
- 17.Ye Q, Callebaut I, Pezhman A, Courvalin JC, Worman HJ. Domain-specific interactions of human HP1-type chromodomain proteins and inner nuclear membrane protein LBR. J Biol Chem. 1997;272:14983–14989. doi: 10.1074/jbc.272.23.14983. [DOI] [PubMed] [Google Scholar]
- 18.Direct Activation of Bax by p53Mediates Mitochondrial MembranePermeabilization and Apoptosis. 2004:1–6. [Google Scholar]
- 19.Canzio D, et al. A conformational switch in HP1 releases auto-inhibition to drive heterochromatin assembly. Nature. 2013;496:377–381. doi: 10.1038/nature12032. [DOI] [PMC free article] [PubMed] [Google Scholar]
- 20.Hiragami-Hamada K, et al. Dynamic and flexible H3K9me3 bridging via HP1[beta] dimerization establishes a plastic state of condensed chromatin. Nat Commun. 7 SP doi: 10.1038/ncomms11310. [DOI] [PMC free article] [PubMed] [Google Scholar]
- 21.J Biochem-1996-Sugimoto-153-9. 2005:1–7. [Google Scholar]
- 22.Azzaz AM, et al. Human heterochromatin protein 1alpha promotes nucleosome associations that drive chromatin condensation. J Biol Chem. 2014;289:6850–6861. doi: 10.1074/jbc.M113.512137. [DOI] [PMC free article] [PubMed] [Google Scholar]
- 23.Kilic S, Bachmann AL, Bryan LC, Fierz B. Multivalency governs HP1. Nature Communications. 2015;6:1–11. doi: 10.1038/ncomms8313. [DOI] [PMC free article] [PubMed] [Google Scholar]
- 24.Fuller DN, et al. Measurements of single DNA molecule packaging dynamics in bacteriophage lambda reveal high forces, high motor processivity, and capsid transformations. J Mol Biol. 2007;373:1113–1122. doi: 10.1016/j.jmb.2007.09.011. [DOI] [PMC free article] [PubMed] [Google Scholar]
- 25.Hyman AA, Weber CA, Julicher F. Liquid-liquid phase separation in biology. Annu Rev Cell Dev Biol. 2014;30:39–58. doi: 10.1146/annurev-cellbio-100913-013325. [DOI] [PubMed] [Google Scholar]
- 26.Iborra FJ. Can visco-elastic phase separation, macromolecular crowding and colloidal physics explain nuclear organisation? Theor Biol Med Model. 2007;4:15. doi: 10.1186/1742-4682-4-15. [DOI] [PMC free article] [PubMed] [Google Scholar]
- 27.Richter K, Nessling M, Lichter P. Macromolecular crowding and its potential impact on nuclear function. Functional Architecture of the Cell Nucleus. 2008;1783:2100–2107. doi: 10.1016/j.bbamcr.2008.07.017. [DOI] [PubMed] [Google Scholar]
- 28.Strom AR, et al. Phase separation drives heterochromatin domain formation. Nature. doi: 10.1038/nature22989. in press. [DOI] [PMC free article] [PubMed] [Google Scholar]
- 28.Li C, et al. FastCloning: a highly simplified, purification-free, sequence- and ligation-independent PCR cloning method. BMC Biotechnology. 2011;11:92. doi: 10.1186/1472-6750-11-92. [DOI] [PMC free article] [PubMed] [Google Scholar]
- 29.Schuck P. On the analysis of protein self-association by sedimentation velocity analytical ultracentrifugation. Analytical Biochemistry. 2003;320:104–124. doi: 10.1016/s0003-2697(03)00289-6. [DOI] [PubMed] [Google Scholar]
- 30.Brautigam CA. Calculations and Publication-Quality Illustrations for Analytical Ultracentrifugation Data. Methods Enzymol. 2015;562:109–133. doi: 10.1016/bs.mie.2015.05.001. [DOI] [PubMed] [Google Scholar]
- 31.Hansen S. Bayesian estimation of hyperparameters for indirect Fourier transformation in small-angle scattering. Journal of Applied Crystallography. 2000;33:1415–1421. [Google Scholar]
- 32.Kaustov L, et al. Recognition and Specificity Determinants of the Human Cbx Chromodomains. Journal of Biological Chemistry. 2010;286:521–529. doi: 10.1074/jbc.M110.191411. [DOI] [PMC free article] [PubMed] [Google Scholar]
- 33.Kang J, et al. Mitotic centromeric targeting of HP1 and its binding to Sgo1 are dispensable for sister-chromatid cohesion in human cells. Molecular Biology of the Cell. 2011;22:1181–1190. doi: 10.1091/mbc.E11-01-0009. [DOI] [PMC free article] [PubMed] [Google Scholar]
- 34.Shevchenko A, Tomas H, Havlis J, Olsen JV, Mann M. In-gel digestion for mass spectrometric characterization of proteins and proteomes. Nat Protoc. 2006;1:2856–2860. doi: 10.1038/nprot.2006.468. [DOI] [PubMed] [Google Scholar]
- 35.Trnka MJ, Baker PR, Robinson PJJ, Burlingame AL, Chalkley RJ. Matching cross-linked peptide spectra: only as good as the worse identification. Mol Cell Proteomics. 2014;13:420–434. doi: 10.1074/mcp.M113.034009. [DOI] [PMC free article] [PubMed] [Google Scholar]
- 36.Lu J, et al. Improved Peak Detection and Deconvolution of Native Electrospray Mass Spectra from Large Protein Complexes. J Am Soc Mass Spectrom. 2015;26:2141–2151. doi: 10.1007/s13361-015-1235-6. [DOI] [PMC free article] [PubMed] [Google Scholar]
- 37.Marty MT, et al. Bayesian deconvolution of mass and ion mobility spectra: from binary interactions to polydisperse ensembles. Anal Chem. 2015;87:4370–4376. doi: 10.1021/acs.analchem.5b00140. [DOI] [PMC free article] [PubMed] [Google Scholar]
- 38.Correll SJ, Schubert MH, Grigoryev SA. Short nucleosome repeats impose rotational modulations on chromatin fibre folding. EMBO J. 2012;31:2416–2426. doi: 10.1038/emboj.2012.80. [DOI] [PMC free article] [PubMed] [Google Scholar]
- 39.Greene EC, Wind S, Fazio T, Gorman J, Visnapuu M-L. In: Single Molecule Tools: Fluorescence Based Approaches, Part A. Walter NG, editor. Vol. 472. Academic Press; 2010. pp. 293–315. [Google Scholar]
- 40.Gallardo IF, et al. High-Throughput Universal DNA Curtain Arrays for Single-Molecule Fluorescence Imaging. Langmuir. 2015;31:10310–10317. doi: 10.1021/acs.langmuir.5b02416. [DOI] [PMC free article] [PubMed] [Google Scholar]
Associated Data
This section collects any data citations, data availability statements, or supplementary materials included in this article.
Supplementary Materials
Data Availability Statement
All relevant data are included in the main manuscript, extended data figures and supplementary information files. Any additional data are available from the corresponding author upon reasonable request.