Abstract
Objective
Episodes of bradycardia are common and recur sporadically in preterm infants, posing a threat to the developing brain and other vital organs. We hypothesize that bradycardias are a result of transient temporal destabilization of the cardiac autonomic control system and that fluctuations in the heart rate signal might contain information that precedes bradycardia. We investigate infant heart rate fluctuations with a novel application of point process theory.
Methods
In 10 preterm infants, we estimate instantaneous linear measures of the heart rate signal in neonates, use these measures to extract statistical features of bradycardia, and propose a simplistic framework for prediction of bradycardia.
Results
We present the performance of a prediction algorithm using instantaneous linear measures (mean AUC = 0.79±0.018) for over 440 bradycardia events. The algorithm achieves an average forecast time of 116 seconds prior to bradycardia onset (FPR = 0.15). Our analysis reveals that increased variance in the heart rate signal is a precursor of severe bradycardia. This increase in variance is associated with an increase in power from low content dynamics in the LF band (0.04–0.2 Hz) and lower multiscale entropy values prior to bradycardia.
Conclusion
Point process analysis of the heartbeat time series reveals instantaneous measures that can be used to predict infant bradycardia prior to onset.
Significance
Our findings are relevant to risk stratification, predictive monitoring, and implementation of preventative strategies for reducing morbidity and mortality associated with bradycardia in neonatal intensive care units.
Index Terms: Bradycardia, Heart Rate Variability, Inter-beat Intervals, Point Process, Prediction, Preterm Infants
I. Introduction
Infant prematurity, defined as < 37 weeks gestational age, occurs at a rate of 10% worldwide. These infants experience developmental disorders that can lead to impaired health outcomes [1–3]. A common disorder observed in majority of preterm infants is recurrent episodes of apnea and bradycardia, which may cause end organ damage related to hypoxemia (low oxygenation of blood) and ischemia (reduced blood flow) [4]. Though apnea often precedes onsets of bradycardia [5–7], apnea and bradycardia can be uncorrelated [8].
In preterm infants, heart rates below 100 bpm result in decreased cerebral blood velocities of ~10–50% from baseline, while more severe bradycardias (< 60 bpm) cause > 50% blood velocity reduction [9]. These changes result in reduced cerebral blood velocity and delivery of oxygenated hemoglobin, as well as reduced clearance of metabolic byproducts [10–12]. The aggregate result of cardio-respiratory events is hypoxic-ischemic injury in tissue with high metabolic demands. Intermittent hypoxia in preterm infants is associated with a range of complications including retinopathy, developmental delays, and neuropsychiatric disorders [13–15]. To aid clinicians and medical staff, therapeutic interventions, for example as presented in [16, 17], might be most effective if intervention is initiated early in high risk infants. In particular, implementation of algorithms for detection of apnea-bradycardia [18] and their limited success in prediction [13, 19, 20] might help risk-stratify infants for long-term outcomes, alert clinicians for short-term intervention, and ultimately provide automated therapeutic care that reduce the hypoxic-ischemic complications of preterm cardio-respiratory control.
Heart rate is regulated by a neural feedback control system [21–25]. Blood pressure fluctuations are sensed by carotid sinus baroreceptors that send afferent impulses to brainstem and supra-bulbar circuits. The circuits' output regulates heart rate through vagal-sympathetic efferent nerves that affect cardiac pacemakers. In pathological circumstances, the heart rate control system can be dysregulated, resulting in episodes of vagally mediated bradycardia [26]. In theory, pathological instabilities in heart rate should be evident prior to overt bradycardia, which is supported by [27, 28]. We hypothesize that the immature cardiovascular control system in preterm infants exhibits transient temporal instabilities in heart rate that can be detected as a precursor signal of bradycardia.
We explore this hypothesis by extracting statistical features in heartbeat signals prior to bradycardia and evaluating the utility of these features for prediction. Infant heart rate is innately nonstationary, and conventional analysis methods may not fully capture the idiosyncratic fluctuations of heartbeat signals. Point process analysis can be used to generate real-time, stochastic measures from discrete observables of continuous biological mechanisms [29–34]. Introducing a stochastic estimation of heart rate can capture the fleeting instabilities (e.g. instantaneous variance and poles) beyond sampling rate limited measures. In a preliminary study [33], we introduced a point process model of infant heart rate dynamics and showed that a lognormal probability distribution of inter-beat intervals (R-R intervals) provided instantaneous mean and variance estimates of heart rate that exhibited increased clustering preceding severe bradycardias. This statistical feature suggests a possible discrimination that can be used for building a predictive tool.
In this paper, we use instantaneous mean and variance estimates from ECG alone to develop a novel algorithm for near-term prediction of bradycardia in preterm infants. Our goal is to create a real-time, prospective system for clinical practice. We also investigate a selection of other dynamical features to help elucidate the properties of cardiovascular control that can be used for future investigation of bradycardia.
II. METHODS
A. Preterm Infant Dataset
We collected data in the Neonatal Intensive Care Unit (NICU) at University of Massachusetts Memorial Healthcare (available at http://physionet.org). Ten preterm infants were studied, with post-conceptional age of to weeks (mean: weeks) and study weights of 843 to 2100 grams (mean: 1468 grams). The infants were spontaneously breathing room air and lacked any congenital or perinatal infection of the central nervous system, intraventricular hemorrhage of grade II or higher, and hypoxic-ischemic encephalopathy. A 3-lead electrocardiogram (ECG) signal was recorded (500 Hz) from bedside patient monitors (Intellivue MP70, Philips Medical Systems) for ~20–70 hours per infant (Table 1). Respiratory signals, using external inductance bands placed around the chest wall and abdomen, were also recorded (50 Hz) and synchronized using VueLogger™, a data acquisition system developed at the Wyss Institute, Harvard University. The study protocol was approved by the University of Massachusetts Medical School Institutional Review Board for human subjects.
TABLE 1.
Post-conceptional Age (PCA), Weight, Heart Rate and Number of Bradycardias* in 10 Subjects
| Subject | 1 | 2 | 3 | 4 | 5 | 6 | 7 | 8 | 9 | 10 | ||||||||||
|---|---|---|---|---|---|---|---|---|---|---|---|---|---|---|---|---|---|---|---|---|
| PCA (wks) |
|
|
|
|
|
|
|
|
|
|
||||||||||
| Weight (kg) | 1.20 | 1.76 | 1.71 | 0.84 | 1.67 | 1.14 | 1.11 | 2.10 | 1.23 | 1.90 | ||||||||||
| Recording Time (hrs) | 45.6 | 43.8 | 43.7 | 46.8 | 48.8 | 48.6 | 20.3 | 24.6 | 70.3 | 45.1 | ||||||||||
| Mean [SD] HR (bpm) | 155 [10] | 131 [14] | 131 [13] | 167 [9] | 143 [16] | 137 [8] | 162 [13] | 141 [13] | 150 [13] | 156 [16] | ||||||||||
|
| ||||||||||||||||||||
| Mild* | 65 | 37 | 40 | 15 | 35 | 34 | 12 | 19 | 28 | 29 | ||||||||||
| Moderate* | 11 | 27 | 30 | 20 | 33 | 11 | 15 | 5 | 25 | 11 | ||||||||||
| Severe* | 1 | 8 | 10 | 31 | 4 | 11 | 7 | 4 | 44 | 0 | ||||||||||
|
|
||||||||||||||||||||
| Total | 77 | 72 | 80 | 66 | 72 | 56 | 34 | 28 | 97 | 40 | ||||||||||
We process the ECG signals by calculating peak-to-peak R-R intervals using a modified Pan-Tompkins algorithm and visually remove artifacts due to movement, disconnection, or erroneous peak detections. Based on cerebral oxygenation deficiencies from [9] and clinical practice for bradycardia, we investigate normal heart rates (> 100 bpm) and clinical bradycardias: mild (100-80 bpm), moderate (80-60 bpm), and severe (< 60 bpm) (Table 1). We define a bradycardia event as an event with a heart rate less than 100 bpm for at least two beats (> 1.2 seconds) in duration. In total there are 622 bradycardia events (178 in training set, 444 in prediction set).
B. Point Process Modeling of Infant Heart Rate
Point process theory provides a stochastic method to estimate instantaneous processes of continuous systems from discrete observables. The heartbeat generation mechanism can be modeled as a point process. The timing of heart contractions are modulated by neural signals from the sympathetic and parasympathetic branches of the autonomic nervous system. These efferent nerves project to cardiac pacemaker cells that control the timing of depolarization and hyperpolarization of each cardiac cell, which macroscopically couple to produce the sequential contraction of the heart. Hence, the occurrence of a heartbeat (i.e. R peak on the ECG) is highly dependent on previous instances, and the heartbeat time series can be highly dynamic due to variable neuron and pacemaker firing.
If we consider a data collection interval [Ta, Tb], the time of each R peak is given by: Ta ≤ u1 < u2 < ⋯ < uk ≤ Tb, where each ui is the time of the ith R peak. Thus, the corresponding R-R time interval at time k is given by the set Hk = {wk, wk−1,, … ․, wk−p+1}, where wk = uk − uk−1 and 0 ≤ p ≤ k. Because heart rate is a serial procedure, we can estimate a heartbeat at time k with a p-order linear regression [34]:
| (1) |
where θ(t) = {θo, …, θj, …, θk} is the estimation vector of optimized model parameters.
We can then use the estimation in (1) to generate future estimations of heartbeats from an appropriate probability distribution (PD). From [33], we showed that the lognormal probability distribution captures the statistical distribution of R-R intervals associated with bradycardia in preterm infants. So, we propose that a collection of infant R-R intervals follow a lognormal probability distribution, and that future R-R values can be estimated from this probability distribution with sample μ(Hk, θ(t)) = μ(t) from the linear regression.
At any given peak, uk, we assume the time until the next heartbeat, uk+1, obeys a lognormal probability density [31, 33]:
| (2) |
μ(t) and σ(t) are state variables and are estimates over time, t, using a local maximum-likelihood optimization to create a continuous estimation of the heartbeat signal (described in II.C.). We estimate instantaneous mean M(t) and variance V(t) of the heartbeat signal by applying the traditional transformation from a lognormal to a normal distribution:
| (3) |
These estimates are instantaneous because for any time t, a new probability distribution is computed at Δt with new state variables μ(t) and σ(t) before the next heartbeat data (see II.C.). We later use the descriptors M(t) and V(t) as features to predict onsets of bradycardia.
C. Local Maximum Likelihood Estimation of Parameters
For the ECG interval [Ta, Tb], let l be the length of the local likelihood observation window for t ∈ [Ta + l, Tb], and let Δt be the incremental time to update the parameters. To compute optimal estimates of θ(t) and σ(t), we define a local joint probability density of ut−l:t, with ut−l:t being the collection of R-wave peaks on the interval (t−l, t] that are generated with the previous p R-R intervals [31, 34]. We define the maximum likelihood estimate (MLE) of θ(t) and σ(t) on (t − l, t] to be θ̂ and σ̂, respectively. The local log likelihood is:
| (4) |
where w(t − u) = α(t−u) is the weighting function for the local likelihood estimation, and α is a weight that assigns the influence of previous observations. We chose α = 0.98.
For a given time t, we maximize log f (ut−l:t|θ(t)) with the previous local MLE of time t − Δt. The overlap between adjacent local likelihood intervals is large. The state variables θ(t), μ(t), and σ(t) are updated through this maximum likelihood estimate even though new peak data from the ECG is not available. We can obtain estimates of all the descriptors defined in Section II.A. at a resolution of Δt, which if small enough, can be considered instantaneous. We chose Δt = 0.005 s.
D. Bradycardia Prediction Algorithm
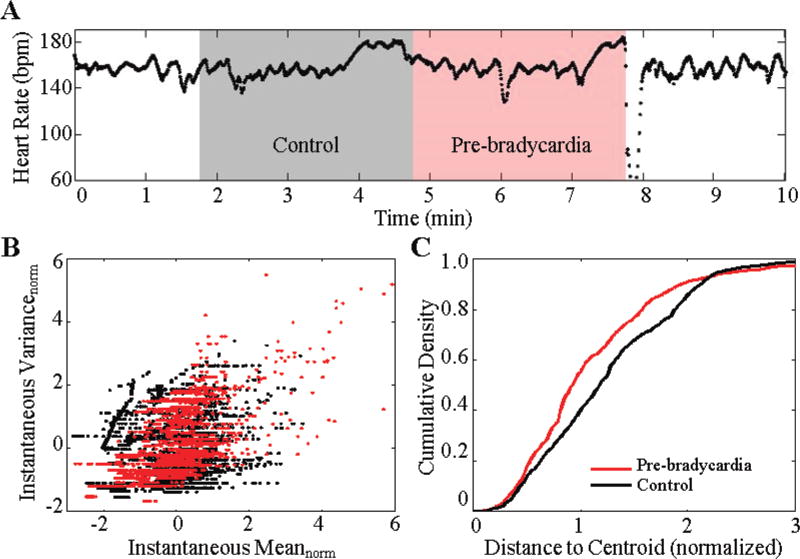
We restrict the training data to the first third of the data (mean of 12 ± 6 hours) for each infant, and evaluate our model on the remaining signal. This design was chosen as a first step to simulate prospective, clinical monitoring. To investigate the behavior of varying bradycardia severity, we choose a sample of 7–10 isolated bradycardias (exhibiting normal heart rate for at least 8 minutes prior to onset and at least one second in duration, Fig. 1a). Bradycardias in the training set that did not meet this criteria were excluded. We then generate point process estimates of the heartbeat signal with an 8th-order linear regression using methods described in II.B.
Fig. 1.
(a) An example of severe bradycardia for infant 7. The gray region represents a 3-minute control window, and the red region represents a 3-minute pre-bradycardia window. Statistical fluctuations of the point process estimation of R-R intervals from these two regions are used to evaluate the likelihood of an impending bradycardia. (b) Normalized mean and normalized variance of the point process indices from 7 events of infant 7. The pre-bradycardia window indices cluster distinctly from the control window. (c) The resulting average cumulative density of the indices from the cluster map.
We denote Bn as the collection of bradycardia examples for infant n, where n = 1, 2… 10. For infant n, let j be a particular bradycardia event in Bn, and Mj and Vj be the set of all M(t) and V (t), respectively, in a window of duration ε = 3 minutes prior to event j (Fig. 1a). A second set of Mj and Vj is also collected for a control region. The choice of ε is influenced by [27] and early work on the behavior of bradycardia features [33]. We normalize both Mj and Vj to have zero mean and unit variance (5). This normalization allows for comparisons across different time frames while preserving oscillations inherent in the signal.
| (5) |
We take the normalized point process means φ(Mj) and variances φ(Vj) and create a (φ(Mj), φ(Vj)) point-cloud of all j bradycardias in Bn (Fig 1b). We calculate a cumulative density curve (CDC) by summing the number of (φ(Mj), φ(Vj)) pairs as a function of distance from a k-means cluster centroid (Fig. 1c). Steep inclinations in the CDC indicate a dense collection of (φ(Mj), φ(Vj)) pairs. We choose this method as it is sensitive to large densities of (φ(Mj), φ(Vj)) pairs.
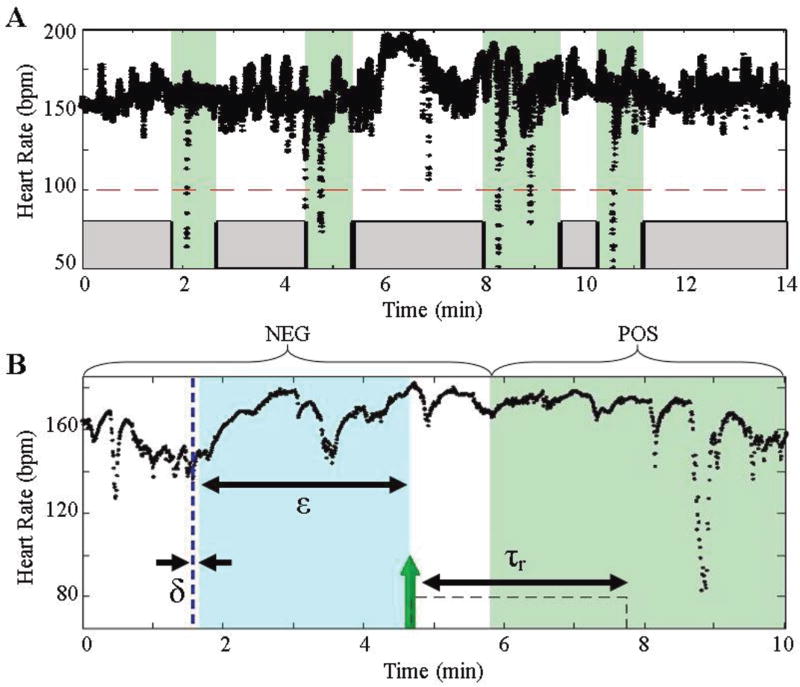
We then use the density curves of the pre-bradycardia and control regions from the training data to evaluate the remainder of the ECG signal. We start the evaluation from the last time stamp of the last bradycardia in the training set. We incrementally slide an evaluation window (EW) by δ seconds (Fig. 2b). To determine whether a new input is associated with an impending bradycardia, we define two segments to collect statistical information from: (1) the pre-bradycardia window (PBW), which marks the window of length ε just prior to the onset of bradycardia, and (2) the control window (CW), which marks the window of length ε just prior to the PBW (Fig. 1a). The underlying hypothesis is that the heart rate in the control window behaves distinctly from the heart rate just prior to bradycardia onset For the results presented, we choose δ = 5 s.
Fig. 2.
(a) The green areas denote regions that encompass a bradycardia. Notice that secondary bradycardias (8–9 min) are classified as one event. The other regions (gray) represent regions absent bradycardia. (b) Detailed diagram of one particular bradycardia segment. The parameters used for the algorithm are outlined in the Table 2. A prediction is triggered with a time stamp of the leading edge of the evaluation window (green arrow).
We calculate the point process estimates using (3) and generate a cumulative curve for the EW and compare this curve to our classifiers by calculating an element-wise Euclidean distance array between the EW curve (EWCDC) and to each of the classifiers, PBWCDC, and CWCDC (6). The resultant distance arrays are then compared element-wise to each other. A decision statistic is generated by finding the fractional total of points where EWCDC is more similar to the pre-bradycardia window curve (i.e. magnitude of ΔPBWCDC < ΔCWCDC) (7).
| (6) |
| (7) |
By design, the threshold is bound from 0 to 1. Any window that satisfies criteria (7) will generate a prediction with a time stamp of the leading window edge (Fig. 2b). If a prediction is within one EW of a bradycardia (e.g. ε = 3 min), the result will be reported as a true prediction. Any other prediction will be a false alarm. This criterion is driven by our choice of ε in the construction of PBWCDC and CWCDC.
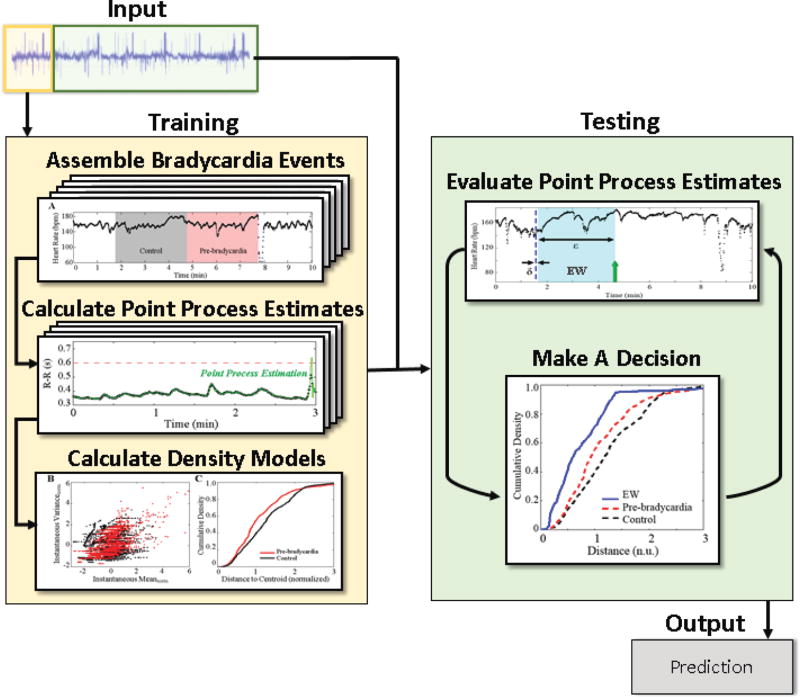
Once a prediction is triggered, we can employ a refractory period, τr, where no further predictions are made. Clinically, this refractory period can be seen as an intervention period for the infant where clinical staff can start procedures to resolve an impending bradycardia (e.g. sterilize hands and apply physical arousal). For the results presented in III.A., we choose τr = δ = 5 s, the minimum refractory time. Although this value may not be clinically relevant, this choice is used to evaluate the frame-by-frame performance of the algorithm. As intervention methods arise, we will be able to tune τr accordingly. An overview of the algorithm is provided in Fig. 3.
Fig. 3.
Schematic of the prediction algorithm. For each subject, a portion of the ECG signal (beige) is used to create the classification models, while the remaining signal (green) is used for prediction.
E. Evaluation Metric for Algorithm
To evaluate the performance of our analysis, we calculate the receiver operating characteristic (ROC) curve. These curves depict the probability of detection (sensitivity = TP/P) as a function of the probability of false alarm (1− specificity = 1 − TN/NEG). We define sensitivity as the number of bradycardias that are predicted (TP) over the total number of bradycardias (P). Any prediction within one ε prior to a bradycardia is predicted. For a given bradycardia event, x, the [x−ε, x+6] minute interval region is classified as the positive bradycardia region (POS) (Fig. 2a). This criterion ensures that the EW has enough time to pass any peripheral effects of the previous bradycardia. As a consequence, the results achieved by the algorithm are not influenced by bradycardia clustering since we ignore the 6-minute regions post-bradycardia. The negative-bradycardia regions (NEG) are defined as all regions outside of the POS region (Fig. 2a). Hence, specificity is defined as the rate of not predicting bradycardias (TN) within NEG.
To evaluate the performance of the predictor, we use the area under the curve (AUC) of the ROC curve to determine the classification power of the algorithm. AUC scores of 0.5 signify an algorithm that performs by chance (i.e. 50% probability of detection and 50% probability of false alarm), and scores of 1.0 signify a perfect predictor.
F. Other Physiological Features of Bradycardia
In our framework, we focus on instantaneous mean M(t) and variance V(t) as two features for bradycardia prediction. To further understand the physiological effect and implications of instantaneous M(t) and V(t) on HRV, we investigate two physiological features known to be influenced by mean and variance in a dynamic system: frequency and complexity. These analyses are evaluated on isolated segments prior to bradycardia and segments within normal heart rate regions.
We evaluate the frequency content of the R-R time series by calculating a traditional Morlet wavelet transform [35] with parameters Δt = 1/3, so = 2Δt, δj = 1/256 and J = 9/ δj. We also calculate the multiscale entropy (MSE) of a 20-min epoch leading up to a bradycardia to investigate the complexity of heart rate during a diseased state. MSE is a time-varying calculation of sample entropy (SEn) across different time scales [36], and commands a long time interval for processing.
III. Results
A. Prediction of Infant Bradycardia
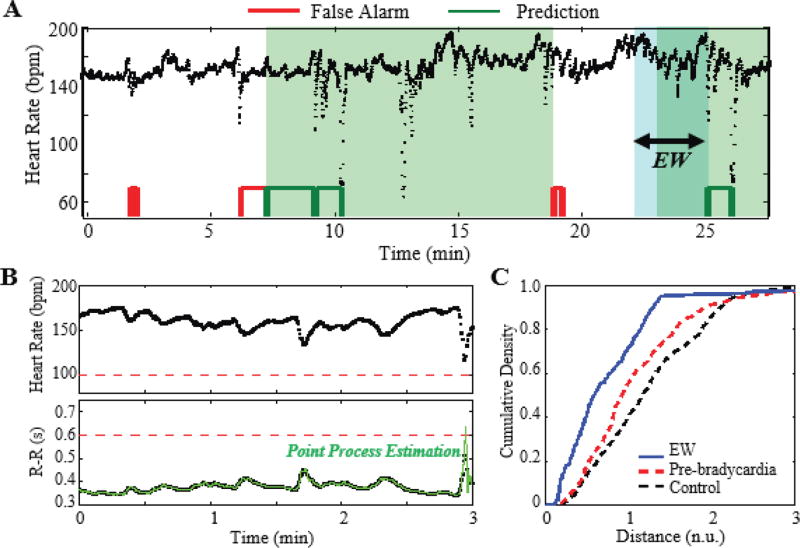
After generating a pre-bradycardia model for each subject, we evaluate the remainder of the ECG signals with the following algorithm parameters: ε = 3 min, δ = 5 s, τr = δ. Fig. 4a shows a sample evaluation of a 28-minute segment of discrete heart rates from infant 7. We observe a series of moderate bradycardias at time 10 and 25 min, and a collection of false and true prediction outcomes, red and green respectively. Within the evaluation window (the blue frame in Fig. 4a), instantaneous M(t) and V(t) estimates are computed (using II.B.) from the raw R-R intervals (Fig. 4b). The resulting CDC is then compared to an a priori infant-dependent model of pre-bradycardia events (Fig. 4c). For the example in Fig. 4a (threshold is set to 0.11 so that FPR is 0.15), the algorithm triggers predictions in multiple locations before the onset of moderate bradycardias with depths of 73 and 74 bpm. In this example, the algorithm successfully predicts the bradycardias in a 3-minute window prior to onset.
Fig. 4.
(a) Prediction outcome for Infant 7 (ε = 3 min, δ = 5 s, τr = δ). The instantaneous M(t) and V(t) indices from the evaluation window (EW, blue region) are calculated and used to predict bradycardia. The red and green blocks (bottom) denote false and positive predictions, respectively, at a FPR of 0.15. (b) The heart rate and inter-beat interval data are depicted as black, and the point process estimation is depicted as green. (c) A cumulative density curve for the evaluation window (blue curve) is compared to the training models. In this instance, the evaluation curve satisfies a threshold to trigger a prediction.
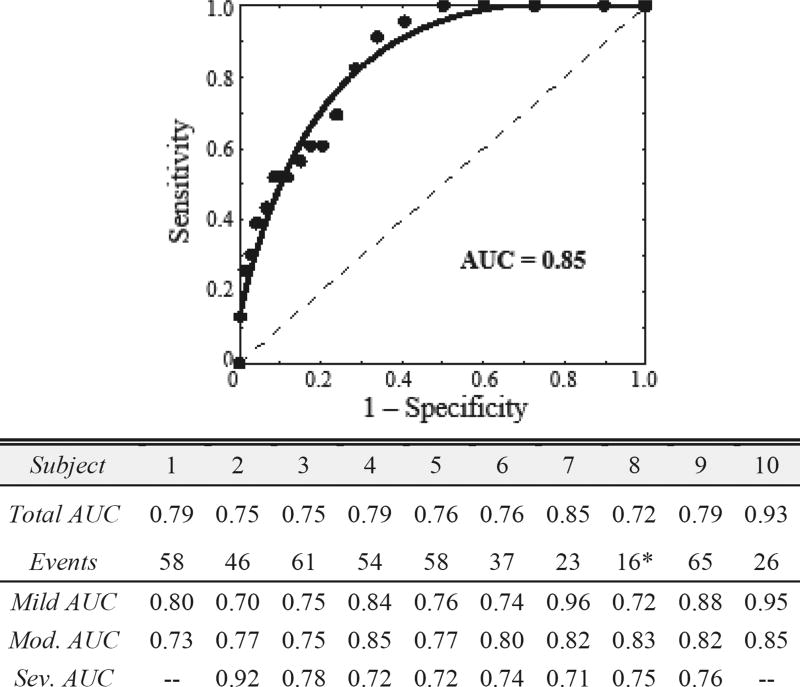
To evaluate the algorithm, we investigate the ROC curve by varying the detection threshold in (8) by increments of 0.01. We evaluate the predictive capability for all bradycardia, as clinical practice does not differentiate between severities. Fig. 5 depicts the ROC curve for infant 7. Using sensitivity and specificity defined in Section II.E., we observe an AUC of 0.85 for infant 7. Collectively, we achieve a mean AUC of 0.79±0.018 a.u. for a total of 444 bradycardia events with a range of AUC values from 0.72 to 0.93. We also observe mean AUCs for mild bradycardia of 0.81±0.09 a.u., for moderate of 0.80±0.04 a.u., and for severe of 0.76±0.07 a.u. This suggests that the usage of two instantaneous measures, M(t) and V(t), for advanced prediction of bradycardias is consistent across infants. Since AUC values of 0.5 depict a random classifier, we observe utility in predicting bradycardia with only two linear, instantaneous features in the proposed framework.
Fig. 5.
ROC curve for infant 7. The dashed line represents an algorithm preforming by chance (AUC of 0.5). We observe a mean AUC of 0.79±0.018 for 444 bradycardia events. The severity performance is also given. Note “—“ denotes no events. *Infant 8 exhibited frequent single skipped-beat episodes that led to instantaneous bradycardia.
B. Analysis of Prediction Algorithm
As one common mechanism in humans is cardio-respiratory coupling, we investigate whether predicted bradycardias are associated with preceding apnea. For a baseline comparison, we looked at a statistical approach of using apneas, gained from the respiration signal, as predictor for bradycardia. Using the same parameters (i.e. a 3-min observation window for bradycardia), we obtain a mean AUC of 0.67 for apneas greater than 5 seconds, and an AUC of 0.34 for apneas greater than 10 seconds. Additionally, at a FPR of 0.15, we find that, of the predicted bradycardias (215/444), 35% are associated with an apnea greater than 10 seconds, and 74% are associated with an apnea of at least 5 seconds. We observe that the prediction of bradycardia is independent of the presence of an apnea. Adding respiratory information as a covariate may improve heart rate estimation [37], and the effect of covariates can be explored in future prediction algorithm development.
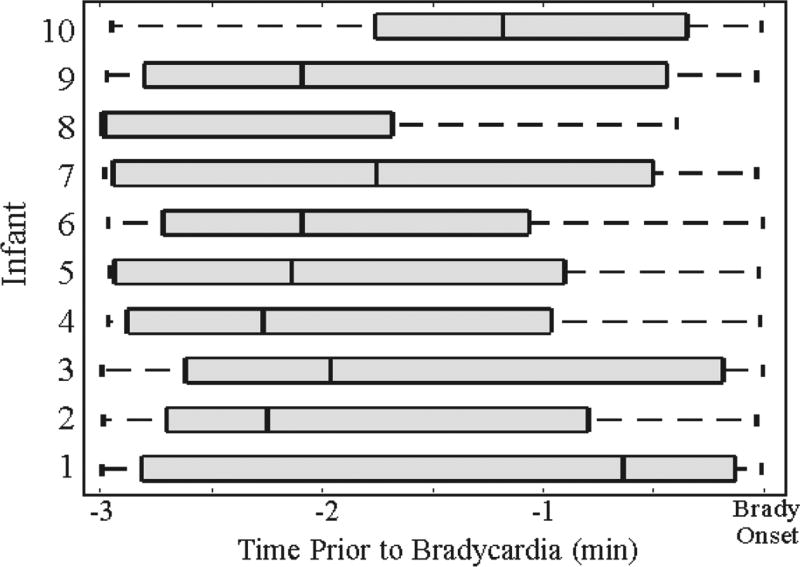
We next evaluate the first prediction time within a 3-minute window prior to bradycardia. This advanced warning time allows clinicians and medical staff to initiate intervention protocol before bradycardia onset. Looking at the quantile distribution of forecast times for a false positive rate of 0.15, we observe a mean prediction time of 116.2 seconds, with a range of median prediction times from 39 to 179 seconds (Fig. 6).
Fig. 6.
Quantile representation of the earliest prediction time in a 3-minute window preceding bradycardias. We observe a mean forecast time of 116 seconds across 10 infants.
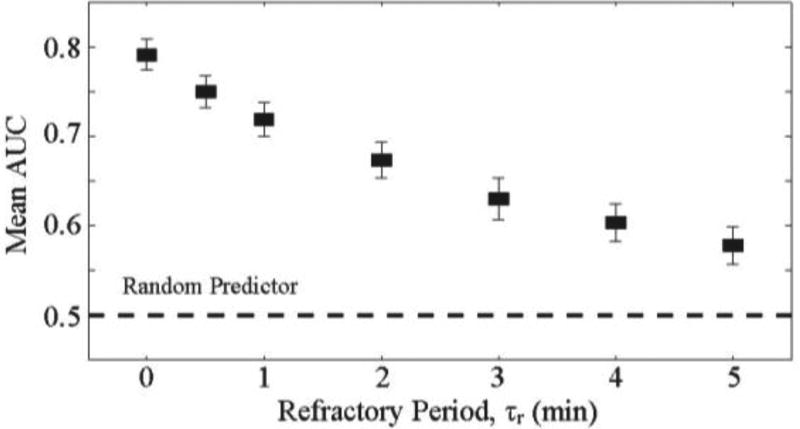
For clinical applications, we explore a refractory period after predictions to include a time lag for intervention or to account for the intervention itself. During these periods, subsequent predictions may not be useful. If a bradycardia occurs during the refractory period, the refractory period will still be classified as a true positive prediction. Alternatively, if no bradycardia occurs during the refractor period, the entire refractory time period will be attributed as false positive time. By instituting this refractory period, we observe a decrease in the mean AUC score. For example, if the duration of τr is 3 minutes, we see a decrease in mean AUC to 0.63 (Fig. 7). This suggests that instantaneous measurements of mean and variance may not be sufficient in predicting bradycardias with long refractory time frames (e.g. > 3-minutes). This all-or-nothing criteria may not be representative of the capability of the algorithm. To fully understand the implementation of a refractory period beyond a data-driven approach, a more robust understanding of the physiological mechanism driving bradycardia is needed.
Fig. 7.
Mean AUC of prediction algorithm with a varying refractory period. As the refractory period increases, the AUC decreases. There is a trade-off between the performance of the algorithm and the waiting time after predictions.
C. Increased Variance as a Feature of Bradycardia
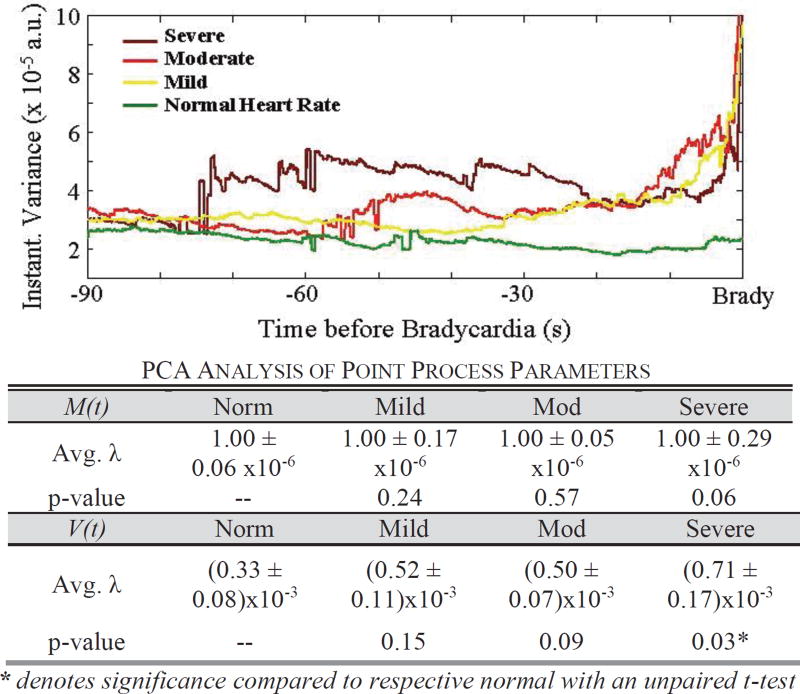
We investigate the influence of M(t) and V(t) on the predictive capability of the algorithm. In a 90-second window prior to bradycardia, we observe a temporal elevation of variance as bradycardia severity increases. The average instantaneous variance increases 80 seconds prior to severe bradycardia, while average variance prior to a mild bradycardia increases at 33 seconds (Fig. 8). To determine which parameter, M(t) or V(t), is important to the clustering feature used in the algorithm, we investigate the principal component of the M(t) and V(t) clusters. We observe that as severity increases, the scaling (i.e. eigenvalue λ) of the V(t) basis vectors becomes greater, while the scaling of the basis vector for M(t) remains the same (Fig. 8). We perform an unpaired t-test between all the eigenvalues with respect to their parameter. That is, we compare V(t) severe bradycardia λ to V(t) normal bradycardia λ, M(t) severe bradycardia λ to M(t) normal bradycardia λ, V(t) moderate λ to V(t) normal λ, etc. We observe statistical significance between V(t) of normal and severe segments (p-value = 0.03). This observation suggests that the clustering across bradycardia severity is due to the V(t) parameter.
Fig. 8.
We observe an increase in the average instantaneous variance measure just prior to bradycardia onset. The table details the average eigenvalues (λ) from PCA analysis of the (M(t), V(t)) clusters prior to bradycardias. We observe statistical significance between variance of normal and severe segments.
D. Physiological Impact of Increased Variance
We observe a statistical significance in variance between normal heart rate segments and segments prior to severe bradycardia. To understand the physiological implications of increased variance, we explore other linear and nonlinear features in severe bradycardia. The goal is to discover and implement other features into our instantaneous framework.
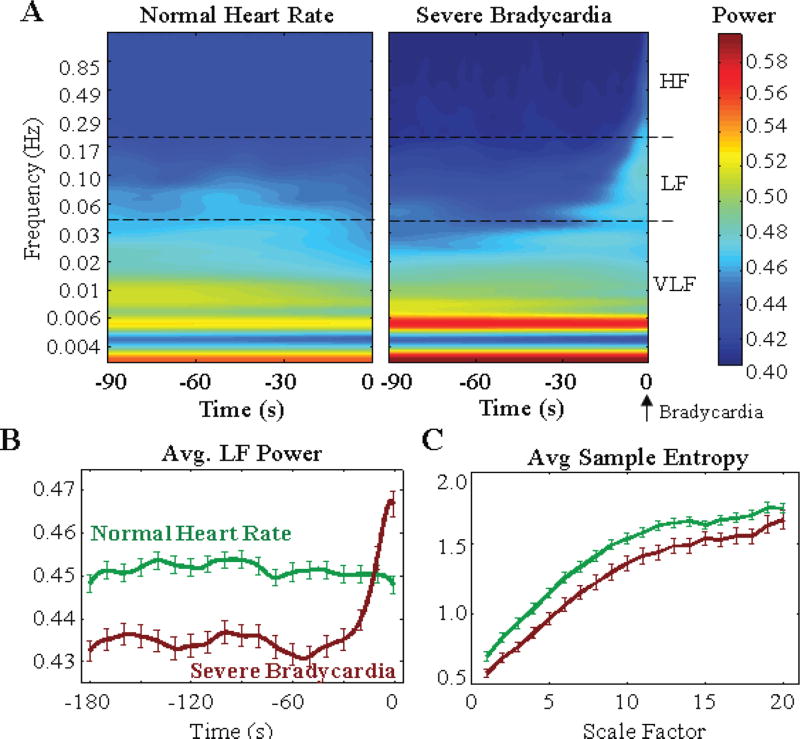
Using a parametric wavelet transform, we observe an average reduction of 3.3% in power for a region 90 seconds prior to severe bradycardia onset, when compared to normal segments in the LF spectrum (0.04– 0.2 Hz) (Fig. 9a). The decrease in LF content and increase in VLF content (Fig. 9a) equates to slowing of the heartbeat time series, and an elongation of the heart rate waveform just prior to bradycardia onset (Fig. 1). Severe bradycardias then exhibit a mean increase in power between 0.04 and 0.3 Hz (25 to 3 s, respectively) 20 seconds prior to onset, while normal segments exhibit a dispersion of power across the same LF range (Fig. 9b). In the same segments, sample entropy at the first time scale (raw data) and across all time scales (time averaged data) are lower in segments prior to severe bradycardia (Fig. 9c). Thus, we observe decreased complexity in segments prior to bradycardia.
Fig. 9.
(a) Temporal evolution of frequency content of R-R time series prior to bradycardia, with a Morlet wavelet transform. (b) Severe bradycardias exhibit decreased power in the LF content compared to normal heart rate segments. (c) We observe decreased sample entropy across all time scales.
Our findings of decreased entropy are consistent with previous studies on pathological neonatal heart conditions [27, 38]. The finding of decreased complexity aligns with the notion that pathological diseased conditions (e.g. congestive heart failure) exhibit apparent loss in multifractal complexity inherent in normal physiological systems [39]. We propose that bradycardia brings heart rate dynamics in the low frequency range, with increased variance, as generated by a nonlinear system with decreased complexity.
IV. Discussion
This study uses single channel ECG data to predict bradycardia events with a novel application of point process statistics that can be implemented in future prospective, real-time monitoring studies. Our key result shows that the heartbeat signal exhibits a rise in variance prior to episodes of severe bradycardia. This increase in variance is associated with low, complex power dynamics in LF content and low multiscale entropy values prior to bradycardia. Our findings suggest that point process analysis of ECG data is a powerful method for predicting bradycardia in individual infants. However, further research is needed to determine clinical utility in a larger population of preterm infants and to determine if the analytic framework is valid across a wider range of infant ages, weights, and co-morbidities.
One study [27] showed a progressive decrease of power in LF (0–0.2 Hz) just prior to bradycardia onset (< 80 bpm) in one example. Although we observe lower power content in LF for severe bradycardia when compared to normal heart rate (Fig. 9b), we observe a sharp increase in LF content 20 seconds prior to bradycardia from an average of 29 severe events. This increase in power is consistent with our observation of increased variance (Fig. 8). In the future, we can incorporate instantaneous frequency, as well as HRV measures from pole analysis [31] and complexity (e.g. the instantaneous Lyapunov exponents [40] and entropy [41]) into the prediction algorithm.
So far we have considered only two instantaneous point process measures, M(t) and V(t), from ECG to demonstrate a framework for bradycardia prediction. To improve the accuracy, other known precursors of bradycardia should be considered, e.g., apnea-based features. In our study, apnea from the respiratory signal is a relatively poor predictor of bradycardia (see section III.B.). Although respiratory monitoring using chest wall impedance is routinely performed in the NICU, this signal fails to detect apnea during gross movement or airway obstruction, and apneas are often unaccompanied by bradycardia. For future work, other methods to detect apnea events [42] might be considered, including ECG-derived respiration [43, 44]. More analysis is needed to determine whether inclusion of other physiological signals would improve predictive utility, even though respiration improves point process estimation of heart rate [37].
Additionally, we can investigate ways to improve our implementation. The cumulative density metric used in the study is a simplistic approach to characterize high densities of normalized M(t) and V(t) pairs as a function of distance from the overall cluster. We can explore other characterizations of point process patterns, like computing spike-time distances and evaluating the temporal changes in the point process estimates [45,46], and use other frameworks like machine learning [13,19, 20] for predicting cardiorespiratory events.
V. Conclusion
We present a novel framework for near-term prediction of bradycardia in preterm infants. We apply point process theory to heart rate and generate linear, instantaneous estimates for ten preterm infants. The point process dynamics just prior to bradycardia onset indicate an increase in variance (Fig. 8). Across our data set of ten infants, we achieve prediction capability (AUC of 0.79±0.018) for 444 bradycardia events (Fig. 5). These result demonstrate the ability to predict the majority of bradycardias with an average of 116 seconds by using an ECG signal alone.
Improved prediction outcomes can eventually lead to automated, therapeutic intervention to reduce morbidity and mortality associated with bradycardia and prematurity, like apnea and hypoxia [16, 17], and help direct medical attention toward high-risk infants. The current nursing protocol is to initiate manual stimulation after bradycardia has already started. This protocol leaves little time for full antiseptic procedure (e.g., hand wash and gown change), and could promote risk of transmission of infectious agents (e.g. MRSA) due to insufficient time to properly decontaminate. Advanced warning would allow sufficient time to implement the nursing protocol. In the future, an automated advanced warning system could provide a signal for a closed-loop systems that triggers a preventive intervention, such as a sub-arousal stochastic vibration via the infant’s mattress [16, 17]. The framework proposed in this manuscript provides a prospective method for automated monitoring of infants and risk stratification. Thus, incorporating other instantaneous features in the proposed framework is important for devising a robust real-time warning system to improve quality of life for infants in the NICU.
TABLE 2.
Parameters for Prediction Algorithm
| Symbol | Quantity | Description | Value |
|---|---|---|---|
| ε | Length of Evaluation Window | Window of point process indices | 3 min |
| δ | Window Increment | Time increment for sliding ε | 5 s |
| τr | Refractory Period | No predictions made | [δ 5 min] |
| POS | Positive Bradycardia Region | Region around bradycardia | [x−3 x+6] min |
| NEG | Negative Bradycardia Region | Region with no bradycardia | All time not POS |
Acknowledgments
This work was supported in part by the Hansjörg Wyss Institute for Biologically Inspired Engineering at Harvard University, by the National Science Foundation (NSF) Smart and Connected Health (SCH) Grant #1401690, and by the National Institutes of Health (NIH) R01 GM104987.
The authors thank Courtney Temple and Ian Zuzarte for data collection, John Osborne and the Wyss Institute for providing VueLogger™, and the reviewers for critical review.
R. Barbieri, D. Paydarfar, and P. Indic are co-inventors of the Wyss Institute’s neonatal stochastic resonance delivery system, patent WO 2013033433. The methods for monitoring physiological signals, which include using point process to model heartbeat intervals, are also included in the patent. This patent was licensed in 2014 by Harvard University to SR-Bio, Inc., a Delaware Corporation.
Footnotes
A. H. Gee has no financial interests to disclose. All authors have no financial stake (equity, stock, or income) in SR-Bio, Inc.
Contributor Information
Alan H. Gee, Wyss Institute at Harvard University, Boston, MA. He is currently with the Department of Electrical and Computer Engineering, and Dept. of Neurology, Dell Medical School, The University of Texas at Austin, Austin, TX, USA.
Riccardo Barbieri, Department of Electronics, Information and Bioengineering, Politecnico di Milano, Milano, Italy, and with the Dept. of Anesthesia, Critical Care, and Pain Medicine, Massachusetts General Hospital, Harvard Medical School, Boston, MA, USA.
David Paydarfar, Department of Neurology, University of Massachusetts Medical School and the Wyss Institute. He is currently with the Dept. of Neurology, Dell Medical School, The University of Texas at Austin.
Premananda Indic, Department of Neurology, University of Massachusetts Medical School. He is now with the Dept. of Electrical Engineering, The University of Texas at Tyler, Tyler, TX, USA.
References
- 1.Janvier A, et al. Apnea is associated with neurodevelopmental impairment in very low birth weight infants. J Perinatol. 2004;24:763–8. doi: 10.1038/sj.jp.7211182. [DOI] [PubMed] [Google Scholar]
- 2.Serenius F, et al. Neurodevelopmental outcome in extremely preterm infants at 2.5 years after active perinatal care in Sweden. JAMA. 2013;309:1810–20. doi: 10.1001/jama.2013.3786. [DOI] [PubMed] [Google Scholar]
- 3.Aylward GP. Neurodevelopmental outcomes of infants born prematurely. J Dev Behav Pediatr. 2014 Jul-Aug;35:394–407. doi: 10.1097/01.DBP.0000452240.39511.d4. [DOI] [PubMed] [Google Scholar]
- 4.Martin RJ, Wilson CG. Apnea of Prematurity. Compr Physiol. 2012;2:2923–2931. doi: 10.1002/cphy.c100021. [DOI] [PubMed] [Google Scholar]
- 5.Vyas H, et al. Relationship between apnoea and bradycardia in preterm infants. Acta Paediatr Scand. 1981 Nov;70:785–90. doi: 10.1111/j.1651-2227.1981.tb06229.x. [DOI] [PubMed] [Google Scholar]
- 6.Henderson-Smart DJ, et al. Incidence and mechanism of bradycardia during apnoea in preterm infants. Arch Dis Child. 1986;61:227–32. doi: 10.1136/adc.61.3.227. [DOI] [PMC free article] [PubMed] [Google Scholar]
- 7.Upton CJ, et al. Episodic bradycardia in preterm infants. Arch Dis Child. 1992;67:831–4. doi: 10.1136/adc.67.7_spec_no.831. [DOI] [PMC free article] [PubMed] [Google Scholar]
- 8.Southall DP, et al. Undetected episodes of prolonged apnea and severe bradycardia in preterm infants. Pediatr. 1983 Oct;72:541–51. [PubMed] [Google Scholar]
- 9.Perlman JM, Volpe JJ. Episodes of apnea and bradycardia in the preterm newborn: impact on cerebral circulation. Pediatr. 1985;76:333–8. [PubMed] [Google Scholar]
- 10.Livera LN, et al. Effects of hypoxaemia and bradycardia on neonatal cerebral haemodynamics. Arch Dis Child. 1991 Apr;66:376–80. doi: 10.1136/adc.66.4_spec_no.376. [DOI] [PMC free article] [PubMed] [Google Scholar]
- 11.Pichler G, et al. Impact of bradycardia on cerebral oxygenation and cerebral blood volume during apnoea in preterm infants. Physiol Meas. 2003;24:671–80. doi: 10.1088/0967-3334/24/3/304. [DOI] [PubMed] [Google Scholar]
- 12.Schmid MB, et al. Cerebral oxygenation during intermittent hypoxemia and bradycardia in preterm infants. Neonatology. 2015;107:137–46. doi: 10.1159/000368294. [DOI] [PubMed] [Google Scholar]
- 13.Williamson JR, et al. Forecasting respiratory collapse: Theory and practice for averting life-threatening infant apneas. Respir Physiol Neurobiol. 2013;189:223–231. doi: 10.1016/j.resp.2013.05.034. [DOI] [PubMed] [Google Scholar]
- 14.Poets CF, et al. Association Between Intermittent Hypoxemia or Bradycardia and Late Death or Disability in Extremely Preterm Infants. JAMA. 2015;314:595–603. doi: 10.1001/jama.2015.8841. [DOI] [PubMed] [Google Scholar]
- 15.Di Fiore JM, et al. Cardiorespiratory events in preterm infants: interventions and consequences. J Perinatol. 2015 doi: 10.1038/jp.2015.165. [DOI] [PubMed] [Google Scholar]
- 16.Bloch-Salisbury E, et al. Stabilizing immature breathing patterns of preterm infants using stochastic mechanosensory stimulation. J Appl Physiol. 2009;107:1017–27. doi: 10.1152/japplphysiol.00058.2009. [DOI] [PMC free article] [PubMed] [Google Scholar]
- 17.Smith VC, et al. Stochastic Resonance Effects on Apnea, Bradycardia, and Oxygenation: A Randomized Controlled Trial. Pediatr. 2015;136:e1561–8. doi: 10.1542/peds.2015-1334. [DOI] [PMC free article] [PubMed] [Google Scholar]
- 18.Thommandram A, et al. A rule-based temporal analysis method for online health analytics and its application for real-time detection of neonatal spells. Proc. IEEE Int. Congr. Big Data. 2014:470–477. [Google Scholar]
- 19.Shirwaikar RD, et al. Machine Learning Techniques for Neonatal Apnea Prediction. J. Artif. Intel. 2016;9(1–3):33–38. [Google Scholar]
- 20.Williamson JR, et al. Individualized apnea prediction in preterm infants using cardio-respiratory and movement signals. IEEE Body sensor Networks; Cambridge, MA: 2013. pp. 1–6. [Google Scholar]
- 21.Paydarfar D, Buerkel DM. Sleep Science: Integrating Basic Research and Clinical Practice. Basel: Karger; Karger: 1997. Collapse of homeostasis during sleep; pp. 60–85. [Google Scholar]
- 22.Glass L. Synchronization and rhythmic processes in physiology. Nature. 2001;410:277–284. doi: 10.1038/35065745. [DOI] [PubMed] [Google Scholar]
- 23.Karemaker JM, Wesseling KH. Variability in cardiovascular control: the baroreflex reconsidered. Cardio. Eng. 2008;8:23–9. doi: 10.1007/s10558-007-9046-4. [DOI] [PubMed] [Google Scholar]
- 24.Landesberg G, et al. Step baroreflex response in awake patients undergoing carotid surgery: time-and frequency-domain analysis. Am J Physiol Heart Circ Physio. 1998;274:H1590–H1597. doi: 10.1152/ajpheart.1998.274.5.H1590. [DOI] [PubMed] [Google Scholar]
- 25.Legramante JM, et al. Investigating feed-forward neural regulation of circulation from analysis of spontaneous arterial pressure and heart rate fluctuations. Circulation. 1999;99:1760–1766. doi: 10.1161/01.cir.99.13.1760. [DOI] [PubMed] [Google Scholar]
- 26.Ketch T, et al. Four faces of baroreflex failure hypertensive crisis, volatile hypertension, orthostatic tachycardia, and malignant vagotonia. Circulation. 2002;105:2518–2523. doi: 10.1161/01.cir.0000017186.52382.f4. [DOI] [PubMed] [Google Scholar]
- 27.Pravisani G, et al. Short term prediction of severe bradycardia in premature newborns. Comput Cardiol. 2003:725–728. [Google Scholar]
- 28.Meny RG, et al. Cardiorespiratory recordings from infants dying suddenly and unexpectedly at home. Pediatr. 1994;93:44–49. [PubMed] [Google Scholar]
- 29.Brown EN, et al. The time-rescaling theorem and its application to neural spike train data analysis. Neural Comput. 2002;14:325–46. doi: 10.1162/08997660252741149. [DOI] [PubMed] [Google Scholar]
- 30.Barbieri R, et al. A point-process model of human heartbeat intervals: new definitions of heart rate and heart rate variability. Am J Physiol Heart Circ Physiol. 2005;288:H424–35. doi: 10.1152/ajpheart.00482.2003. [DOI] [PubMed] [Google Scholar]
- 31.Indic P, et al. Point Process Modeling of Interbreath Interval: A New Approach for the Assessment of Instability of Breathing in Neonates. IEEE Trans. Biomed. Eng. 2013;60:2858–2866. doi: 10.1109/TBME.2013.2264162. [DOI] [PMC free article] [PubMed] [Google Scholar]
- 32.Valenza G, et al. Inhomogeneous point-process entropy: An instantaneous measure of complexity in discrete systems. Physical Review E. 2014;89 doi: 10.1103/PhysRevE.89.052803. [DOI] [PubMed] [Google Scholar]
- 33.Gee AH, et al. IEEE Eng. Med. Biol. Milan; Italy: 2015. Uncovering statistical features of bradycardia severity in premature infants using a point process model; pp. 5855–5858. [DOI] [PubMed] [Google Scholar]
- 34.Barbieri R, Brown EN. Application of dynamic point process models to cardiovascular control. Biosystems. 2008;93:120–5. doi: 10.1016/j.biosystems.2008.03.011. [DOI] [PMC free article] [PubMed] [Google Scholar]
- 35.Torrence C, Compo GP. A practical guide to wavelet analysis. Bull. Amer. Meteor. Soc. 1998;79:61–78. [Google Scholar]
- 36.Costa M, et al. Multiscale entropy analysis of biological signals. Phys Rev E Stat Nonlin Soft Matter Phys. 2005;71:021906. doi: 10.1103/PhysRevE.71.021906. [DOI] [PubMed] [Google Scholar]
- 37.Gee AH, et al. IEEE Eng. Med. Biol. Orlando, FL: 2016. Improving Heart Rate Estimation in Preterm Infants with Bivariate Point Process Analysis of Heart Rate and Respiration; pp. 920–23. [DOI] [PubMed] [Google Scholar]
- 38.Lake DE, et al. Sample entropy analysis of neonatal heart rate variability. Am J Physiol Regul Integr Comp Physiol. 2002;283:R789–97. doi: 10.1152/ajpregu.00069.2002. [DOI] [PubMed] [Google Scholar]
- 39.Goldberger AL, et al. Fractal dynamics in physiology: alterations with disease and aging. Proc Natl Acad Sci USA. 2002;99(Suppl 1):2466–72. doi: 10.1073/pnas.012579499. [DOI] [PMC free article] [PubMed] [Google Scholar]
- 40.Valenza G, et al. Estimation of instantaneous complex dynamics through Lyapunov exponents: a study on heartbeat dynamics. PLoS One. 2014;9:e105622. doi: 10.1371/journal.pone.0105622. [DOI] [PMC free article] [PubMed] [Google Scholar]
- 41.Valenza G, et al. Instantaneous monitoring of heart beat dynamics during anesthesia and sedation. J Comput Surg. 2014;3:1–18. [Google Scholar]
- 42.Daw W, et al. Medical Devices for Measuring Respiratory Rate in Children: a Review. J Adv. in Biomed. Engi. Tech. 2016;3:21–27. [Google Scholar]
- 43.Moody G, et al. Derivation of Respiratory Signals from Multi-lead ECGs. Comput Cardiol. 1985;12:113–116. [Google Scholar]
- 44.Helfenbein E, et al. Development of three methods for extracting respiration from the surface ECG: a review. J Electrocardiol. 2014;47(6):819–25. doi: 10.1016/j.jelectrocard.2014.07.020. [DOI] [PubMed] [Google Scholar]
- 45.Diez DM, et al. Algorithms for computing spike time distance and point process prototypes with application to feline neuronal responses to acoustic stimuli. J. Neurosci. Methods. 2012;203:186–192. doi: 10.1016/j.jneumeth.2011.08.043. [DOI] [PubMed] [Google Scholar]
- 46.Victor JD, Purpura KP. Metric-space analysis of spike trains: theory, algorithms and application. Network: computation in neural systems. 1997;8:127–164. [Google Scholar]


