Abstract
Objectives:
To investigate the relationship between dose and image quality for a dedicated dental CBCT scanner using different scanning protocols and to set up an optimal imaging protocol for assessment of periodontal structures.
Methods:
Radiation dose and image quality measurements were made using 3D Accuitomo 170 (J. Morita, Kyoto, Japan) dental CBCT scanner. The SedentexCT IQ phantom was used to investigate the relationship between contrast-to-noise ratio (CNR) and dose–area product. Subjective image quality assessment was achieved using a small adult skull phantom for the same range of exposure settings. Five independent observers assessed the images for three anatomical landmarks using a three-point visual grade analysis.
Results:
When correlating the CNR of each scanning protocol to the exposure parameters used to obtain it, CNR decreased as these parameters decreased, especially current–exposure time product. When correlating to subjective image quality, the CNR level remained acceptable when 5 mA and 17.5 s or greater was selected and 80 kV could be used without compromising the CNR.
Conclusions:
For a dedicated CBCT unit, changing the rotation angle from 360° to 180° degrades image quality. By altering tube potential and current for the 360° rotation protocol, assessment of periodontal structures can be performed with a smaller dose without substantially affecting visualization.
Keywords: CBCT, periapical tissue, phantoms, imaging, radiation dosage, three-dimensional imaging
Introduction
CBCT has become an important imaging technique in dental and maxillofacial radiology and replaces, or adds to, conventional radiography in several diagnostic tasks in the maxillofacial area. The increased use of CBCT and the fact that radiation doses from CBCT examinations are generally higher than those from conventional radiography will result in an increase in the radiation dose to which patients are exposed.1,2 This is a matter of concern and must be taken into consideration especially for paediatric patients, as they are more sensitive to radiation than adult patients.3,4
It is not only the use of CBCT that has increased dramatically in recent years; the number of CBCT units available from different manufacturers has also significantly increased.5 The many scanning options offered by these new units make it a challenge to choose the optimal scanning protocol parameters to achieve sufficient image quality for a given diagnostic imaging task. The recent advances in CBCT technology have suggested several dose reduction strategies, such as decreasing the field of view (FOV) dimensions and tube current–time product (mAs).6 However, when scanning radiation dose decreases, the image quality might be degraded and it is therefore important to perform the examination using doses that are as low as diagnostically acceptable (ALADA), while still being consistent with the diagnostic imaging task.7,8
Even though studies have been performed on reducing exposure factors without loss of adequate image quality for different diagnostic tasks, few studies and limited data are currently available on both physical factors (objective) and subjective image quality related to the radiation dose of CBCT.9–11 Hidalgo Rivas et al12 suggested a low-dose protocol for CBCT examinations of the anterior maxilla in children and images were classified as acceptable/not acceptable related to a number of different diagnostic tasks and different exposure conditions. In a study by Choi et al,13 the relationship between physical factors and subjective image quality was investigated but without any dose measurements.
Diagnostic information on the marginal bone tissue as well as on the periodontal space along the roots has usually been obtained from periapical and/or panoramic radiographs.14–16 With the introduction of CBCT, a possibility to detect these structures in the buccolingual direction also has opened up and CBCT has been used to evaluate the alveolar bone level and periodontal space in order to eliminate the image distortion and tissue overlapping of two-dimensional radiography.9,17–19 Even though CBCT is not recommended as a routine method for imaging the periodontal bone tissue, its use might be indicated in situations where clinical and conventional radiographic examinations do not provide the information needed for management,20 as well as for evaluating the long-term effects of treatment.21,22 The aim of this study was therefore to investigate the relationship between dose and image quality for a dedicated CBCT scanner using different scanning protocols and to set up an optimal imaging protocol for periodontal structure examination.
Methods and materials
CBCT equipment and scanning protocols
All CBCT images were obtained with a 3D Accuitomo 170 (J. Morita, Kyoto, Japan) unit, using 12 scanning protocols for a range of tube voltages, tube currents (mA) and trajectory arcs. The X-ray tube voltage options were 80 kV or 90 kV and the X-ray mA options were 3 mA, 5 mA or 9 mA. Full-rotation (360°) or half-rotation (180°) scans were used. A standard acquisition mode with an FOV of 8 cm (diameter) × 8 cm (height) and 160-μm voxel size was chosen. Details of the scanning protocols are shown in Table 1. The unit was equipped with a calculated dose–area product (DAP) value monitor.
Table 1.
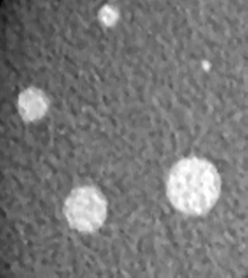
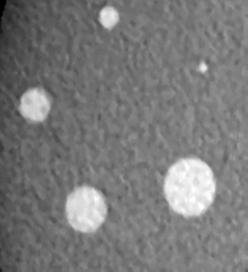
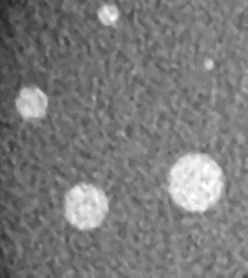
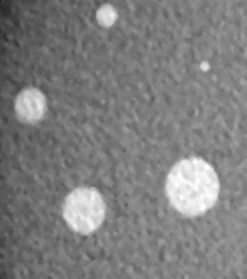
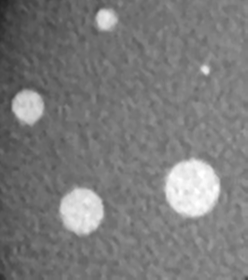
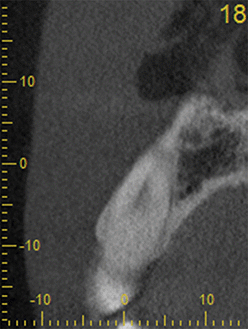
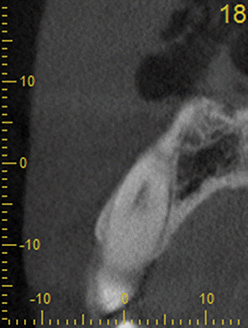
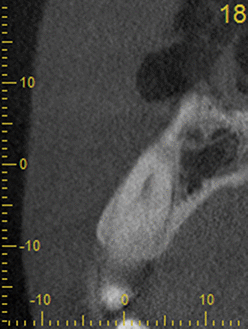
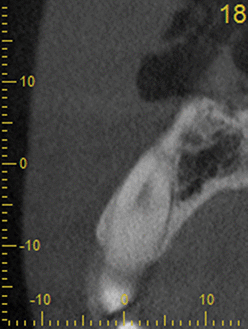
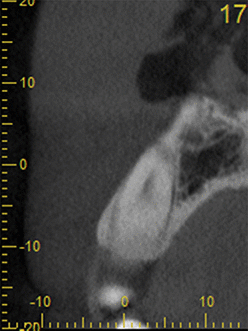
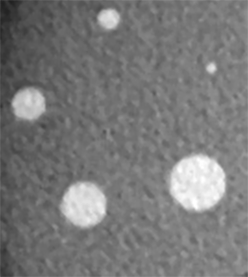
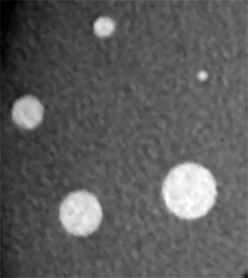
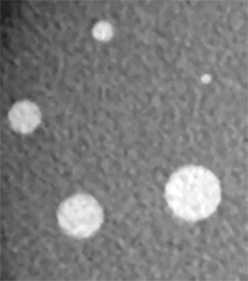
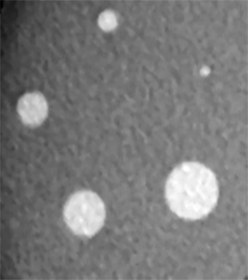
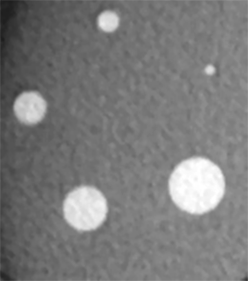
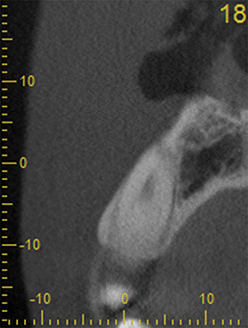
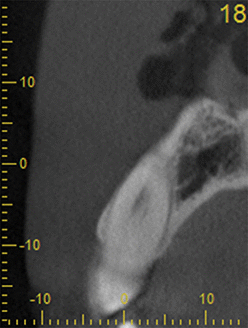
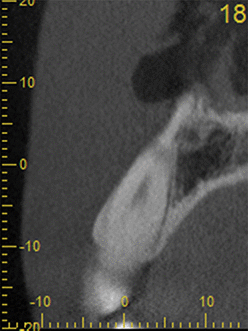
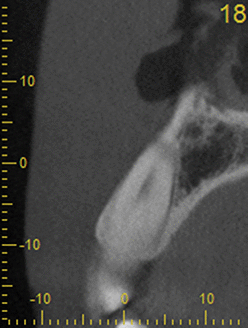
CBCT technical specification, dose–area product (DAP) values measured in mGy cm2 and examples of images for different scanning protocols
| Protocol number | 1 | 2 | 3 | 4 | 5 | 6 |
|---|---|---|---|---|---|---|
| kV | 80 | 80 | 80 | 90 | 90 | 90 |
| mA | 3 | 5 | 9 | 3 | 5 | 9 |
| s | 9 |
|||||
| Rotation angle | 180° |
|||||
| Frames per second | 30 |
|||||
| Basis images | 270 |
|||||
| Calculated DAP (mGy.cm2) of unit console | 308 | 510 | 914 | 407 | 673 | 1210 |
| Measured DAP (mGy.cm2) of DAP meter | 268.0 ± 2.03 | 444.8 ± 1.16 | 768.0 ± 9.38 | 342.0 ± 3.20 | 563.4 ± 5.46 | 983.4 ± 17.04 |
| SEDENTEXCT phantom images | 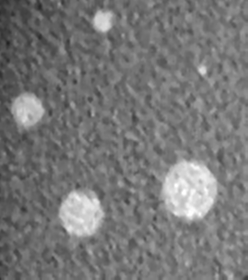 |
 |
 |
 |
 |
 |
| Rando phantom images | 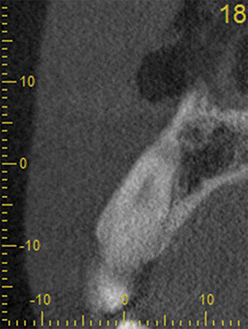 |
 |
 |
 |
 |
 |
| Protocol number | 7 | 8 | 9 | 10 | 11 | 12 |
| kV | 80 | 80 | 80 | 90 | 90 | 90 |
| mA | 3 | 5 | 9 | 3 | 5 | 9 |
| s | 17.5 |
|||||
| Rotation angle | 360° |
|||||
| Frames per second | 30 |
|||||
| Basis images | 525 |
|||||
| Calculated DAP (mGy.cm2) of unit console | 599 | 992 | 1780 | 791 | 1310 | 2350 |
| Measured DAP (mGy.cm2) of DAP meter | 526.0 ± 5.23 | 853.6 ± 13.18 | 1505.6 ± 22.6 | 664.4 ± 11.21 | 1097.8 ± 15.87 | 1935.8 ± 26.99 |
| SEDENTEXCT phantom images | 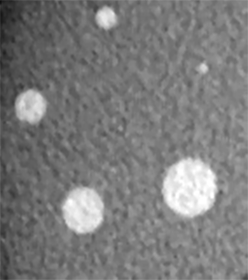 |
 |
 |
 |
 |
 |
| Rando phantom images | 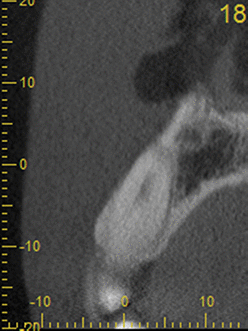 |
 |
 |
 |
 |
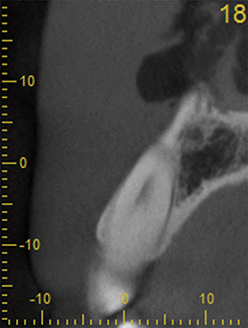 |
kV, tube potential; mA, tube current; s, second.
Dose measurements
For all scanning protocols, DAP values, expressed in milligray square centimetre, were obtained by attaching an ion chamber of a DAP meter (VacuDAP meter; VacuTec Messtechnik GmbH, Dresden, Germany) to the centre of the beam output and at the same time, the automatically calculated DAP values were recorded from the CBCT unit console. The DAP meter with an active area of 14.7 × 14.7 cm fully intercepted the investigated FOV. DAP values were obtained five times for each scanning protocol in order to evaluate the constancy of the unit performance.
Objective measurement of image quality
The SedentexCT IQ cylindrical phantom (Leeds Test Objects Ltd, Boroughbridge, UK), a dedicated dental CBCT image quality phantom, was used. The phantom is 176 mm in height and 160 mm in diameter. There are five contrast resolution inserts with different materials [aluminium (Al), polytetrafluoroethylene (PTFE), low density polyethylene (LDPE), air and delrin]. The Al insert simulates dentin density, the PTFE insert simulates dense bone, the low-density polyethylene insert simulates soft tissues and air simulates air cavities. All the inserts were placed at the same level of the phantom and the rest of the phantom columns were filled with poly methyl methacrylate (PMMA) inserts for simulating the total mass of a head. The phantom was mounted on a rigid tripod and scanned once to take an image of each contrast resolution insert. The target inserts were placed at the periphery, as the FOV is positioned more towards the periphery of the patient head. More specifications and images of this phantom can be found at www.leedstestobjects.com.
To measure the contrast-to-noise ratio (CNR) metric of image quality for the images of the IQ phantom, The images were transferred as digital imaging and communications in medicine files (DICOM) from the CBCT workstation computer to the Image J (National Institutes of Health, Bethesda, MD) software. By using Image J tools, a circular region of interest (ROI) was drawn inside the big rod of each insert and the same ROI was drawn for PMMA as a background. For each ROI, the mean grey value and standard deviation (SD) were measured in triplicate and the average was used for CNR calculation. Care was taken to ensure that all measurements, from different scanning protocols, were performed in the same order and number of image series.
CNR for each scanning protocol was calculated using the following formula:
where MPV is the mean pixel value and SD is the standard deviation.
Subjective assessment of image quality
The examination of the upper and lower jaw together (FOV 8 × 8 cm) was performed on a RANDO skull phantom (RANDO®; The Phantom Laboratory, Salem, NY) consisting of a human skull and upper cervical vertebrae. In order to simulate a small male adult patient, the additional material used in the phantom had a density equivalent to that of a biological tissue.
The phantom was set on the phantom table of the unit and was centred with the jaws in the imaging area and scanned once to obtain an image of each scanning protocol. A radiographer trained to work with CBCT imaging positioned the phantom so as to reproduce as closely as possible the real clinical conditions. 12 scans were performed, 1 scan for each of the exposure scenarios in Table 1. These alterations were performed without moving the phantom in order to ensure maximum consistency throughout the imaging process.
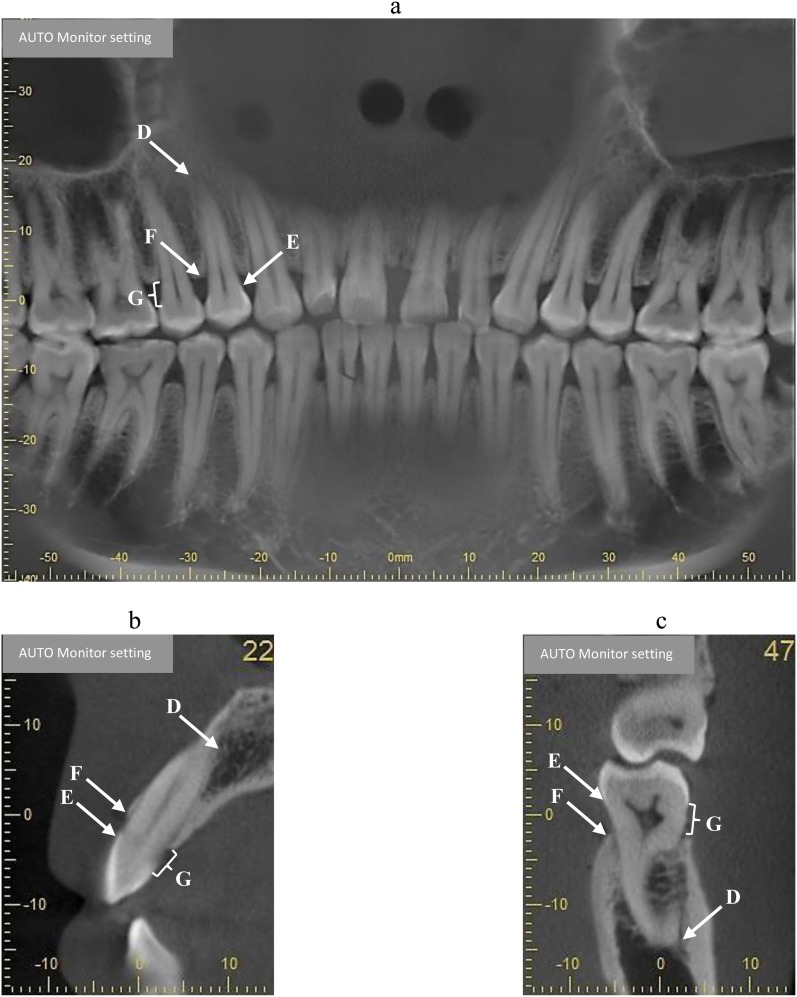
12 CBCT volumes were stored in DICOM format and assessed with i-Dixel software on a workstation. A BARCO (MFGD 1318; BARCO, Kortrijk, Belgium) 18.1″ greyscale liquid crystal display monitor was used with a luminance of 400 cd/m2 and resolution of 1280 × 1024 pixels. Subjective evaluation of image quality was performed over a period of 8 weeks by five observers with different professions and experience. Two were specialists in dental and maxillofacial radiology with 25 and 30 years' experience in radiology, respectively. One observer was a specialist in orthodontics with 8 years' experience and the two remaining observers were trainees in dental and maxillofacial radiology and oral surgery, respectively. All observers were familiar with CBCT images. To ensure a standardized comparison, the observers were not allowed to adjust brightness and contrast settings or the reconstruction views. The observers were aware of the purpose of the study but were blinded to the volume acquisition parameters and dose-related data. In order to get standardized comparisons, reformatted images were pre-prepared by the researcher in charge of the project and these images were assessed in random order to avoid potential bias. To get the same anatomical section, firstly an adjustment of the xyz images of all protocols according to the same level was performed. After that, the centre of each tooth in the axial view was marked to create a curved multiplanar reformation, which includes oblique, curved planar reformation (distortion-free panoramic images) and serial transplanar reformation (providing cross-sections) (Figure 1).
Figure 1.
Reformatted panoramic (a) and cross-sectional (b, c) images used for visual grading analysis of anatomical landmarks scoring and measurements of the distance between the marginal bone crest (MBC) and the cementoenamel junction (CEJ). D, apical third of periodontal space; E, CEJ; F, MBC; G, distance between MBC and CEJ.
The observation room illumination was dim (below 50 lux as recommended by American Association of Physicists in Medicine Task Group 18) and kept constant.25 The reading distance was approximately 60 cm. There were no restrictions on observation time and zooming was allowed.
The visibility of three dental anatomical landmarks was assessed using visual grade analysis with all images graded separately within each protocol. The following landmarks were assessed: the apical third of periodontal space (ATPS), the cementoenamel junction (CEJ) and the marginal bone crest (MBC) of all upper right and lower left quadrant teeth, 17–11 and 37–31, respectively. For multirooted teeth in the upper jaw, the palatal roots were chosen; for multirooted teeth in the lower jaw, the distal root was chosen. Altogether, 168 sites for assessment were available in each protocol (14 teeth × 3 anatomical landmarks × 4 sites). A three-point rating scale (0 = hardly visible, 1 = partly visible and 2 = well visible) was used to assess the visibility (Figure 1). In addition, the observers measured the distance between the CEJ and MBC at all sites. Grading of landmarks and measurements were performed using panoramic reformatted images for mesial and distal sites and using multiplanar reformatted (sagittal plane) images for buccal and palatal/lingual bone sites. All images were evaluated at 1-mm slice thickness.
Prior to the first observation, all observers attended a training session. The aim was to familiarize the observers with the imaging display software and scoring scale. At the first observation session, all the included images were read. In order to calculate intraobserver agreement, a second observation session was held for a random selection of teeth (21%). This session was held more than 3 weeks after the first session in order to minimize reader recall bias.
Data analysis
Interobserver and intraobserver agreement of subjective image quality assessment was calculated by using the kappa (k) test as described by Altman.26 Levels of agreement on k values were interpreted as suggested by Altman: k = 0.81–1.00, excellent; k = 0.61–0.80, good; k = 0.41–0.60, moderate; k = 0.20–0.40, fair; k < 0.20, poor.
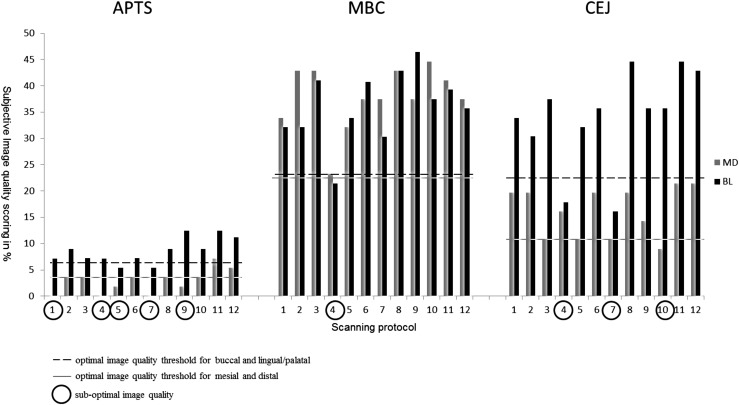
Evaluation of subjective image quality was based on calculations of observations, where all included observers had given a grade of 1 or 2 on the visual grade analysis scale for all assessments of an anatomical landmark. Assessments where a grade of 0 was given for any site by any observer were excluded. An example of assessments performed by all observers of the anatomical landmark ATPS is shown in Table 2. It was possible to assess 4 sites on each of the 14 teeth for the ATPS in each protocol, resulting in 56 possible assessments of this landmark for each observer. Only the sites where no observer graded 0 were taken into account. As shown in Table 2, only three sites had no 0 grading in Protocol 1 and for Protocol 8, the corresponding figure was 7. Hence, image quality scoring for Protocols 1 and 8 was calculated to be 5.35% (3/56) and 12.5% (7/56), respectively. In the next step, the same calculation was made for each protocol and landmark (Figure 2), where the subjective image quality was scored in percentage. The threshold for acceptable (optimal) image quality was thereafter determined by excluding all images assessed below the half-value of the highest image quality scoring for all anatomical landmarks in all tooth aspects (mesial, distal, buccal and lingual/palatal) together, taking all observer assessments into account (Figure 2). Binary logistic regression analysis was performed to evaluate the CNR values from each test insert material from each scanning protocol to determine which, if any, was more related to acceptable (optimal) subjective image quality. Optimization was based on the relation between objective and subjective image quality with exposure level (DAP value) taken into consideration.
Table 2.
Example of how optimal image quality was calculated, applied on the anatomical landmark apical third of periodontal space (ATPS) and the different sites (mesial, distal, buccal lingual) of this landmark that were assessed
| ATPS sites | |||||||||||||||||||||
|---|---|---|---|---|---|---|---|---|---|---|---|---|---|---|---|---|---|---|---|---|---|
| Mesial |
Distal |
Buccal |
Lingual |
||||||||||||||||||
| Observer |
Observer |
Observer |
Observer |
||||||||||||||||||
| Protocol number | Tooth | 1 | 2 | 3 | 4 | 5 | 1 | 2 | 3 | 4 | 5 | 1 | 2 | 3 | 4 | 5 | 1 | 2 | 3 | 4 | 5 |
| 1 | 11 | 0 | 0 | 0 | 0 | 0 | 0 | 0 | 0 | 0 | 0 | 0 | 0 | 0 | 1 | 0 | 2 | 2 | 2 | 2 | 2 |
| 1 | 12 | 0 | 0 | 0 | 0 | 0 | 1 | 0 | 0 | 0 | 0 | 0 | 0 | 0 | 0 | 0 | 0 | 0 | 0 | 0 | 0 |
| 1 | 13 | 1 | 0 | 0 | 1 | 0 | 1 | 0 | 0 | 1 | 0 | 0 | 0 | 0 | 0 | 0 | 0 | 1 | 1 | 1 | 0 |
| 1 | 14 | 1 | 1 | 1 | 0 | 1 | 1 | 1 | 1 | 0 | 1 | 0 | 0 | 0 | 1 | 0 | 0 | 0 | 0 | 1 | 0 |
| 1 | 15 | 0 | 1 | 0 | 0 | 0 | 0 | 1 | 0 | 0 | 0 | 0 | 0 | 0 | 0 | 0 | 0 | 0 | 0 | 0 | 0 |
| 1 | 16 | 0 | 0 | 0 | 0 | 0 | 0 | 0 | 0 | 0 | 0 | 0 | 0 | 0 | 0 | 0 | 0 | 0 | 0 | 0 | 0 |
| 1 | 17 | 0 | 1 | 0 | 0 | 1 | 0 | 1 | 0 | 0 | 1 | 0 | 0 | 0 | 0 | 1 | 0 | 0 | 0 | 0 | 0 |
| 1 | 31 | 0 | 0 | 0 | 0 | 0 | 0 | 0 | 0 | 0 | 0 | 1 | 1 | 1 | 1 | 2 | 1 | 1 | 1 | 0 | 1 |
| 1 | 32 | 0 | 0 | 0 | 0 | 0 | 0 | 0 | 1 | 0 | 0 | 2 | 2 | 0 | 2 | 1 | 1 | 0 | 0 | 1 | 1 |
| 1 | 33 | 1 | 0 | 0 | 0 | 0 | 1 | 0 | 0 | 0 | 0 | 2 | 2 | 1 | 2 | 2 | 1 | 0 | 1 | 1 | 1 |
| 1 | 34 | 1 | 1 | 0 | 0 | 1 | 1 | 1 | 0 | 0 | 1 | 1 | 1 | 0 | 1 | 1 | 1 | 0 | 0 | 2 | 1 |
| 1 | 35 | 1 | 1 | 0 | 1 | 1 | 1 | 1 | 0 | 1 | 1 | 1 | 1 | 0 | 1 | 1 | 1 | 1 | 0 | 1 | 1 |
| 1 | 36 | 1 | 2 | 0 | 1 | 1 | 1 | 1 | 0 | 1 | 0 | 1 | 1 | 0 | 1 | 1 | 1 | 0 | 0 | 0 | 1 |
| 1 | 37 | 0 | 1 | 0 | 0 | 0 | 0 | 0 | 0 | 0 | 0 | 1 | 1 | 0 | 0 | 0 | 1 | 1 | 0 | 0 | 0 |
| | |||||||||||||||||||||
| 8 | 11 | 1 | 0 | 0 | 0 | 0 | 1 | 0 | 0 | 0 | 0 | 1 | 1 | 1 | 1 | 0 | 2 | 2 | 2 | 2 | 2 |
| 8 | 12 | 1 | 0 | 0 | 0 | 0 | 1 | 0 | 0 | 0 | 0 | 1 | 1 | 0 | 0 | 0 | 1 | 0 | 0 | 1 | 0 |
| 8 | 13 | 2 | 1 | 1 | 1 | 1 | 2 | 1 | 1 | 1 | 2 | 1 | 1 | 0 | 1 | 0 | 1 | 2 | 1 | 2 | 2 |
| 8 | 14 | 1 | 1 | 0 | 0 | 1 | 1 | 1 | 0 | 0 | 1 | 1 | 1 | 0 | 1 | 2 | 1 | 0 | 0 | 0 | 1 |
| 8 | 15 | 0 | 0 | 0 | 0 | 0 | 0 | 0 | 0 | 0 | 0 | 1 | 1 | 0 | 0 | 0 | 1 | 0 | 0 | 0 | 1 |
| 8 | 16 | 0 | 0 | 0 | 0 | 0 | 0 | 0 | 0 | 0 | 0 | 0 | 0 | 0 | 1 | 0 | 0 | 0 | 0 | 1 | 0 |
| 8 | 17 | 0 | 0 | 0 | 0 | 0 | 0 | 0 | 0 | 0 | 0 | 1 | 1 | 0 | 1 | 1 | 1 | 0 | 0 | 0 | 1 |
| 8 | 31 | 1 | 0 | 0 | 0 | 0 | 1 | 0 | 0 | 0 | 0 | 2 | 2 | 1 | 1 | 2 | 2 | 0 | 0 | 1 | 2 |
| 8 | 32 | 1 | 0 | 0 | 1 | 0 | 1 | 0 | 0 | 0 | 0 | 2 | 2 | 1 | 2 | 2 | 1 | 0 | 0 | 1 | 1 |
| 8 | 33 | 1 | 0 | 0 | 1 | 0 | 1 | 0 | 0 | 1 | 0 | 1 | 1 | 0 | 1 | 1 | 1 | 0 | 0 | 0 | 0 |
| 8 | 34 | 1 | 1 | 0 | 1 | 1 | 1 | 1 | 0 | 1 | 1 | 2 | 2 | 1 | 1 | 2 | 1 | 1 | 0 | 0 | 1 |
| 8 | 35 | 1 | 1 | 0 | 1 | 1 | 1 | 1 | 0 | 1 | 1 | 1 | 1 | 0 | 0 | 0 | 1 | 1 | 0 | 0 | 0 |
| 8 | 36 | 1 | 1 | 0 | 1 | 1 | 1 | 1 | 0 | 1 | 0 | 2 | 2 | 0 | 0 | 0 | 1 | 0 | 0 | 0 | 0 |
| 8 | 37 | 1 | 0 | 0 | 0 | 0 | 1 | 0 | 0 | 0 | 1 | 1 | 1 | 0 | 1 | 1 | 1 | 0 | 0 | 1 | 1 |
All observer assessments in Protocols 1 and 8 are shown. The sites where no zero (0) was assessed by any observer are given in bold.
Figure 2.
Scoring image quality percentage for different anatomical landmarks and optimal image quality threshold. ATPS, apical third of periodontal space; BL, buccolingual/palatal; CEJ, cementoenamel junction; MBC, marginal bone crest; MD, mesiodistal.
Intermeasurement agreement for the five observer measurements of the distance between CEJ and MBC was calculated using intraclass correlation coefficient (ICC 2.1). The ICC value was interpreted according to Landis and Koch27 as ICC < 0.20 = slight agreement, ICC 0.21–0.40 = fair agreement, ICC 0.41–0.60 = moderate agreement, ICC 0.61–0.80 = substantial agreement and ICC 0.81–1.0 = almost perfect agreement.
All statistical analyses were performed using IBM SPSS® Statistics v. 22.0 (IBM Corp., New York, NY; formerly SPSS Inc., Chicago, IL).
Results
Dose values
As seen in Table 1, the mean measured DAP values were 268.0 mGy cm2 (SD = 2.03) for the lowest exposure parameter setting (Protocol 1) and 1935.8 mGy cm2 (SD = 26.99) for the highest exposure parameter setting (Protocol 12). When comparing full-rotation (360°) and half-rotation (180°) protocols of the same tube potential (kV) and mA, the average decrease in DAP value was 50–52% for half-rotation protocols. Compared with the calculated DAP values that were recorded from the unit console, the unit tended to overestimate DAP values ranging from a minimum of 12% to a maximum of 17% depending on exposure scanning parameters.
Objective image quality measurements
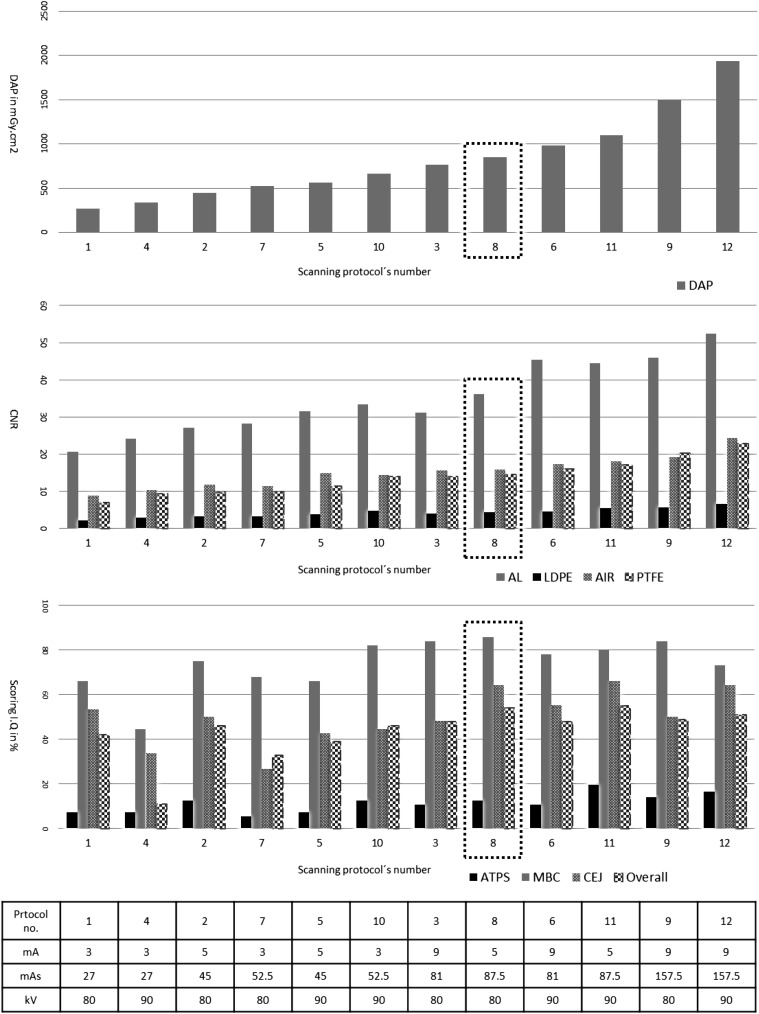
The measured data on DAP and CNR for different scanning protocols are seen in Figure 3. With increased mAs, CNR is improved, and this improvement in CNRs of different inserts is associated with an increase in the radiation dose. The CNR values of different inserts vary in range because of the different densities of the inserts. When using the same exposure parameters, the 360° scan has a higher CNR than the 180° scan.
Figure 3.
Dose–area product (DAP), contrast-to-noise ratio (CNR) and scoring image quality in the percentage of different scanning protocols. Scanning protocols have been reordered according to DAP values. Al, aluminium; ATPS, apical third of periodontal space; CEJ, cementoenamel junction; LDPE, low-density polyethylene; MBC, marginal bone crest; PTFE, polytetrafluoroethylene.
Subjective image quality assessments
The scoring of image quality for different scanning protocols is seen in Figure 3. The scoring of image quality essentially depends on the anatomical landmarks. There is no standard scanning protocol that is optimal for all anatomical landmarks.
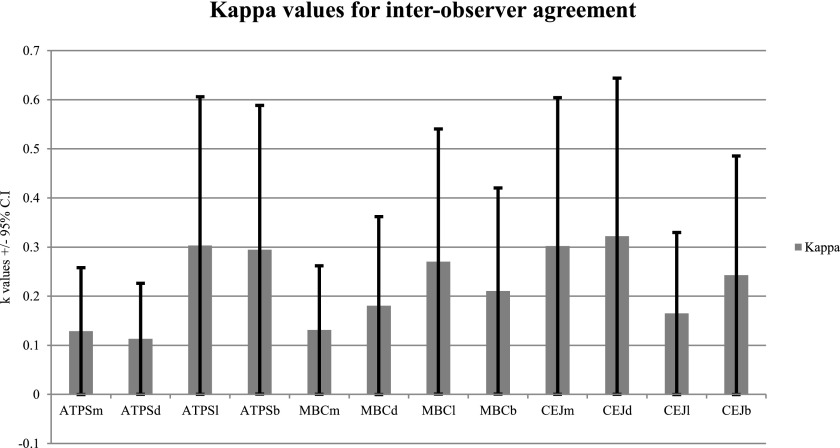
Interobserver agreement varied between k = 0.11 and k = 0.32 when taking all anatomical landmarks into account. The agreement principally depends on the anatomical landmark and tooth aspect. Higher values of agreement were seen when assessing the CEJ on the distal aspect of teeth (Figure 4). Kappa values for intraobserver agreement were moderate for rating the images (k = 0.44–0.51).
Figure 4.
Kappa values for interobserver agreement for the visual grade analysis of different anatomical landmarks and tooth aspects. ATPS, apical third of periodontal space; b, buccal aspect; CEJ, cementoenamel junction; CI, confidence interval; d, distal aspect; l, lingual/palatal aspect; m, mesial aspect; MBC, marginal bone crest.
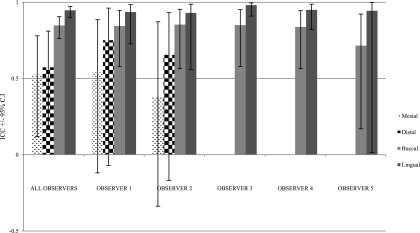
ICC for measurements between CEJ and MBC for all observers were 0.52 mesially [95% confidence interval (CI) 0.12–0.78], 0.57 distally (95% CI 0.16–0.81), 0.85 buccally (95% CI 0.76–0.90) and 0.95 in lingual/palatal bone sites (95% CI 0.90–0.97). Also, ICC for each observer varied depending on which aspect of the tooth was measured (Figure 5).
Figure 5.
Intraclass correlation coefficient (ICC) plot for the measurements between the cementoenamel junction and marginal bone crest of different tooth aspects by different observers. CI, confidence interval.
Subjective and objective image quality relationship
Logistic regression performed to measure the relationship among the CNRs for each of the test insert materials and optimal image quality showed that there was a very high correlation between the four different inserts. This means that there was a statistically significant relationship between all inserts and optimal image quality (p = 0.951–1). An examination of the CNR values in Figure 3 and optimal image quality in Figure 2 showed that the optimal image quality was obtained with a CNR of Protocols 2, 3, 6, 12, 8 and 11 in ascending order.
Optimization
Taking the protocols resulting in overall optimal subjective image quality (Protocol number 2, 3, 8, 6, 11 and 12) into consideration together with the CNR values of all inserts, it was concluded that Protocols 3, 8 and 11 had the highest overall scoring with regard to image quality (Figure 3). We decided to exclude Protocol 3, as this protocol showed lower image quality assessment scores for some landmarks than Protocols 8 and 11. After consulting the two radiologists and one medical physicist, we selected Protocol 8 (80 kV/5 mA/360° or 17.5 s) as the optimized protocol for this diagnostic task. The main objective was not to achieve the highest CNR values but rather to keep the radiation dose as low as possible, as there was only a slight difference in CNR values between Protocol 8 and Protocol 11.
Discussion
One conclusion of a recent systematic review was that more research is needed concerning the image quality and radiation dose of different machine types and for different diagnostic tasks.28 In this study, we performed dosimetry, objective measurements and subjective assessment of image quality, all on the same material and the same machine. We consider this to be a strength of the study. The diagnostic tasks chosen were the assessment of the periodontal space at the apical third of the root, the MBC and the CEJ. The apical third of the root is the area of interest for root resorption detection and radiography is the only possible method by which to detect it, which is mostly performed as intraoral, periapical radiography. However, this technique has its shortcomings as do panoramic and lateral cephalometric radiography.29–31 It has been concluded that CBCT can provide more valid and accurate information about root resorption caused by orthodontic treatment than any other radiographic technique.20,22
Furthermore, a number of studies have been performed to investigate whether CBCT provides more information when used to evaluate marginal bone loss than periapical radiographs.32 Studies have shown that CBCT images do provide additional information that might benefit diagnostic outcome.33,34 Identification of the CEJ, the third diagnostic task in this study, was chosen because the CEJ is a landmark often used as a starting point or an end point for measurements of root length as well as of marginal bone level.
Taking the above into consideration, it can be hypothesized that CBCT examinations for the assessment of periodontal structures might increase in quantity for both adult and young adult patients and that there is a need to identify specific scanning protocols that will deliver a balance between acceptable image quality and the lowest achievable patient dose. The CBCT unit used in this study offers four scanning modes; standard, high fidelity, high resolution and high-speed imaging mode. The main difference between them is the exposure time. As recommended by the manufacturer, we used the standard mode for all scanning protocols. The reason for choosing an FOV of 8 × 8 cm was the intention to capture all teeth in both the upper and lower jaw during the same scanning. In addition to the FOV, the radiation exposure of CBCT is influenced by the exposure parameters (mAs, kV) that affect the quantity and quality of incident radiation beam and therefore radiation dose. Most CBCT units use 90 kV when scanning adult patients, as this provides an acceptable combination of X-ray penetration and image contrast resolution. A few CBCT units like i-CAT use 120 kV as a fixed potential value with filtration equivalent to 10 mm of aluminium. Higher kV may be used for specific diagnostic tasks when reduced a beam-hardening artefact is needed. For paediatric patients, a low kV (80 kV or less) may be used to minimize the patient dose. In this study, we used 80 kV and 90 kV with three levels of mA related to possible adult patient sizes (3 mA, 5 mA and 9 mA).
In addition to FOV reduction, the use of a partial rotation can also be used to further optimize patient dose.35 Some CBCT units use 360° rotation; others use a smaller trajectory arc of between 180° and 220° as the coverage of 180° and the cone angle is sufficient for tomographic image reconstruction.36 Images produced by partial rotation may, however, have more noise and reconstruction artefacts.37 For some diagnostic tasks on specific CBCT units, partial rotation can be used to reduce radiation dose while maintaining sufficient image quality.38,39 3D Accuitomo 170 includes a standard rotation with a 360° (17.5 s) as well as a 180° (9 s) rotation to reduce scan time and, thereby, patient dose.
In the present study, radiation doses were measured in terms of DAP, as it is the most practicable means of representing patient dose. Furthermore, DAP has been recommended for establishing achievable doses or diagnostic reference levels when established and relates reasonably well with effective dose.20,40 Even though the central point of the scan is not always in the centre of the clinical ROI and patient dose measurements could be both underestimated and overestimated, DAP can be used to assess dose reduction strategies and compare the results from different CBCT units.9,28
Pauwels et al41 evaluated the SEDENTEXCT phantom and reported that it showed promising results for physical CBCT image quality assessment. The same phantom was used by Bamba et al10 to evaluate three different CBCT units and the authors stated that the basic image quality parameters could be well assessed by this phantom. Image noise, contrast resolution, spatial resolution and artefacts are key parameters in objective image quality assessment. The quality of CBCT images, with the same spatial resolution, is fundamentally described by two parameters (indexes): contrast and noise. Accordingly, we used CNR measurements for objective image quality assessment. There are many factors affecting the contrast and noise parameters of image quality of CBCT units such as system geometry, focal spot size, FOV, object size, exposure parameters (kV, mAs), number of projections and voxel size. In the present study, we used the same geometry, FOV, object size and voxel size during all scans.
Physical measurement expressed as objective image quality is not enough to predict the diagnostic performance of an imaging system clinically and the evaluation of image quality must include psychohysical, environmental and system considerations.42 In our study, we chose to evaluate subjective image quality by assessments of images of a skull phantom and a variation of exposure settings in order to find the lowest exposure settings for the specific diagnostics tasks. The reason for choosing standard observation environment was that one of the tasks of this study was to investigate observer agreement, where agreement is defined as the degree to which two or more observers achieve identical results under similar assessment conditions.43 A further step would be to investigate observer performance on images of patients in a real clinical situation. The reason for choosing five observers was that different observers may have different prior experience.
A reduction of kV from 90 kV to 80 kV of the same mAs reduced mean DAP values (20–22%). The 180° rotation angle scan provided a significant reduction (50%) in the radiation dose compared with the 360° rotation angle scan of the same kV and mA. A substantial reduction (82%) in DAP value can be achieved by combining rotation angle and kV (27 mAs or 52.5 mAs instead of 81 mAs or 157.5 mAs). The DAP values indicated by the CBCT unit consoles were overestimated by 12–17%, when compared with measured values. This can be explained by the fact that the values indicated by the CBCT unit consoles are determined computationally, based on X-ray tube output and field size settings. Therefore, calibration of CBCT unit DAP systems is important for a reliable analysis of diagnostic reference levels. Another explanation would be that the output of the machine is incorrect and that the stated peak tube potential is less than the actual unit peak tube potential.
For the different protocols, we used the same quality of X-ray beam by using different peak energy (80 kV or 90 kV). Theoretically, for CT, increased kV will lead to a decreased contrast resolution, as a result of the difference in attenuation coefficient between different structures, and an increase of noise, as a result of decreased quantum detection efficiency of the X-ray converter, i.e. more scatter interaction and less photoelectric effect with higher kV. Concurrently, decreased kV will lead to increased noise as a result of decreased fluence transmitted to the image detector. This finding was observed in this study also. The standard scanning mode of 3D Accuitomo 170 has fixed frames per second (30 frames/s), i.e. it has 270 and 525 basis images for 180° (9 s) and 360° (17.5 s), respectively. In the less basis images (less exposure time), the effect on the images manifests as more noise. For example, comparing full-rotation 360° and half-rotation 180° protocols of the same kV and mA, the average decrease in CNR value of PTFE inserts was 30–34% for half-rotation protocols.
The result of this study cannot be generalized to all clinical situations and/or CBCT units. For a specific clinical situation and CBCT unit, patient dose reduction is possible without a clinically relevant reduction in image quality.
Acknowledgments
Acknowledgments
The authors would like to thank associate professor Mikael Gunnarsson, Medical Radiation Physics, Skane University Hospital, Malmö, Sweden, for valuable assistance with dose–area product measurements and the observers for their time and commitment.
Contributor Information
Ayman Al-Okshi, Email: ayman.al-okshi@mah.se.
Chrysoula Theodorakou, Email: Christie.Theodorakou@christie.nhs.uk.
Christina Lindh, Email: christina.lindh@mah.se.
References
- 1.Scarfe WC, Farman AG, Sukovic P. Clinical applications of cone-beam computed tomography in dental practice. J Can Dent Assoc 2006; 72: 75–80. [PubMed] [Google Scholar]
- 2.Ludlow JB, Davies-Ludlow LE, White SC. Patient risk related to common dental radiographic examinations: the impact of 2007 International Commission on Radiological Protection recommendations regarding dose calculation. J Am Dent Assoc 2008; 139: 1237–43. doi: https://doi.org/10.14219/jada.archive.2008.0339 [DOI] [PubMed] [Google Scholar]
- 3.The 2007 Recommendations of the International Commission on Radiological Protection. ICRP publication 103. Ann ICRP 2007; 37: 1–332. [DOI] [PubMed] [Google Scholar]
- 4.Kleinerman RA. Cancer risks following diagnostic and therapeutic radiation exposure in children. Pediatr Radiol 2006; 36(Suppl. 2): 121–5. doi: https://doi.org/10.1007/s00247-006-0191-5 [DOI] [PMC free article] [PubMed] [Google Scholar]
- 5.Nemtoi A, Czink C, Haba D, Gahleitner A. Cone beam CT: a current overview of devices. Dentomaxillofac Radiol 2013; 42: 20120443. doi: https://doi.org/10.1259/dmfr.20120443 [DOI] [PMC free article] [PubMed] [Google Scholar]
- 6.Qu XM, Li G, Ludlow JB, Zhang ZY, Ma XC. Effective radiation dose of ProMax 3D cone-beam computerized tomography scanner with different dental protocols. Oral Surg Oral Med Oral Pathol Oral Radiol Endod 2010; 110: 770–6. doi: https://doi.org/10.1016/j.tripleo.2010.06.013 [DOI] [PubMed] [Google Scholar]
- 7.Pauwels R, Araki K, Siewerdsen JH, Thongvigitmanee SS. Technical aspects of dental CBCT: state of the art. Dentomaxillofac Radiol 2015; 44: 20140224. doi: https://doi.org/10.1259/dmfr.20140224 [DOI] [PMC free article] [PubMed] [Google Scholar]
- 8. NCRP. Achievements of the past 50 years and addressing the needs of the future 2014. Fiftieth annual meeting of the National Council on Radiation Protection and Measurements (NCRP). Available from: http://www.ncrponline.org/Annual_Mtgs/2014_Ann_Mtg/PROGRAM_2–10.pdf.
- 9.Lofthag-Hansen S. Cone beam computed tomography radiation dose and image quality assessments. Swed Dent J Suppl 2010; 209: 4–55. [PubMed] [Google Scholar]
- 10.Bamba J, Araki K, Endo A, Okano T. Image quality assessment of three cone beam CT machines using the SEDENTEXCT CT phantom. Dentomaxillofac Radiol 2013; 42: 20120445. doi: https://doi.org/10.1259/dmfr.20120445 [DOI] [PMC free article] [PubMed] [Google Scholar]
- 11.Al-Okshi A, Lindh C, Salé H, Gunnarsson M, Rohlin M. Effective dose of cone beam CT (CBCT) of the facial skeleton: a systematic review. Br J Radiol 2015; 88: 20140658. doi: https://doi.org/10.1259/bjr.20140658 [DOI] [PMC free article] [PubMed] [Google Scholar]
- 12.Hidalgo Rivas JA, Horner K, Thiruvenkatachari B, Davies J, Theodorakou C. Development of a low-dose protocol for cone beam CT examinations of the anterior maxilla in children. Br J Radiol 2015; 88: 1054. doi: https://doi.org/10.1259/bjr.20150559 [DOI] [PMC free article] [PubMed] [Google Scholar]
- 13.Choi JW, Lee SS, Choi SC, Heo MS, Huh KH, Yi WJ, et al. Relationship between physical factors and subjective image quality of cone-beam computed tomography images according to diagnostic task. Oral Surg Oral Med Oral Pathol Oral Radiol 2015; 119: 357–65. doi: https://doi.org/10.1016/j.oooo.2014.11.010 [DOI] [PubMed] [Google Scholar]
- 14.Björn H, Halling A, Thyberg H. Radiographic assessment of marginal bone loss. Odontol Revy 1969; 20: 165–79. [PubMed] [Google Scholar]
- 15.Albandar JM, Abbas DK, Waerhaug M, Gjermo P. Comparison between standardized periapical and bitewing radiographs in assessing alveolar bone loss. Community Dent Oral Epidemiol 1985; 13: 222–5. doi: https://doi.org/10.1111/j.1600-0528.1985.tb01908.x [DOI] [PubMed] [Google Scholar]
- 16.Salonen LW, Frithiof L, Wouters FR, Helldén LB. Marginal alveolar bone height in an adult Swedish population. A radiographic cross-sectional epidemiologic study. J Clin Periodontol 1991; 18: 223–32. doi: https://doi.org/10.1111/j.1600-051X.1991.tb00419.x [DOI] [PubMed] [Google Scholar]
- 17.Mol A, Balasundaram A. In vitro cone beam computed tomography imaging of periodontal bone. Dentomaxillofac Radiol 2008; 37: 319–24. doi: https://doi.org/10.1259/dmfr/26475758 [DOI] [PubMed] [Google Scholar]
- 18.Noujeim M, Prihoda T, Langlais R, Nummikoski P. Evaluation of high-resolution cone beam computed tomography in the detection of simulated interradicular bone lesions. Dentomaxillofac Radiol 2009; 38: 156–62. doi: https://doi.org/10.1259/dmfr/61676894 [DOI] [PubMed] [Google Scholar]
- 19.Prakash N, Karjodkar FR, Sansare K, Sonawane HV, Bansal N, Arwade R. Visibility of lamina dura and periodontal space on periapical radiographs and its comparison with cone beam computed tomography. Contemp Clin Dent 2015; 6: 21–5. doi: https://doi.org/10.4103/0976-237x.149286 [DOI] [PMC free article] [PubMed] [Google Scholar]
- 20.European Commission. Radiation protection 172. Cone beam CT for dental and maxillofacial radiology. Evidence-based guidelines. Luxenbourg: European Comission, Directory of Energy; 2012. [Google Scholar]
- 21.Kasaj A, Willershausen B. Digital volume tomography for diagnostics in periodontology. Int J Comput Dent 2007; 10: 155–68. [PubMed] [Google Scholar]
- 22.Lund H, Gröndahl K, Hansen K, Gröndahl HG. Apical root resorption during orthodontic treatment. A prospective study using cone beam CT. Angle Orthod 2012; 82: 480–7. doi: https://doi.org/10.2319/061311-390.1 [DOI] [PMC free article] [PubMed] [Google Scholar]
- 23.Shin HS, Nam KC, Park H, Choi HU, Kim HY, Park CS. Effective doses from panoramic radiography and CBCT (cone beam CT) using dose area product (DAP) in dentistry. Dentomaxillofac Radiol 2014; 43: 20130439. doi: https://doi.org/10.1259/dmfr.20130439 [DOI] [PMC free article] [PubMed] [Google Scholar]
- 24.Batista WO, Navarro MV, Maia AF. Effective doses in panoramic images from conventional and CBCT equipment. Radiat Prot Dosimetry 2011; 151: 67–75. doi: https://doi.org/10.1093/rpd/ncr454 [DOI] [PubMed] [Google Scholar]
- 25.Samei E, Badano A, Chakraborty D, Compton K, Cornelius C, Corrigan K, et al. Assessment of display performance for medical imaging systems: executive summary of AAPM TG18 report. Med Phys 2005; 32: 1205–25. doi: https://doi.org/10.1118/1.1861159 [DOI] [PubMed] [Google Scholar]
- 26.Altman DG. Practical statistics for medical research. London: Chapman and Hall/CRC Texts in Statistical Science; 1990.
- 27.Landis JR, Koch GG. The measurement of observer agreement for categorical data. Biometrics 1977; 33: 159–74. doi: https://doi.org/10.2307/2529310 [PubMed] [Google Scholar]
- 28.Goulston R, Davies J, Horner K, Murphy F. Dose optimization by altering the operating potential and tube current exposure time product in dental cone beam CT: a systematic review. Dentomaxillofac Radiol 2016; 45: 20150254. doi: https://doi.org/10.1259/dmfr.20150254 [DOI] [PMC free article] [PubMed] [Google Scholar]
- 29.Brezniak N, Goren S, Zoizner R, Dinbar A, Arad A, Wasserstein A, et al. A comparison of three methods to accurately measure root length. Angle Orthod 2004; 74: 786–91. doi: https://doi.org/10.1043/0003-3219(2004)074<0786:ACOTMT>2.0.CO;2 [DOI] [PubMed] [Google Scholar]
- 30.Katona TR. The flaws in tooth root resorption assessment algorithms: the role of source position. Dentomaxillofac Radiol 2007; 36: 311–6. doi: https://doi.org/10.1259/dmfr/52061649 [DOI] [PubMed] [Google Scholar]
- 31.Leach HA, Ireland AJ, Whaites EJ. Radiographic diagnosis of root resorption in relation to orthodontics. Br Dent J 2001; 190: 16–22. doi: https://doi.org/10.1038/sj.bdj.4800870a [DOI] [PubMed] [Google Scholar]
- 32.Korostoff J, Aratsu A, Kasten B, Mupparapu M. Radiologic assessment of the periodontal patient. Dent Clin North Am 2016; 60: 91–104. doi: https://doi.org/10.1016/j.cden.2015.08.003 [DOI] [PubMed] [Google Scholar]
- 33.Braun X, Ritter L, Jervøe-Storm PM, Frentzen M. Diagnostic accuracy of CBCT for periodontal lesions. Clin Oral Investig 2014; 18: 1229–36. doi: https://doi.org/10.1007/s00784-013-1106-0 [DOI] [PubMed] [Google Scholar]
- 34.Leung CC, Palomo L, Griffith R, Hans MG. Accuracy and reliability of cone-beam computed tomography for measuring alveolar bone height and detecting bony dehiscences and fenestrations. Am J Orthod Dentofacial Orthop 2010; 137(Suppl. 4): S109–19. doi: https://doi.org/10.1016/j.ajodo.2009.07.013 [DOI] [PubMed] [Google Scholar]
- 35.Pauwels R, Zhang G, Theodorakou C, Walker A, Bosmans H, Jacobs R, et al. ; SEDENTEXCT Project Consortium. Effective radiation dose and eye lens dose in dental cone beam CT: effect of field of view and angle of rotation. Br J Radiol 2014; 87: 20130654. doi: https://doi.org/10.1259/bjr.20130654 [DOI] [PMC free article] [PubMed] [Google Scholar]
- 36.Rehani MM. Radiological protection in computed tomography and cone beam computed tomography. Ann ICRP 2015; 44(Suppl. 1): 229–35. doi: https://doi.org/10.1177/0146645315575872 [DOI] [PubMed] [Google Scholar]
- 37.Scarfe WC, Farman AG. What is cone-beam CT and how does it work? Dent Clin North Am 2008; 52: 707–30. doi: https://doi.org/10.1016/j.cden.2008.05.005 [DOI] [PubMed] [Google Scholar]
- 38.Lofthag-Hansen S, Thilander-Klang A, Gröndahl K. Evaluation of subjective image quality in relation to diagnostic task for cone beam computed tomography with different fields of view. Eur J Radiol 2011; 80: 483–8. doi: https://doi.org/10.1016/j.ejrad.2010.09.018 [DOI] [PubMed] [Google Scholar]
- 39.Durack C, Patel S, Davies J, Wilson R, Mannocci F. Diagnostic accuracy of small volume cone beam computed tomography and intraoral periapical radiography for the detection of simulated external inflammatory root resorption. Int Endod J 2011; 44: 136–47. doi: https://doi.org/10.1111/j.1365-2591.2010.01819.x [DOI] [PubMed] [Google Scholar]
- 40.Holroyd JR, Walker A. Recommendations for the design of X-ray facilities and quality assurance of dental cone Beam CT (computed tomography) system: Health Protection Agency. Available from: http://www.hpa.org.uk/webc/HPAwebFile/HPAweb_C/1267551245480
- 41.Pauwels R, Stamatakis H, Manousaridis G, Walker A, Michielsen K, Bosmans H, et al. Development and applicability of a quality control phantom for dental cone-beam CT. J Appl Clin Med Phys 2011; 12: 3478. doi: https://doi.org/10.1120/jacmp.v12i4.3478 [DOI] [PMC free article] [PubMed] [Google Scholar]
- 42.Martin CJ, Sharp PF, Sutton DG. Measurement of image quality in diagnostic radiology. Appl Radiat Isot 1999; 50: 21–38. doi: https://doi.org/10.1016/s0969-8043(98)00022-0 [DOI] [PubMed] [Google Scholar]
- 43.Kottner J, Audige L, Brorson S, Donner A, Gajewski BJ, Hróbjartsson A, et al. Guidelines for reporting reliability and agreement studies (GRRAS) were proposed. Int J Nurs Stud 2011; 48: 661–71. doi: https://doi.org/10.1016/j.ijnurstu.2011.01.016 [DOI] [PubMed] [Google Scholar]


