Abstract
Objectives:
The purpose of this study was to investigate whether CT/MRI fusion volumetric images can improve the detectability of the mandibular canal (MC) compared with CT alone.
Methods:
Images of 31 lesions within or close to the mandible using both multislice CT (MSCT) and MRI were gathered from our imaging archives. All lesions underwent MSCT and three-dimensional volumetric interpolated breath-hold examination (3D-VIBE) MRI. Of the 62 hemimandibles, 13 hemimandibles were excluded because the MC passed through a lesion. The remaining 49 hemimandibles were included in this study. Each hemimandible was divided into 3 areas (premolar, molar and retromolar), and 147 areas were evaluated. First, the visibility of the MC on CT or its neurovascular bundle (NVB) on 3D-VIBE was evaluated. Second, in areas in which both the MC and NVB were visible, the relative locations of the NVB on MRI and the position of the MC on CT were assessed using CT/MRI fusion volumetric images.
Results:
The MC and NVB were clearly visible in 100 (68%) and 144 (98%) of 147 areas on CT and MRI, respectively. All NVBs and MCs were in identical locations, and the NVB on MRI was the same size or smaller than the MC on CT in 79 and 21 areas, respectively.
Conclusions:
3D-VIBE MRI can accurately depict the NVB. Compared with CT alone, CT/MRI fusion volumetric imaging improves MC detectability.
Keywords: MRI, mandible, multislice CT, imaging, three-dimensional
Introduction
While planning for dental implants and other surgical procedures involving the mandible, detection of the mandibular canal (MC) is important for preventing neurosensory disturbances.1 Radiographic techniques are usually used to identify the MC, such as periapical radiography, panoramic radiography and CT.2 CT examination is superior to the other examinations mentioned for MC detection because it provides three-dimensional (3D) sectional images.3 In a previous article, we reported the detectability of the MC on CT images. At most, we could identify the MC in 82% of cases, even when we used the “panoramic to paraxial view” guide function on reformatted dental CT images.4 For the remaining cases where the MC was not detected, it would be useful to use MRI, which could depict inferior alveolar neurovascular bundles (NVBs) within the MC.
To date, there have been several studies that evaluated NVBs using MRI. Anson5 and Imamura et al6 compared the structures of the mandible on CT and MRI. They identified and located MCs on both modalities and found that the interobserver and intraobserver variability for determining the location of the MC on MRI is smaller than those on CT. The geometric accuracy with MRI was addressed by Eggers et al7 and Goto et al8 using minute in vitro models. On the basis of repeated measures of the distances between previously determined points, they concluded that MRI is acceptable for fulfilling measuring requests related to dental implants or orthodontic surgery planning. The ability to identify NVBs by MRI depends on imaging parameters, but most of the studies mentioned above used a 3D volumetric interpolated breath-hold examination (3D-VIBE) sequence.5,7,8 This sequence was originally developed for short examinations during a single breath-hold, but it has been used extensively for 3D examinations, which can have a high signal-to-noise ratio and tiny isotropic voxel images.9
Although the NVB is well visualized with MRI, it is not used routinely in clinical practice in dentistry. This might be because information about bony structures from MRI would not be as straightforward as information from CT. We considered that such a potential challenge could be overcome by employing a fusion image technique.10 In this study, we investigated whether CT/MRI fusion volumetric images can improve MC detectability compared with CT images alone.
Methods and materials
Patients
In this retrospective study, cases with both multislice CT (MSCT) and MRI examinations to evaluate a lesion within or close to the mandible from January to June 2015 were gathered from our imaging archives. 31 cases met the above inclusion criteria, and the lesions had all been subjected to MSCT and 3D-VIBE MRI. The patients included 16 males and 15 females. The median age was 57 years (range, 29–85 years). The definitive diagnosis was inflammation (8 patients), cyst (4 patients), benign tumour (6 patients) and malignant tumour (16 patients). In this study, the right and left mandibles were evaluated as independent cases, but of the 62 hemimandibles, 13 hemimandibles were excluded because the MC passed through a lesion. The remaining 49 hemimandibles were included in this study. The study was approved by the institutional review board of Tokyo Medical and Dental University (No. D2015-530).
Image data acquisition
All patients were examined with MSCT and MRI with the settings used in daily clinical protocols. MSCT was performed using a Somatom Sensation 64 scanner (Siemens, Forchheim, Germany). The scanning parameters were: tube voltage of 120 kV, effective tube current of 140 mAs or quality effective current of 190 mAs, collimation of 64 × 0.6 mm and pitch of 0.6. As a result, the reconstruction bone kernel images had a slice thickness of 0.6 mm, an increment of 0.3 mm and the field of view (FOV) ranged from 126 × 126 mm to 157 × 157 mm. MRI was performed using a Magnetom Spectra scanner (Siemens), which is equipped with a 3.0 T magnetic field and a 16-channel head and neck array coil. The routine imaging protocol in our institution is composed of T1 weighted and T2 weighted axial and coronal images with fat suppression and gadolinium (Gd)-enhanced T1 weighted axial and coronal images with fat suppression. Gd-enhanced images are obtained after the i.v. administration of gadodiamide hydrate (0.2 ml kg−1). T1 weighted and T2 weighted images were obtained with a repetition time/echo time ratio of 640 ms/12 ms and 5000 ms/94 ms, respectively. Fat-suppressed images were obtained with the Dixon technique or the chemical shift selective method. These sequences were taken with a slice thickness of 4.0 mm, intersection gap of 1.0 mm, FOV of 230 × 230 mm and matrix size of 384 × 384. All patients in this study were also examined with a 3D-VIBE sequence. The scan parameters were: repetition time/echo time of 13.7/3.9, flip angle of 20°, FOV of 150 × 150 mm and matrix size of 192 × 192. There was one 3D-VIBE acquisition, with a scan time of 3 min and 35 s.
Fusion volumetric images
Fusion volumetric images were created on a syngo®.via VA20A workstation (Siemens). CT and MR images from each patient were transferred to the workstation. Both sets of images were opened with the Multimodality Reading viewer. On the viewer, the multiplanar reconstruction layout was selected. MR images were fused to CT images using the drag and drop function. At this time, after choosing the “automatic registration” automatic matching function, the fusion was often incomplete. Next, we chose the manual matching function using “visual alignment”. The mandible cortex is depicted as white and black lines on CT and MRI, respectively. We used trial and error to perform visual alignment until both lines were completely overlapping, especially at the bilateral heads of the mandible and the chin. This resulted in the final CT/MRI volumetric fusion image. On the fusion image, the CT was indicated as the same as the CT console, but for the MRI components, high signal intensity was shown in red by changing its lookup table to “red”.
Evaluation of the images
Two oral and maxillofacial radiologists (CD and HW), who were blinded to patient record information, evaluated the images independently. First, the MC was observed on CT and the NVB was observed on MRI separately. Next, 3D-VIBE images were reviewed to determine whether the mandibular anatomy can be recognized. Then, CT/MR fusion images were reviewed. Each evaluation of MC and NVB visibility was performed twice with a 3-week interval by one observer (CD) for calculation of intraobserver test reliability. The evaluation results were then compared with those of another observer (HW) to calculate interobserver reliability. Disagreement between the two observers was resolved by discussion and a consensus was reached.
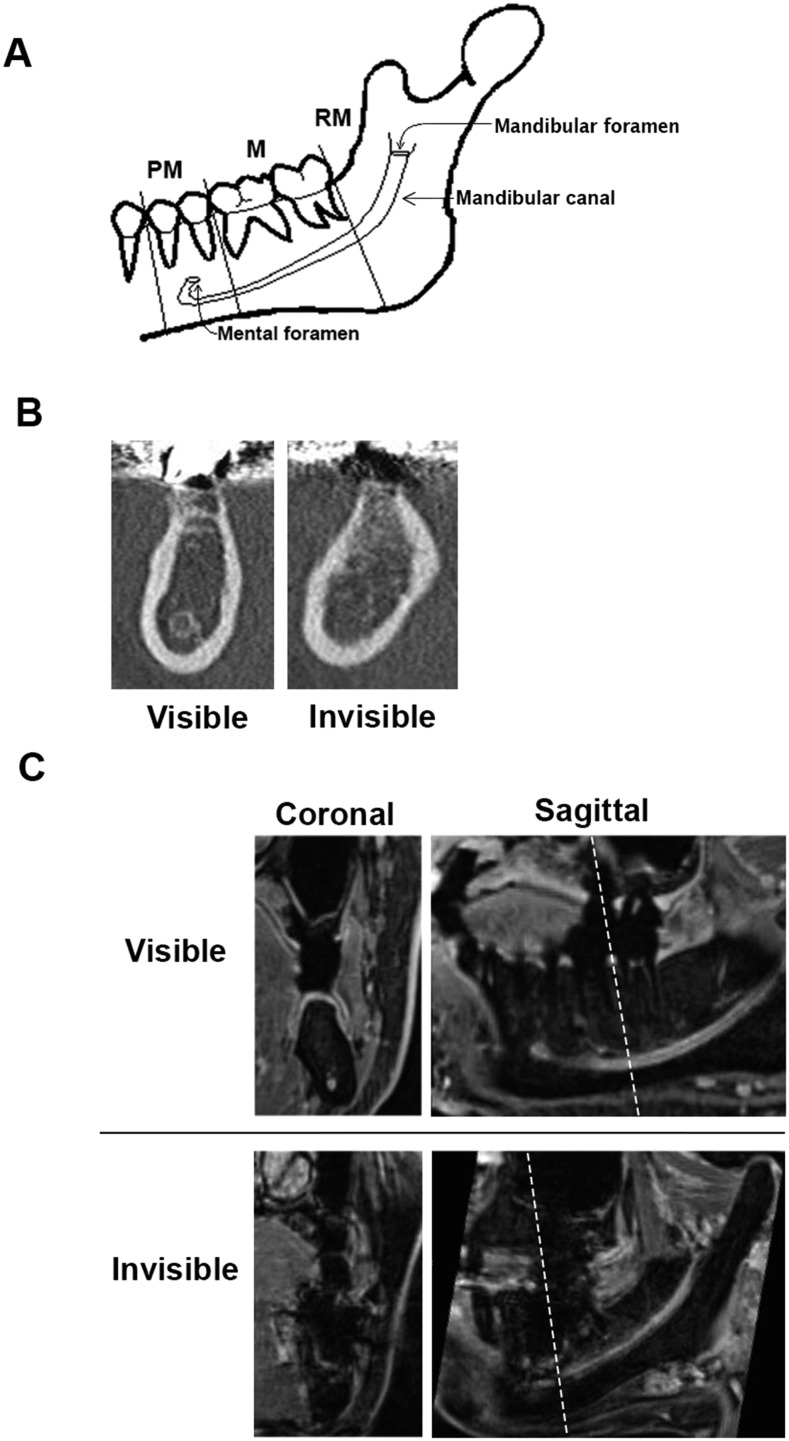
Each hemimandible was divided in three areas for evaluation: premolar (PM), molar (M) and retromolar (RM) (Figure 1a). Evaluations were performed on the syngo®.via workstation with a 24.1-inch light-emitting diode monitor (EIZO, Ishikawa, Japan) in a dim room. An MC was defined as visible in an area when the bony cortex of the MC was clearly seen as a circle on a coronal view. Invisible was defined as a partially or fully missing portion of the cortex (Figure 1b).
Figure 1.
(a) Schema of the hemimandible and mandibular canal (MC). MC visibility was evaluated in three areas: premolar (P), molar (M) and retromolar (RM). (b) Example of cases where the MC was visible (left) or not visible (right) on CT coronal views. Visible was defined by a clearly visible and circular bony cortex of the MC. Invisible was defined by a partially visible or completely invisible portion of the cortex. (c) Example of cases where the neurovascular bundle (NVB) was visible (upper) or invisible (lower) on three-dimensional volumetric interpolated breath-hold examination MRI. The images on the left are coronal views. The images on the right are sagittal views. The dotted lines indicate the locations of the coronal views. Visible was defined by a trackable course via continuous high signal intensity. Invisible was defined by an interruption in the course of the NVB. Determinations were based on coronal views.
The visibility of NVBs was evaluated in the same manner in three areas on coronal views. An NVB was defined as visible in an area when one can track the course of continuous high signal intensity. An invisible NVB was defined as an interruption in the course of the NVB (Figure 1c).
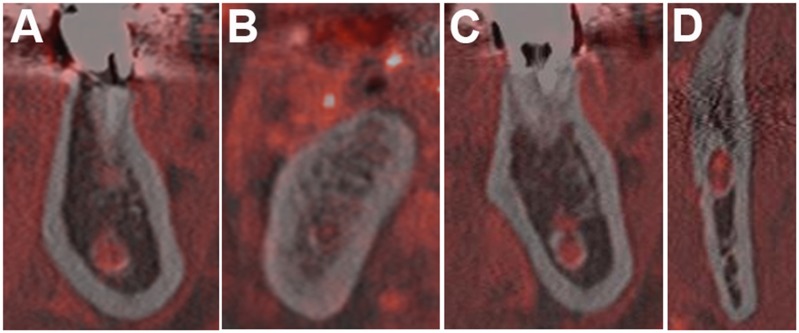
After we investigated MC and NVB visibility, we assessed the relationship of both anatomical constructions on the CT/MR fusion images. It is generally accepted that the MC is filled by the NVB based on anatomical studies, but the NVB on MRI might appear different, mainly because of MRI-specific image distortions. Thus, we first evaluated whether each NVB was identical to the MC and then matched each MC and NVB. We classified MC and NVB configurations into three patterns: same pattern, if the area within the MC was occupied by NVB; small pattern, if the NVB was partially occupying the area of the MC; and large pattern, if the NVB was sticking out of the MC area (Figure 2).
Figure 2.
Matching patterns on CT/MRI volumetric fusion images: (a) same pattern; (b–d) variations of the small pattern. The large pattern was not observed in this study. (b) A tiny dot is present in the mandibular canal (MC) because there was a motion artefact, as shown in Figure 4c. (c) An area of signal void in the superior MC is present, which might be due to the inferior alveolar nerve. Images similar to (d) were frequently seen in retromolar areas. Spots with high signal intensity might represent the inferior alveolar artery and vein.
Next, we reviewed only the 3D-VIBE images to investigate whether they could be used as an alternative to CT images. The 3D-VIBE images were expressed in an inverted style using the “inverted” lookup table. Careful observation to check whether the anatomical structures could be identified as similar to those on CT images was performed.
Lastly, we investigated whether CT/MR fusion images can improve the detectability of the MC when they were invisible on CT images. We determined whether it would be helpful to identify the course of the MC on CT/MR fusion images.
Statistical analysis
Intraclass correlation analysis was used to evaluate intraobserver variability. Spearman's correlation coefficient was used to assess the interobserver variability between the two observers. Fisher's exact test was used to evaluate a significant difference in Table; p < 0.01 was considered to be statistically significant.
Results
The visibility of the MC on CT and NVB on MRI was evaluated for 49 MCs. Each hemimandible was divided into three areas (PM, M and RM). A total of 147 areas were evaluated. On CT, 100 areas were classified as visible, while 47 areas were invisible. Invisible areas were the most common in the PM area (31 cases), followed by the M area (14 cases) and the RM area (2 cases). The NVB was visible on MRI in all three areas in all but one hemimandible (Table 1). In general, NVBs could be identified as structures with high signal intensity on 3D-VIBE images, but there were some cases in which the inferior alveolar vessels were seen separately or the margins of the NVB seemed to be somewhat irregular because of the existence of several branches. These evaluations were performed twice. Intraobserver reliability for the MC and NVB was 0.923 and 1.000, and interobserver reliability was 0.741 and 1.000, respectively.
Table 1.
Visibility of the mandibular canal on CT and neurovascular bundles on MR in three divided areas
| Modality | PM | M | RM | Total | |
|---|---|---|---|---|---|
| CT | Visible | 18 | 35 | 47 | 100 |
| Invisible | 31 | 14 | 2 | 47 | |
| MRI | Visible | 48 | 48 | 48 | 144 |
| Invisible | 1 | 1 | 1 | 3 | |
M, molar; PM, premolar; RM, retromolar areas.
To determine whether the NVBs depicted on MRI correspond to areas within MCs, we first investigated whether each NVB location was identical to the MC. There was no “not identical” cases; so, we proceeded to perform the matching pattern test between the NVB and MC in each area on the CT/MR fusion volumetric images. These observations were performed for the areas where the MCs were visible on CT (100 areas). As a result, the same pattern was seen in 79 areas, a small pattern in 21 areas and a large pattern in 0 cases (Table 2). The small pattern was frequently observed in the RM area (17 areas) (Figure 2).
Table 2.
The results of the matching pattern test for 100 cases on CT/MR fusion volumetric images
| Identical pattern | PM | M | RM | Total (%) | |
|---|---|---|---|---|---|
| Identical | 18 | 35 | 47 | 100 (100) | |
| Same | 16 | 33 | 30 | 79 (79) | |
| Small | 2 | 2 | 17 | 21 (21) | |
| Large | 0 | 0 | 0 | 0 (0) | |
| Not identical | 0 | 0 | 0 | 0 (0) | |
| Total (%) | 18 (18) | 35 (35) | 47 (47) | 100 (100) | |
M, molar; PM, premolar; RM, retromolar areas.
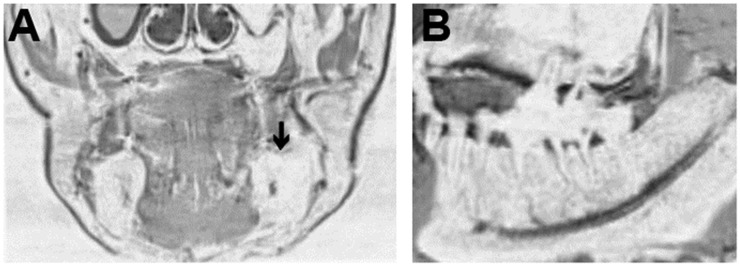
Next, we investigated whether 3D-VIBE images could be used as an alternative to CT images by carefully reviewing only 3D-VIBE images. We could identify almost all of the anatomical structures of the mandible seen on CT. However, we encountered some difficulties when attempting to identify the alveolar crest and interalveolar bone and distinguishing the cancellous bone from the buccal fat pad (Figure 3).
Figure 3.
Three-dimensional volumetric interpolated breath-hold examination image of the mandible. The images were expressed in a signal inverted style using the “inverted” lookup table on a syngo®.via viewer. (a) Coronal image of the mandible: the contour of the right mandible is clearly defined. However, the left mandible is difficult to distinguish from the buccal fat pad (arrow). (b) Sagittal image of the mandible: the neurovascular bundles and their major branches are clearly depicted. However, the details of the mandibular structures, such as the periodontal ligament and alveolar crest, are not clearly depicted.
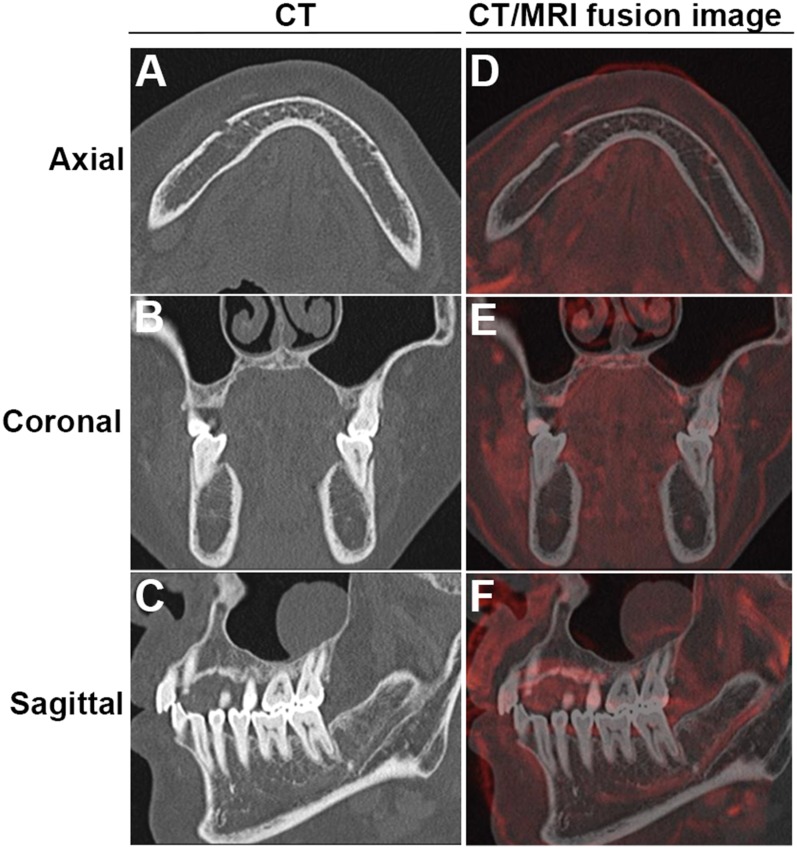
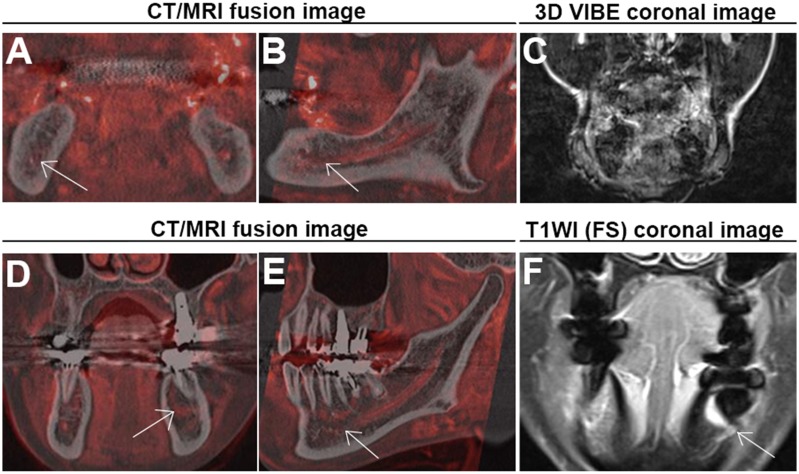
Finally, we confirmed whether using fusion images could improve identification of the MC when it is invisible on CT. In almost all cases, the course of the MC became clearer with the 3D-VIBE signals because the NVB served as a guide on CT/MR fusion images. A representative case is shown in Figure 4. However, there were two cases where the fusion image did not work effectively (Figure 5).
Figure 4.
Representative images where neurovascular bundle (NVB) signals could help us identify the course of a mandibular canal (MC) that is not visible on CT. (a–c) are corresponding CT axial, coronal and sagittal (right side) images, respectively, where the MC could not be identified in the premolar (PM) and molar (M) areas. (d–f) are corresponding axial, coronal and sagittal CT/MR fusion images, respectively, that could assist in MC detection. The NVB is depicted as a red structure.
Figure 5.
Two cases in which CT/MR volumetric fusion images that did not help with mandibular canal (MC) identification. (a) The arrow indicates the small pattern in the premolar (PM) area. (b) The neurovascular bundles (NVBs) had some fluctuations through the course of the MC (arrow). (c) Coronal three-dimensional volumetric interpolated breath-hold examination (3D-VIBE) image with motion artefact, which could make the NVB harder to identify. (d, e) shows a thin NVB signal in the PM area, but there was a high signal in a semi-circular band around tooth 36. (f) A coronal gadolinium-enhanced T1 weighted image (T1WI) with fat suppression (FS) clearly showing a metal artefact in the corresponding area, which can degrade the NVB signal (arrow).
Discussion
CT seems to be a useful modality for visualizing the course of the MC, but there are limitations to the visibility of the MC. The proportion of visible MCs ranged from 42% to 92% in previous reports,2,4,6,11,12 compared with 68% (100/147 MCs) in this study. Our relatively lower rate of detection might be due to a strict definition for visible, but we used it to confirm whether the NVB on MRI could really be matched to the MC on CT. In contrast, the NVB visibility rate was 98% (144/147 MCs) on 3D-VIBE MRI, which was significantly higher than that for the MC on CT (Fisher's exact test: p < 0.0001) (Table 1). Although others have reported the NVB visibility rate was 100%,4,5 we experienced one invisible case in three areas. In this case, the NVB could not be seen as a result of motion artefacts (Figure 1c invisible case, Figures 2b and 5a–c).
The 3D-VIBE sequence could depict almost all NVBs in this study. The NVB and MC locations were identical. This sequence produces a data set of tiny isotropic voxels of the entire mandible in 3 min and 35 s, with a voxel size of 0.78 mm. We have used this sequence only for enhanced MRI examinations, which enabled us to observe lesions and their surrounding structures in arbitrary sections with image reconstruction.13 However, we found that 3D-VIBE has some limitations in depicting the alveolar crest and interalveolar bone and distinguishing the cancellous bone from the buccal fat pad (Figure 3). On the other hand, CT image data are composed of voxels ranging from 0.25 × 0.25 × 0.6 mm to 0.31 × 0.31 × 0.6 mm, depending on FOV size. CT is relatively weak in the longitudinal direction because of spiral scanning, and the minimum thickness can be up to 0.6 mm. Setting the slice increment to 0.3 mm (50% overlapping images) may compensate for the slick thickness. A fusion volumetric image could be realized from these fine CT and MRI data sets, with the help of the syngo®.via workstation. The syngo®.via can create fusion volumetric images very easily, as the user does not need to worry about differences in voxel size because the fusion status can be adjusted with the “visual alignment” function. With this function, the voxel size for the fusion image is equal to the CT voxel size because the MR image is fused to the CT base images. The resultant fusion image could be observed in three dimensions, and the fusion sectional images could be saved in our imaging archives. In this study, the fusion images could not be obtained solely by using the “automatic registration” function, but required repeated use of the manual “visual alignment” function (i.e. trial and error). We consider that the objectivity of image fusion would be warranted by the consistency in the bilateral heads of the mandible and the chin; in the future, however, it would be optimal to develop an automatic matching algorithm.
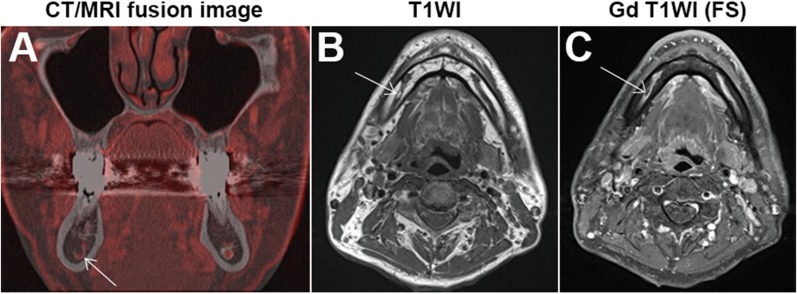
Concerning the matching test between MC and NVB on CT/MRI volumetric fusion images, it should be noted that no large patterns were observed in this study. Thus, it is unlikely that we overestimated NVB size on MRI. On the contrary, there were 21 (21%) cases of the small pattern. The small pattern was frequently observed in the RM area. A typical image is shown in Figure 2d; there are two isolated red dots that were included in the MC. Based on the known anatomy, we speculated they might be the inferior alveolar artery and the vein, and the other area with signal void could be the inferior alveolar nerve.14 We consider that the nerve in the RM area would be thick enough to be visualized as an area with signal void, but it would be thinner as it runs distally.14 In fact, the same pattern was most common in the PM and M areas, except for four cases with the small pattern. Two of four cases were derived from one patient, in which the NVB signal could not be obtained from a motion artefact (Figure 5a). One of the remaining two cases is shown in Figure 6. This case was suspicious because of a fat signal in the MC. Another case also had a void signal in the MC, which corresponded to the inferior alveolar nerve (Figure 2c).
Figure 6.
An example of the small pattern: (a) a coronal CT/MR fusion image showing the small pattern in the right molar (M) area. The pattern appears as a red hook in the mandibular canal (MC). (b) A T1 weighted axial image showing a structure with high signal intensity within the MC. (c) An axial gadolinium (Gd)-enhanced T1 weighted image (T1WI) with fat suppression (FS) showing an area of signal void within the enhanced course of the neurovascular bundles. These findings indicate that the area is composed of fat.
In general, NVBs could be identified on 3D-VIBE images except for one case with motion artefact, but we also experienced another case that had a metal artefact (Figure 5d–f). The NVB was visible, but the MC was determined to be invisible in the PM area; so, it did not meet the criteria for the matching pattern test. The course of the MC would be expected to be clear in CT/MR fusion images. However, the NVB in the PM area seemed to be abnormally thin, which was determined to be a metal artefact based on conventional MR images. This case calls our attention to the possibility of metal artefacts and that we have to note whether there is such an artefact on conventional MR images before reviewing 3D-VIBE images.
There are some limitations in this study. We collected 31 CT and MRI data sets over a 5-month period, which might be a small sample size. However, our goal was to obtain enough data for a pilot study, and the findings supported our hypothesis. A larger prospective study to verify these results is planned for the near future. Another concern is that this study is based on enhanced MRI examinations. Our 3D-VIBE protocol is performed during the last session of the MRI examination, after Gd injection. Goto et al8 reported that non-enhanced 3D-VIBE images can show the structures of the mandible clearly, but did not describe the visibility of the NVB specifically. The necessity of Gd enhancement is a subject for future study.
In this study, we found that MR volumetric fusion images can depict the NVB. We found that fusion images were effective in cases where CT could not depict the MC, except in two cases. One involved motion artefacts and the other involved a metal artefact. This technique can be easily introduced into daily clinical practice. We can recommend ordering an MRI examination to a dentist when CT cannot depict the MC well, when doing so is clinically necessary. Possible scenarios of clinical necessity include dental implant planning; surgical planning for removal of cysts, benign tumours or malignant tumours; tooth extraction planning; and orthodontic surgical planning. Although it might be argued that MRI is too expensive to introduce into daily use in the dental clinic, this technology enables us to detect NVB even when any other modalities could not, thereby improving the safety of treatment in the dental field.
Conclusions
3D-VIBE MRI can accurately depict the NVB of the MC. Compared with CT alone, CT/3D-VIBE MR fusion volumetric images improve MC detectability.
Acknowledgments
Acknowledgments
The authors are grateful to Dr Kazuto Kurohara from the Department of Maxillofacial Surgery, Tokyo Medical and Dental University, and Dr Atsushi Kaida from the Department of Oral Radiation Oncology, Tokyo Medical and Dental University, for providing useful suggestions.
References
- 1.Rich J, Golden BA, Phillips C. Systematic review of preoperative mandibular canal position as it relates to postoperative neurosensory disturbance following the sagittal split ramus osteotomy. Int J Oral Maxillofac Surg 2014; 43: 1076–81. doi: https://doi.org/10.1016/j.ijom.2014.03.020 [DOI] [PMC free article] [PubMed] [Google Scholar]
- 2.Jung YH, Cho BH. Radiographic evaluation of the course and visibility of the mandibular canal. Imaging Sci Dent 2014; 44: 273–8. doi: https://doi.org/10.5624/isd.2014.44.4.273 [DOI] [PMC free article] [PubMed] [Google Scholar]
- 3.Sahman H, Sekerci AE, Sisman Y, Payveren M. Assessment of the visibility and characteristics of the mandible incisive canal: cone beam computed tomography versus panoramic radiography. Int J Oral Maxillofac Implants 2014; 29: 71–8. doi: https://doi.org/10.11607/jomi.3304 [DOI] [PubMed] [Google Scholar]
- 4.Takahashi A, Watanabe H, Kamiyama Y, Honda E, Sumi Y. Localizing the mandibular canal on dental CT reformatted images: usefulness of panoramic views. Surg Radiol Anat 2013; 35: 803–9. doi: https://doi.org/10.1007/s00276-013-1120-6 [DOI] [PubMed] [Google Scholar]
- 5.Anson C. Comparison between the use of magnetic resonance imaging and cone beam computed tomography for mandibular nerve identification. Clin Oral Implants Res 2012; 23: 253–6. doi: https://doi.org/10.1111/j.1600-0501.2011.02188.x [DOI] [PubMed] [Google Scholar]
- 6.Imamura H, Sato H, Matsuura T, Ishikawa M, Zeze R. A comparative study of computed tomography and magnetic resonance imaging for the detection of mandibular canals and cross-sectional areas in diagnosis prior to dental implant treatment. Clin Implant Dent Relat Res 2004; 6: 75–81. doi: https://doi.org/10.1111/j.1708-8208.2004.tb00029.x [DOI] [PubMed] [Google Scholar]
- 7.Eggers G, Rieker M, Fiebach J, Kress B, Dickhaus H, Hassfeld S. Geometric accuracy of magnetic resonance imaging of the mandibular nerve. Dentomaxillofac Radiol 2005; 34: 285–91. doi: https://doi.org/10.1259/dmfr/89236515 [DOI] [PubMed] [Google Scholar]
- 8.Goto TK, Nishida S, Nakamura Y, Tokumori K, Nakamura Y. The accuracy of 3-dimensional magnetic resonance 3D vibe images of the mandible: an in vitro comparison of magnetic resonance imaging and computed tomography. Oral Surg Oral Med Oral Pathol Oral Radiol Endod 2007; 103; 550–9. doi: https://doi.org/10.1016/j.tripleo.2006.03.011 [DOI] [PubMed] [Google Scholar]
- 9.Rofsky NM, Lee VS, Laub G, Pollack M, Krinsky GA, Thomasson D, et al. Abdominal MR imaging with a volumetric interpolated breath-hold examination. Radiology 1999; 212: 876–84. doi: https://doi.org/10.1148/radiology.212.3.r99se34876 [DOI] [PubMed] [Google Scholar]
- 10.Geevarghese R, O'Gorman Tuura R, Lumsden DE, Samuel M, Ashkan K. Registration accuracy of CT/MRI fusion for localisation of deep brain stimulation electrode position: an imaging study and systematic review. Stereotact Funct Neurosurg 2016; 94: 159–63. doi: https://doi.org/10.1159/000446609 [DOI] [PubMed] [Google Scholar]
- 11.Miles MS, Parks ET, Eckert GJ, Blanchard SB. Comparative evaluation of mandibular canal visibility on cross-sectional cone-beam CT images: a retrospective study. Dentomaxillofac Radiol 2016; 45: 20150296. doi: https://doi.org/10.1259/dmfr.20150296 [DOI] [PMC free article] [PubMed] [Google Scholar]
- 12.Shokri A, Shakibaei Z, Langaroodi AJ, Safaei M. Evaluation of the mandibular canal visibility on cone-beam computed tomography images of the mandible. J Craniofac Surg 2014; 25: e273–7. doi: https://doi.org/10.1097/SCS.0000000000000654 [DOI] [PubMed] [Google Scholar]
- 13.Srinivasan K, Seith A, Gadodia A, Sharma R, Kumar A, Roychoudhury A, et al. Evaluation of the inferior alveolar canal for cysts and tumors of the mandible-comparison of multidetector computed tomography and 3-dimensional volume interpolated breath-hold examination magnetic resonance sequence with curved multiplanar reformatted reconstructions. J Oral Maxillofac Surg 2012; 70: 2327–32. doi: https://doi.org/10.1016/j.joms.2011.10.026 [DOI] [PubMed] [Google Scholar]
- 14.Kim ST, Hu KS, Song WC, Kang MK, Park HD, et al. Location of the mandibular canal and the topography of its neurovascular structures. J Craniofac Surg 2009; 20: 936–9. doi: https://doi.org/10.1097/SCS.0b013e3181a14c79 [DOI] [PubMed] [Google Scholar]


