Abstract
Objectives:
The aim of this study was to assess the reliability and accuracy of three different imaging software packages for three-dimensional analysis of the upper airway using CBCT images.
Methods:
To assess the reliability of the software packages, 15 NewTom 5G® (QR Systems, Verona, Italy) CBCT data sets were randomly and retrospectively selected. Two observers measured the volume, minimum cross-sectional area and the length of the upper airway using Amira® (Visage Imaging Inc., Carlsbad, CA), 3Diagnosys® (3diemme, Cantu, Italy) and OnDemand3D® (CyberMed, Seoul, Republic of Korea) software packages. The intra- and inter-observer reliability of the upper airway measurements were determined using intraclass correlation coefficients and Bland & Altman agreement tests. To assess the accuracy of the software packages, one NewTom 5G® CBCT data set was used to print a three-dimensional anthropomorphic phantom with known dimensions to be used as the “gold standard”. This phantom was subsequently scanned using a NewTom 5G® scanner. Based on the CBCT data set of the phantom, one observer measured the volume, minimum cross-sectional area, and length of the upper airway using Amira®, 3Diagnosys®, and OnDemand3D®, and compared these measurements with the gold standard.
Results:
The intra- and inter-observer reliability of the measurements of the upper airway using the different software packages were excellent (intraclass correlation coefficient ≥0.75). There was excellent agreement between all three software packages in volume, minimum cross-sectional area and length measurements. All software packages underestimated the upper airway volume by −8.8% to −12.3%, the minimum cross-sectional area by −6.2% to −14.6%, and the length by −1.6% to −2.9%.
Conclusions:
All three software packages offered reliable volume, minimum cross-sectional area and length measurements of the upper airway. The length measurements of the upper airway were the most accurate results in all software packages. All software packages underestimated the upper airway dimensions of the anthropomorphic phantom.
Keywords: reproducibility of result, software, upper airway, CBCT, phantom
Introduction
The upper airway is an important and complex anatomical structure in respiratory medicine. The anatomical and functional abnormalities of the upper airway play an important role in the pathogenesis of many breathing disorders such as obstructive sleep apnea (OSA).1,2
Recently, CBCT has been used to analyze the upper airway three dimensionally.3 In this context, it is important to emphasize that the ever-increasing use of medical CT technologies since the 1980s has raised concerns about possible cancer risks.4 The radiation dose incurred by CBCT scanners is lower than that from medical CT scanners, which makes CBCT easier to justify as part of the diagnostic procedure.5
After image acquisition, CBCT data sets are usually saved as digital imaging and communications in medicine files and imported into dedicated software packages for upper airway analysis. A wide variety of engineering, medical and dental software packages are currently available on the market.6,7 To the best of our knowledge, the reliability and accuracy of most software packages for upper airway analysis have not yet been tested.3
One previous study concluded that several software packages showed high reliability in the volume measurement of the upper airway but without mentioning their reliability in the area of and linear measurements of the upper airway.7 Moreover, the study did not assess the accuracy of the upper airway measurements. Three previous studies have, however, used artificial phantom models of the upper airway as a gold standard to assess the accuracy of software packages.6,8,9 In this context, it should be noted that such phantom models were mostly manufactured using generic forms, which do not correctly mimic the complex anatomy of the upper airway. Recent developments in the field of three-dimensional (3D) printing offer new opportunities for manufacturing life-like anthropomorphic phantoms.10 In the present study, an anthropomorphic phantom was manufactured based on the anatomical characteristics of a human. This is, to the best of our knowledge, the first time a humanoid phantom has been used to assess the accuracy of different imaging software packages for upper airway analysis.
The aim of this study was to assess the reliability and accuracy of three different software packages for linear, area and volume measurements of the upper airway using CBCT images.
Methods and materials
Part I: reliability of software packages
The participants were referred to the Department of Oral and Maxillofacial Radiology at the Academic Centre for Dentistry Amsterdam, Netherlands, between 1 April 2013 and 1 July 2014 for the examination of their temporomandibular joints (approved by the Medical Ethics Committee of the VU University, Amsterdam, protocol number: NL18726.029.07).
15 NewTom 5G® (QR systems, Verona, Italy) CBCT data sets of these participants (mean age ± standard deviation = 39.6 ± 12.6 years; 67% females, 23% males) were randomly and retrospectively selected from the image archives of the Department of Oral and Maxillofacial Radiology at the Academic Centre for Dentistry, Amsterdam, Netherlands.2
Two observers (a radiologist and an orthodontist) measured the volume, the minimum cross-sectional area (CSAmin) and the length of the upper airway using Amira® engineering software v. 4.1 (Visage Imaging Inc., Carlsbad, CA), 3Diagnosys® medical software v. 5.3.1 (3diemme, Cantu, Italy) and OnDemand3D® dental software (CyberMed, Seoul, Republic of Korea).6,11,12 After 10 days, the measurements were repeated. During the second measurement session, all CBCT data sets were analyzed in random order to allow for a blinded assessment, and the observers did not have access to their previous measurements.
In all three software packages, the upper airway was segmented from the hard palate plane to the base of the epiglottis and saved as a standard tessellation language (STL) model. The volume, CSAmin and length of the upper airway were calculated from these STL models. In Amira, CSAmin was calculated automatically. The corresponding CBCT image slice was subsequently used in 3Diagnosys and OnDemand3D to calculate CSAmin.
Part II: accuracy of software packages
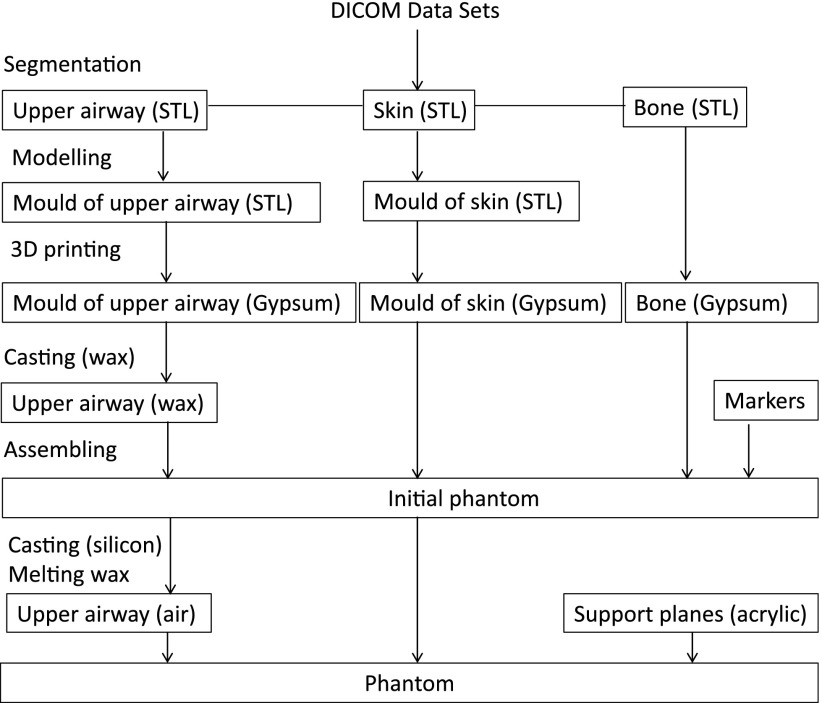
One existing CBCT data set of a patient (27-year-old female) was used to fabricate an anthropomorphic phantom of the upper airway volume with known dimensions. The data set was converted into a STL model of the upper airway, which served as the “gold standard” in this study. The gold standard STL model of the upper airway was subsequently used to manufacture the anthropomorphic phantom according to the steps described in Figure 1. The material used to mimic the bony tissue surrounding the upper airway was ZP151 high-performance composite powder (3D Systems, Rock Hill, SC). The material used to mimic the soft tissue surrounding the upper airway was liquid silicon (Dragon Skin® 30, Smooth-On, Inc., Macungie, PA). Three metal markers (diameter × height = 3 × 3 mm) were placed in the phantom corresponding to the axial plane in which the CSAmin of the upper airway was located. The volume, the CSAmin in the plane indicated by the markers and the length were measured on the STL model of the phantom (Figure 2) using Geomagic 3D scanning, design and reverse engineering software (studio® 2012; 3D Systems, Morrisville, NC). These measurements were considered as the gold standard values.
Figure 1.
Flowchart for manufacturing the phantom. 3D, three-dimensional; DICOM, digital imaging and communications in medicine; STL, standard tessellation language.
Figure 2.
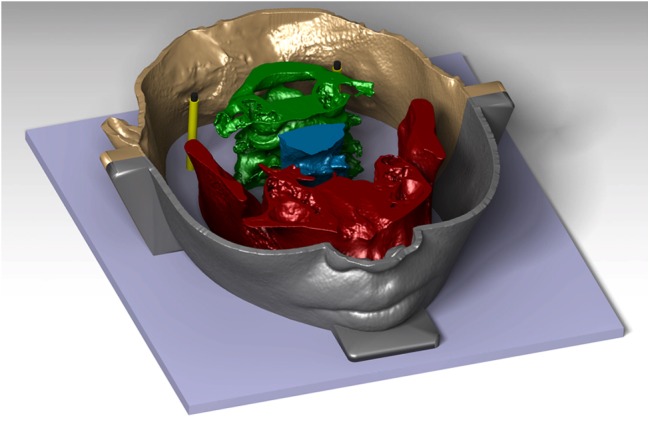
Representation of the standard tessellation language file of the phantom, containing the maxilla and mandible, cervical vertebrae, supports of the markers at the level of the minimum cross-sectional area of the upper airway, upper airway and the mould of the skin. (With permission of Oxford Press, Eur J Orthod 2017 cjx030. doi: 10.1093/ejo/cjx030).
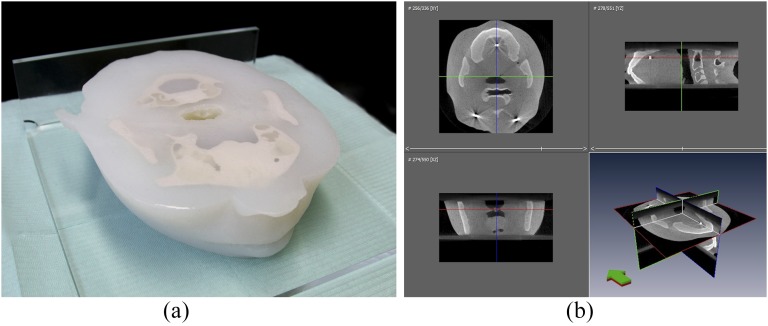
The anthropomorphic phantom (Figure 3a) was scanned using a NewTom 5G® CBCT scanner. The exposure settings were 110 kV, 4 mA, 18 × 16-cm field of view, 0.3-mm voxel size and 3.6-s exposure time (pulsed radiation). The resulting CBCT images of the phantom were saved as digital imaging and communications in medicine files and imported into Amira®, 3Diagnosys® and OnDemand3D® to measure the volume, CSAmin and length of the upper airway (Figure 3b). To minimize the random error, these measurements were performed 20 times over 20 days (once per day) by one observer (an orthodontist).
Figure 3.
The three-dimensional printed phantom (a) and its CBCT images (b). The soft and hard tissues as well as the airway space can be clearly distinguished.
Statistical methods
All measurements were imported into Microsoft® Excel® (2007; Microsoft Corporation, Redmond, WA) and statistically evaluated using the IBM Statistical Package for Social Sciences for Windows (SPSS® v. 21; IBM Corp., New York, NY; formerly SPSS Inc., Chicago, IL). Statistical significance was set at α = 0.05.
Intraclass correlation coefficients (ICCs) were calculated to evaluate the intra- and interobserver reliability of the measurements. Reliability was divided into three categories: poor (ICC < 0.40); fair to good (0.40 ≤ ICC ≤ 0.75); and excellent (ICC > 0.75).13 Furthermore, Bland–Altman agreement tests with confidence intervals set at 95% were used to assess the agreement between the three software packages.14,15
To evaluate the accuracy of the software packages, the one-sample t-test was used to test the difference between the gold standard values and the measurements of the upper airway. The measurement error (%) was calculated as the difference between the measurements performed on the CBCT-derived models of the upper airway and the gold standard values. One-way ANOVA was used to test the difference in the measurements of the upper airway on the CBCT images of the phantom using the three different software packages. The independent variable was the software package; the dependent variables were the volume, CSAmin and length of the upper airway.
Results
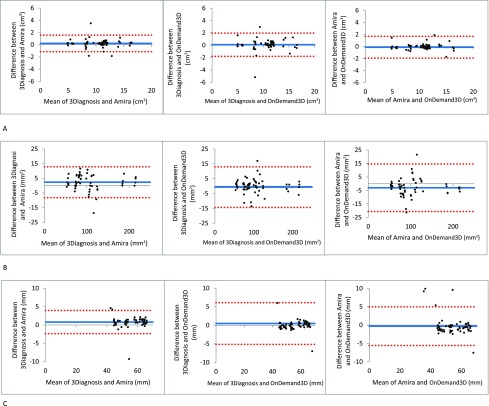
The intra- and interobserver reliability of the measurements of the upper airway using all three software packages were excellent (ICC ≥ 0.75) as shown in Table 1. Furthermore, high reliability was observed for all three software packages, with narrow confidence intervals, thereby demonstrating excellent agreement for all upper airway measurements (Figure 4).
Table 1.
Intraclass correlation coefficient for the measurements of the upper airway
| Software package | Amira® (Visage Imaging Inc., Carlsbad, CA) |
3Diagnosys® (3diemme, Cantu, Italy) |
OnDemand3D® (CyberMed, Seoul, Republic of Korea) |
||||||
|---|---|---|---|---|---|---|---|---|---|
| Intra | Inter | Intra | Inter | Intra | Inter | ||||
| Volume of the upper airway (cm3) | 0.98 | 0.99 | 0.97 | 0.98 | 0.97 | 0.97 | 0.99 | 0.82 | 0.89 |
| CSAmin (mm2) | 1.00 | 1.00 | 0.99 | 0.99 | 0.99 | 0.99 | 0.97 | 0.99 | 0.97 |
| Length of the upper airway (mm) | 1.00 | 0.78 | 0.85 | 0.99 | 0.99 | 0.99 | 0.97 | 0.98 | 0.90 |
CSAmin, minimum cross sectional area; inter, interobserver reliability; intra, intraobserver reliability.
Figure 4.
Bland–Altman plots. (a) Agreement between the software packages with respect to the volume measurement; (b) agreement between the software packages with respect to the minimum cross-sectional area measurement; (c) agreement between the software packages with respect to the length measurement. Dotted line: upper and lower bounds of the 95% confidence interval; solid line: mean difference.
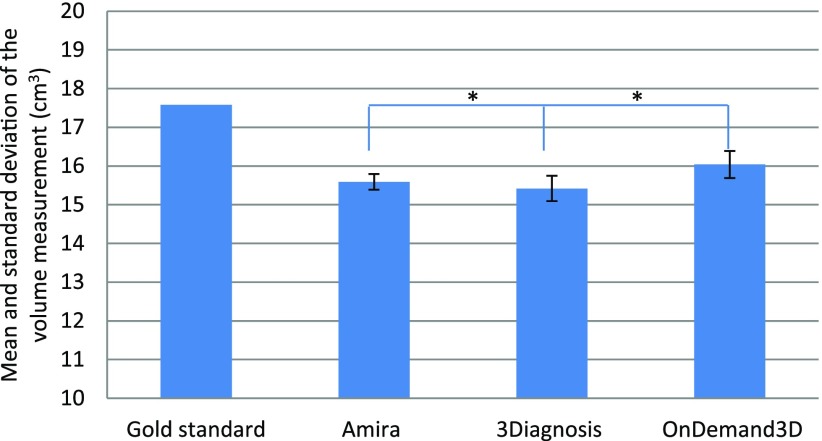
The 3D printed anthropomorphic phantom and the CBCT images of this phantom are shown in Figure 3. There were significant differences between the gold standard values and the measurements of the upper airway using the three dedicated software packages (one sample t-test, p < 0.05; Table 2). The measurement errors (%) of the three software packages are listed in Table 2. All software packages demonstrated errors in the volume (−10.8%), CSAmin (−10.3%) and length (−2.1%) measurements (Table 2). All measurements of the upper airway were smaller than the gold standard. There were significant differences in the measurements between the different software packages (one-way ANOVA, p < 0.05; Figures 5–7).
Table 2.
The measurements of the upper airway based on the phantom and the CBCT images of the phantom
| Measurement | Phantom (1) | CBCT of the phantom (mean ± standard deviation) (2) |
ME (%) [mean (2) − (1)]/(1) |
|||||
|---|---|---|---|---|---|---|---|---|
| Amira® (Visage Imaging Inc., Carlsbad, CA) | 3Diagnosys® (3diemme, Cantu, Italy) | OnDemand3D® (CyberMed, Seoul, Republic of Korea) | Amira | 3Diagnosys | OnDemand3D | Average | ||
| Volume of the upper airway (cm3) | 17.58a | 15.59 ± 0.20 | 15.42 ± 0.33 | 16.04 ± 0.35 | −11.3 | −12.3 | −8.8 | −10.8 |
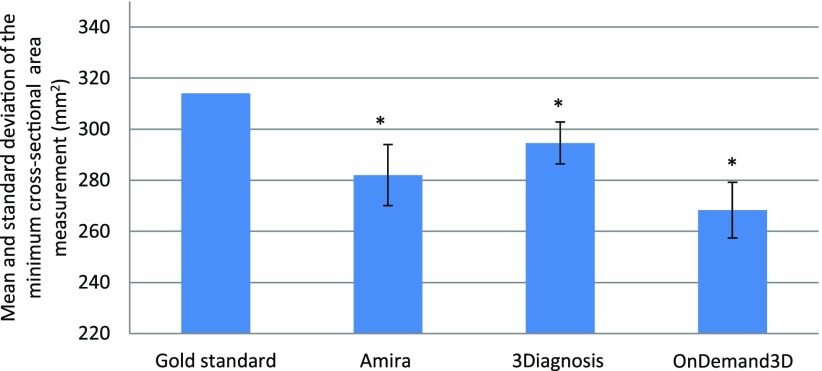
| CSAmin (mm2) | 314.14a | 282.10 ± 11.97 | 294.61 ± 8.20 | 268.31 ± 10.95 | −10.2 | −6.2 | −14.6 | −10.3 |
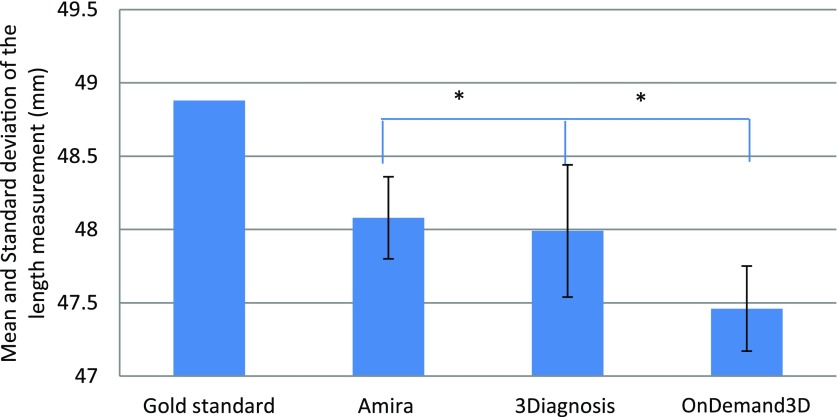
| Length of upper airway (mm) | 48.88a | 48.08 ± 0.28 | 47.99 ± 0.45 | 47.46 ± 0.29 | −1.6 | −1.8 | −2.9 | −2.1 |
CSAmin, minimum cross-sectional area; ME, measurement error, which is the difference between the measurements performed on the CBCT images of the phantom and the gold standard values.
Significant difference between the gold standard values and the measurements performed using each of the three software packages by the one-sample t-test.
Figure 5.
Mean and standard deviation of the volume (cm3) measurement. * indicates a significant difference between OnDemand3D® (CyberMed, Seoul, Republic of Korea) and Amira® (Visage Imaging Inc., Carlsbad, CA) and between 3Diagnosys® (3diemme, Cantu, Italy) and OnDemand3D, p < 0.05.
Figure 7.
Mean and standard deviation of the length (mm) measurement. * indicates a significant difference between OnDemand3D® (CyberMed, Seoul, Republic of Korea) and Amira® (Visage Imaging Inc., Carlsbad, CA) and between 3Diagnosys® (3diemme, Cantu, Italy) and OnDemand3D, p < 0.05.
Figure 6.
Mean and standard deviation of the minimum cross-sectional area (mm2) measurement. * indicates a significant difference between all software packages, p < 0.05.
Discussion
In this study, the reliability and accuracy of three different commercially available software packages (Amira®, 3Diagnosys® and OnDemand3D®) used for the 3D analysis of the upper airway were assessed.
The reliability of the upper airway volume measurements was excellent for all three software packages (Table 1), which is in good agreement with previous studies.6,8,16 Furthermore, Burkhard et al17 conducted a study to investigate the morphological changes in oropharyngeal structures in mandibular prognathic patients before and after orthognathic surgery and concluded that the OsiriX® (Bernex, Switzerland), Mimics® (Leuven, Belgium) and BrainLab® (Feldkirchen, Germany) software packages were reliable in assessing the posterior airway space. However, one previous study by Mattos et al18 reported that CSAmin measurements of the upper airway acquired using Dolphin® (Chatsworth, CA) software were unreliable, which is in contrast to the results of the present study. This difference in results may be due to the ambiguous definition of the CSAmin of the upper airway in the Dolphin® software package.18
The accuracy of the upper airway measurements varied between the software packages (Figure 5–7). All three software packages generally underestimated the upper airway volume by −8.8% to −12.3%, the CSAmin by −6.2% to −14.6% and the length by −1.6% to −2.9% (Table 2). These results are in good agreement with a previous study by El and Palomo,7 who reported that OnDemand3D® software sometimes fails to depict certain parts of the upper airway, which subsequently leads to an underestimation of the airway volume.7 This phenomenon could originate from the CBCT image acquisition process and/or the subsequent image segmentation by means of thresholding. During CBCT image acquisition, anatomical structures are discriminated based on their radiographic density. However, voxels residing on tissue boundaries can contain more than one tissue type. This phenomenon is known as the partial volume effect. The result of the partial volume effect is that voxels are erroneously allocated to “soft tissue” instead of “air” and hence “upper airway” during the image segmentation process.19,20
One way of circumventing these accuracy issues is to calibrate the software packages using a phantom with known dimensions. Most previous studies have used either an acrylic airway model attached to a human dry skull8 or an acrylic block to mimic the upper airway.6,9 Such phantoms are, however, commonly manufactured in simple, generic forms and sizes and therefore do not resemble the attenuation and scattering profiles of human bones, soft tissues and upper airway structures. The phantom used in the present study was composed of 3D printed hard tissue-equivalent gypsum combined with soft tissue-equivalent silicon21 and fiducial markers (Figure 3). These components offered the unique possibility of assessing the reliability and accuracy of upper airway measurements in real life-like conditions. However, one general limitation of using phantoms in validation studies is their static nature that consequently does not portray involuntary head motion22 and physiological movements of the upper airway during breathing.23
One limitation of the present study was that only one CBCT scanner and only three imaging software packages were included. To date, there are a plethora of different software packages in the market for 3D analysis of the upper airway (at least 18 in 2011).3 Future research should focus on evaluating multiple software packages and different imaging modalities in dynamic settings. Another limitation was that the gold standard measurements of the upper airway were obtained from an STL file of a phantom. Therefore, a measurement uncertainty of up to 0.2 mm may have been introduced during the 3D printing procedure of manufacturing the phantom.24 Nevertheless, this uncertainty can be considered clinically insignificant.25
Conclusion
All three software packages assessed in this study offered reliable measurements of the volume, minimum cross-sectional area and length of the upper airway. The length measurements of the upper airway were the most accurate in all software packages. All software packages underestimated the upper airway dimensions. The 3D printed anthropomorphic phantom that was used in this study offered a feasible method to validate software packages used for 3D analysis of the upper airway on CBCT images.
Acknowledgments
Acknowledgments
The authors thank the Oxford University Press for the permission to use the figure 2, which was published before in the European Journal of Orthodontics. Chen H, van Eijnatten M, Aarab G, Forouzanfar T, de Lange J, van der Stelt P, et al. Accuracy of MDCT and CBCT in three-dimensional evaluation of the oropharynx morphology. Eur J Orthod 2017 cjx030. doi: 10.1093/ejo/cjx030.
Contributor Information
Hui Chen, Email: h2.chen@acta.nl.
Maureen van Eijnatten, Email: m.vaneijnatten@vumc.nl.
Jan Wolff, Email: jan.wolff@vumc.nl.
Jan de Lange, Email: j.d.lang@acta.nl.
Paul F van der Stelt, Email: p.vd.stelt@acta.nl.
Frank Lobbezoo, Email: f.lobbezoo@acta.nl.
Ghizlane Aarab, Email: g.aarab@acta.nl.
References
- 1.Lee RWW, Sutherland K, Cistulli PA. Craniofacial morphology in obstructive sleep apnea: A review. Clin Pulm Med 2010; 17: 189–95. doi: https://doi.org/10.1097/cpm.0b013e3181e4bea7 [Google Scholar]
- 2.Chen H, Aarab G, Parsa A, de Lange J, van der Stelt PF, Lobbezoo F. Reliability of three-dimensional measurements of the upper airway on cone beam computed tomography images. Oral Surg Oral Med Oral Pathol Oral Radiol 2016; 122: 104–10. doi: https://doi.org/10.1016/j.oooo.2016.04.005 [DOI] [PubMed] [Google Scholar]
- 3.Guijarro-Martínez R, Swennen GR. Cone-beam computerized tomography imaging and analysis of the upper airway: a systematic review of the literature. Int J Oral Maxillofac Surg 2011; 40: 1227–37. doi: https://doi.org/10.1016/j.ijom.2011.06.017 [DOI] [PubMed] [Google Scholar]
- 4.Linet MS, Slovis TL, Miller DL, Kleinerman R, Lee C, Rajaraman P, et al. Cancer risks associated with external radiation from diagnostic imaging procedures. CA Cancer J Clin 2012; 62: 75–100. doi: https://doi.org/10.3322/caac.21132 [DOI] [PMC free article] [PubMed] [Google Scholar]
- 5.Dawood A, Patel S, Brown J. Cone beam CT in dental practice. Br Dent J 2009; 207: 23–8. doi: https://doi.org/10.1038/sj.bdj.2009.560 [DOI] [PubMed] [Google Scholar]
- 6.Weissheimer A, Menezes LM, Sameshima GT, Enciso R, Pham J, Grauer D. Imaging software accuracy for 3-dimensional analysis of the upper airway. Am J Orthod Dentofacial Orthop 2012; 142: 801–13. doi: https://doi.org/10.1016/j.ajodo.2012.07.015 [DOI] [PubMed] [Google Scholar]
- 7.El H, Palomo JM. Measuring the airway in 3 dimensions: a reliability and accuracy study. Am J Orthod Dentofacial Orthop 2010; 137(Suppl. 4): S50.e1–9; discussion S50–2. doi: https://doi.org/10.1016/j.ajodo.2010.01.014 [DOI] [PubMed] [Google Scholar]
- 8.Ghoneima A, Kula K. Accuracy and reliability of cone-beam computed tomography for airway volume analysis. Eur J Orthod 2013; 35: 256–61. doi: https://doi.org/10.1093/ejo/cjr099 [DOI] [PubMed] [Google Scholar]
- 9.Schendel SA, Hatcher D. Automated 3-dimensional airway analysis from cone-beam computed tomography data. J Oral Maxillofac Surg 2010; 68: 696–701. doi: https://doi.org/10.1016/j.joms.2009.07.040 [DOI] [PubMed] [Google Scholar]
- 10.Mitsouras D, Liacouras P, Imanzadeh A, Giannopoulos AA, Cai T, Kumamaru KK, et al. Medical 3D printing for the radiologist. Radiographics 2015; 35: 1965–88. doi: https://doi.org/10.1148/rg.2015140320 [DOI] [PMC free article] [PubMed] [Google Scholar]
- 11.Nandalike K, Shifteh K, Sin S, Strauss T, Stakofsky A, Gonik N, et al. Adenotonsillectomy in obese children with obstructive sleep apnea syndrome: magnetic resonance imaging findings and considerations. Sleep 2013; 36: 841–7. doi: https://doi.org/10.5665/sleep.2708 [DOI] [PMC free article] [PubMed] [Google Scholar]
- 12.Parsa A, Ibrahim N, Hassan B, van der Stelt P, Wismeijer D. Bone quality evaluation at dental implant site using multislice CT, micro-CT, and cone beam CT. Clin Oral Implants Res 2015; 26: e1–7. doi: https://doi.org/10.1111/clr.12315 [DOI] [PubMed] [Google Scholar]
- 13.Walter SD, Eliasziw M, Donner A. Sample size and optimal designs for reliability studies. Stat Med 1998; 17: 101–10. doi: https://doi.org/10.1002/(SICI)1097-0258(19980115)17:1<101::AID-SIM727>3.0.CO;2-E [DOI] [PubMed] [Google Scholar]
- 14.Bland JM, Altman DG. Statistical methods for assessing agreement between two methods of clinical measurement. Lancet 1986; 1: 307–10. [PubMed] [Google Scholar]
- 15.Zaki R, Bulgiba A, Ismail R, Ismail NA. Statistical methods used to test for agreement of medical instruments measuring continuous variables in method comparison studies: a systematic review. PLoS One 2012; 7: e37908. doi: https://doi.org/10.1371/journal.pone.0037908 [DOI] [PMC free article] [PubMed] [Google Scholar]
- 16.Souza KR, Oltramari-Navarro PV, Navarro Rde L, Conti AC, Almeida MR. Reliability of a method to conduct upper airway analysis in cone-beam computed tomography. Braz Oral Res 2013; 27: 48–54. doi: https://doi.org/10.1590/s1806-83242013000100009 [DOI] [PubMed] [Google Scholar]
- 17.Burkhard JP, Dietrich AD, Jacobsen C, Roos M, Lübbers HT, Obwegeser JA. Cephalometric and three-dimensional assessment of the posterior airway space and imaging software reliability analysis before and after orthognathic surgery. J Craniomaxillofac Surg 2014; 42: 1428–36. doi: https://doi.org/10.1016/j.jcms.2014.04.005 [DOI] [PubMed] [Google Scholar]
- 18.Mattos CT, Cruz CV, da Matta TC, Pereira Lde A, Solon-de-Mello Pde A, Ruellas AC, et al. Reliability of upper airway linear, area, and volumetric measurements in cone-beam computed tomography. Am J Orthod Dentofacial Orthop 2014; 145: 188–97. doi: https://doi.org/10.1016/j.ajodo.2013.10.013 [DOI] [PubMed] [Google Scholar]
- 19.Baumgaertel S, Palomo JM, Palomo L, Hans MG. Reliability and accuracy of cone-beam computed tomography dental measurements. Am J Orthod Dentofacial Orthop 2009; 136: 19–25; discussion 25–8. doi: https://doi.org/10.1016/j.ajodo.2007.09.016 [DOI] [PubMed] [Google Scholar]
- 20.Pham DL, Xu C, Prince JL. Current methods in medical image segmentation. Annu Rev Biomed Eng 2000; 2: 315–37. doi: https://doi.org/10.1146/annurev.bioeng.2.1.315 [DOI] [PubMed] [Google Scholar]
- 21.Steinmann A, Stafford R, Yung J, Followill D. SU-E-J-210: characterizing tissue equivalent materials for the development of a dual MRI-CT heterogeneous anthropomorphic phantom designed specifically for MRI guided radiotherapy systems. Med Phys 2015; 42: 3313–4. [Google Scholar]
- 22.Lee KM, Song JM, Cho JH, Hwang HS. Influence of head motion on the accuracy of 3D reconstruction with cone-beam CT: landmark identification errors in maxillofacial surface model. PLoS One 2016; 11: e0153210. doi: https://doi.org/10.1371/journal.pone.0153210 [DOI] [PMC free article] [PubMed] [Google Scholar]
- 23.Lemu HG, Kurtovic S. 3D printing for rapid manufacturing: study of dimensional and geometrical accuracy. In: Frick J, Laugen B, eds. IFIP advances in information and communication technology. Berlin, Heidelberg: Springer; 2012. pp 470–9. [Google Scholar]
- 24.Khalil W, EzEldeen M, Van de Casteele E, Shaheen E, Sun Y, Shahbazian M, et al. Validation of cone beam computed tomography-based tooth printing using different three-dimensional printing technologies. Oral Surg Oral Med Oral Pathol Oral Radiol Endod 2016; 121: 307–15. [DOI] [PubMed] [Google Scholar]
- 25.Cheng S, Butler JE, Gandevia SC, Bilston LE. Movement of the tongue during normal breathing in awake healthy humans. J Physiol 2008; 586: 4283–94. doi: https://doi.org/10.1113/jphysiol.2008.1564301 [DOI] [PMC free article] [PubMed] [Google Scholar]


