Abstract
We have classified 865 sequences of EF‐hand proteins from five proteomes into 156 subfamilies. These subfamilies were put into six groups. Evolutionary relationships among subfamilies and groups were analyzed from the inferred ancestral sequence for each subfamily. CTER, CPV, and PEF groups arose from a common EF‐lobe (pair of adjacent EF‐hands). They have two or more EF‐lobes; the relative positions of their EF‐lobes differ from each other. Comparisons of the ancestral sequences and the inferred structures of the EF‐lobes of these groups indicate that the mutual positions of EF‐lobes were established soon after divergence of an EF‐lobe for each group and before the duplication and fusion of EF‐lobe gene(s). These ancestral sequences reveal that some subfamilies in low similarity and isolated groups did not evolve from the EF‐lobe precursor, even if their conformations are similar to the canonical EF‐hand. This is an example of convergent evolution.
Keywords: EF‐hand, calcium, evolution, protein family
Introduction
Recent advances in genomic and proteomic analyses of a vast range of organisms have revealed that proteins have evolved through a process of extensive duplication, deletion, and shuffling of domains. The modular nature of domains has facilitated the generation of novel and complex protein functions from a limited set of domain families.1 Based on the similarity of the sequence of domains and/or of the domain structures, proteins are classified into families. A protein family consists of amino sequences that share a common ancestor; all members of the family are homologous to one another. A family can be further divided into subfamilies; members of which have the same or similar functions and/or unique structural features.
The EF‐hand is a motif that consists of an α‐helix “E,” a loop that may bind calcium, and a second α‐helix “F”; the canonical EF‐hand is 29 residues long.2 It is usually found in proteins involved in signal transduction of calcium as a secondary messenger.3 EF‐hand proteins were the first homolog family in which the relationship between primary sequence and tertiary structure could be clearly related.4 EF‐hands usually occur in pairs, the EF‐lobe. The EF‐lobe is a unit of evolution and also a structural unit of EF‐hand domains.
However, there are some exceptions such as the first motif of parvalbumin, which covers the hydrophobic core formed by a pair of EF‐hands.5 The fifth motifs of calpain and of sorcin pair with the fifth motif of another penta‐EF‐hand protein.6, 7 Synthetic peptides that mimic a single EF‐hand or even the calcium binding loop can form dimers that resemble an EF‐lobe.8, 9 Some EF‐hand proteins are composed solely of EF‐hand domains, notably calmodulin and troponin‐C. Others are chimeric proteins in which EF‐hand lobes have fused to others, such as a kinase domain or a protease domain. The EF‐hand, usually found in an EF‐lobe, appears in various structural contexts —at the N‐terminus, in the middle, or at the C‐terminus of chimeric proteins. The EF‐hand has been seen in at least 25 different domain families in metazoan.10 All EF‐hand proteins are inferred to have evolved from a single precursor helix‐loop‐helix domain by gene duplication and fusion; however, a single EF‐hand, of about thirty residues, is so short that one cannot exclude the possibility that it arose de novo several times.11, 12
EF‐hand proteins comprise one of the largest protein families; the number of positive hits of Prosite matrix PS50222 (EF_HAND_2) for UniProtKB/Swiss‐Prot release 2016_06 (551,385 sequence entries) is 4432 EF‐hands in 1613 sequences (http://prosite.expasy.org/PS50222). It can be divided into many subfamilies, each with its own story. Recent advances in structural genomics have revealed that several proteins have EF‐hands and even EF‐lobe like structures; even though, they show very low similarity in sequence. We have defined subfamilies of EF‐hands by both evolutional history and function. When two homologs have similar evolutionary histories but have, or are inferred to have, different functions, they are put into separate subfamilies.
Each EF‐hand protein has a complex history of change of sequence as well as duplication and fusion.12 Nakayama et al. analyzed the evolutions of EF‐hands by aligning EF‐hands from these diverse EF‐hand proteins.12 They identified twenty subfamilies and nine possible subfamilies (UNIQs), each with only one member. Among them, five subfamilies (CAM, TNC, ELC, RLC, and CDC) and three UNIQs (CAL, SQUID, and CDPK) are congruent; this means that the domains 1 of these subfamilies group together as do the domains 2, and so forth. The arrangement of domains 1 within the domain 1 cluster is similar to the arrangement of domains 2 within the domain 2 cluster from that same subfamily, and so forth. and each of the domain subfamily clusters is similar to the dendrogram based on the entire sequence for that subfamily. This group is called CTER. Nakayama et al. identified 66 subfamilies of EF‐hand proteins.13 CTER now contains ten subfamilies—adding TPNV, CLAT, and CAST, and removing CDPK. TPNV is a troponin C like protein from non‐vertebrates. CDPK is a chimeric protein with a kinase domain at the N‐terminus. CLAT has a fifty residue domain at its C‐terminus. CAST has a forty residue domain at its N‐terminus. The evolutionary history of these two domains is unknown. The structure of the extra domain at the N‐terminus of CAST is inferred to be intrinsically disordered as analyzed by DisEMBL http://dis.embl.de/. Other proteins in CTER consist solely of four EF‐hands.
Another congruent group, CPV, consists of: CLNB, P22, VIS, CALS, DREM, CMPK, and SOS3. Other subfamilies were put into the groups—Pairings, Self, and Miscellaneous. We have revised this classification of the EF‐hand family based on recently determined sequences and structures.
Sequence alignment is difficult, since the EF‐hand is only thirty residues long and has suffered many insertions and deletions (indels). Alignment of all EF‐hands in the family is possible but impractical; however, we have maintained a database of tentatively aligned EF‐hands and lobes.2 We first analyzed the local similarity among all of the members of the family; then we made clusters whose members have local or internal similarity. Within these clusters, we checked congruency and classified subfamilies.
EF‐Hand Proteins
Subfamilies of EF‐hand proteins
The EF‐hand was first recognized in the crystal structure of parvalbumin.14 Kretsinger proposed that the EF‐hand could be recognized in protein sequences by considering critical residues.4 The EF‐hand is one of the most frequently observed motifs. The Prosite database lists 4432 EF‐hands in 1613 proteins.15 In our previous paper,13 we classified EF‐hand proteins into 66 subfamilies and discussed the evolutionary relationships among them. Each subfamily contains proteins with the same function and sequence congruency. Since then, the determination of the gene sequences of several organisms has added many new EF‐hands to protein sequence databases and has enabled us to analyze the entire EF‐hand family by a comparative, proteomic approach. We updated our EF‐hand database by searching five proteomes (Saccharomyces cerevisiae, Arabidopsis thaliana, Caenorhabditis elegans, Drosophila melanogastor, and Homo sapiens). This database contains 905 sequences segmented for the regions containing EF‐hand motifs. Some of the newly added EF‐hand sequences are classified as UNIQs, since they do not show clear similarity to the members of established subfamilies.
Classification EF‐hand proteins
Short description of clusters
We analyzed the sequences of 905 EF‐hand proteins by checking local sequence similarity using FASTA and Markov clustering (MCL). We selected pairs with >50% similarity (counting identical or conservative replacements) over a fifty residue span. Some sequences do not show this similarity with any other proteins of our database. We did not analyze these sequences further. We made a network with 884 nodes. MCL clustering of this similarity network (Granularity parameter = 2.0, cut off of similarity = 0.5) gave 44 clusters and 17 singletons (Supporting Information Fig. S1). We removed these 17 singletons for further analysis. We describe the subfamily composition of these 44 clusters and compare them with our previous tabulation.13 The names of subfamilies are based on our previous tables.13, 16
We first classified the UNIQs based on the results of clustering. The assignment of each cluster and subfamily of UNIQs is described in Supporting Information Table S1. We classified 865 sequences into 156 subfamilies (Supporting Information Table S1). We defined subfamilies as a set of homologous sequences that have similar functions. Many of the156 subfamilies were already identified by functional and/or chemical characteristics of representative proteins.16
We list several recent reviews on individual subfamilies or the member of subfamilies as follows. Grabarek described Mg2+ binding properties on CAM, TNC and others.17 Marshall et al. reviewed structure and functions of CAM and STIM.18 Li et al. summarized structure and function of cardiac troponin C (TNC).19 Sheikh et al. reviewed functions of myosin light chain‐2 (RLC).20 Dantas et al. summarized the role of CDC in the centriole and genome maintenance.21 Zhang and He reviewed centrin (CDC).22 Gao et al. summarized CDPK in plants.23 Machnicka summarized structure and function of spectrins (FDRN). Domínguez et al. summarized calcium binding proteins in prokaryotes including CMSE.24 Mielenz and Gunn‐Moore reviewed functions of swiprosin (EFHD_DM). Kolobynina et al. reviewed the functions of P22.25 Sole et al. reviewed P22.26 Lim et al. reviewed structural diversity of neuronal calcium sensor (VIS).27 Campbell and Davis described structure‐function relationship of CALP.28 Maki et al. reviewed functions of ALG‐2 (SORC).29 Colotti et al. reviewed SORC in cancer cells.30 Leclerc and Heizmann reviewed S100.31 Kizawa et al. reviewed S100 and HYFL.32 Bradshaw described diverse functions of BM40.33 García‐Galiano et al. described NUBN.34 Hajnóczky et al reviewed mitochondrial EF‐hand proteins including MIRO and SCMC.35 Del Arco et al. reviewed SCMC.36 Schwaller reviewed calretinin (CLBN).37 Tang reviewed MIRO.38
Classification of subfamilies
Next, we analyzed the relationship among these 156 subfamilies. Using 865 sequences classified into subfamilies, we searched for homologs among 20 proteomes (Amphimedon queenslandica, Arabidopsis thaliana, Bombyx mori, Caenorhabditis elegans, Chlamydomonas reinhardtii, Ciona intestinalis, Coprinopsis cinerea, Danio rerio, Daphnia pulex, Dictyostelium discoideum, Drosophila melanogaster, Homo sapiens, Oryza sativa, Plasmodium falciparum, Schistosoma mansoni, Schizosaccharomyces pombe, Tetrahymena thermophile, Toxoplasma gondii, Trypanosoma brucei, Saccharomyces cerevisiae) by FASTA searches. We selected homologs with >70% similarity (identical or conservative replacements) and >30% identity for a span over 50 residues from the “top‐5 hit list” of FASTA. From the homolog list, we made a network of subfamilies that shows how many homologs are shared between two subfamilies. Figure 1 shows the network, in which two subfamilies (red square) are connected with shared homologs (orange circle). We then put these into a simplified network, in which each pair of subfamilies is directly connected with an edge of the shared number of homologs. Self loops were removed. Subfamilies were classified by MCL clustering (granularity parameter = 2.0, cut off of the number of shared homologs = 5.0) using Cytoscape (Supporting Information Fig. S2). We also extracted the “top‐3” subfamilies with higher numbers of shared members for each subfamily. Based on these results, we classified the 156 subfamilies into six groups—CTER, CPV, pairings, miscellaneous, low similarity, and isolated (Table 1).
Figure 1.
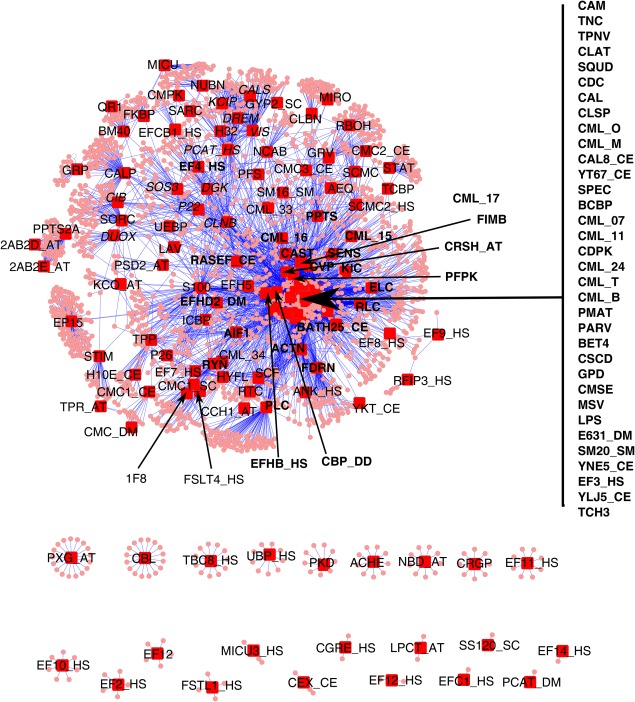
Relationship among subfamilies. We classified EF‐hand proteins into 156 subfamilies. The relationship among these subfamilies was analyzed by FASTA against proteome data from twenty species. We selected homologs with >70% similarity (identical or conservative replacements) and >30% identity for a span over 50 residues from the “top‐5 hit list” of FASTA. This made 32047 pairs of EF‐hand proteins in our database and the sequences of proteomes from 20 species. Each EF‐hand protein was already classified into 156 subfamilies. We made a table that shows the relationship between subfamily and the sequences taken up from proteome data from 20 species by replacing each entry of subfamilies to the name of the corresponding subfamily. After removing duplications caused by some entries of a subfamily matching to the same sequence, the table contains 6378 pairs between subfamilies and the sequences of proteomes from 20 species. The network was visualized by Cytoscape with spring layout option. The subfamilies are shown with red squares. The subfamily names given in Table I are also shown. Each sequence connecting subfamilies is shown with a small circle. The subfamily names in the CTER group are shown in bold face and the subfamily names in the CPV group are shown in italics. Other subfamily names are in normal face. Five subfamilies do not appear in this figure; four are from bacteria (CLSM, CMSO, CSCJ, and CBCC) and one is from Euglena (ARP_EG). The entries from these subfamilies have no similar (as defined above) sequences from the proteomes of the 20 species used. This figure shows how many sequences are shared by subfamilies; this is a measure of the relationship among subfamilies. There is one big cluster (top) and 22 isolated clusters (bottom). The subfamilies in the big cluster are connected to another subfamily by sharing at least one sequence with similarity to the entries of that subfamily. For example, the subfamilies in the CTER groups are clustered near the center of the figure. These subfamilies share many sequences each other; these subfamilies are densely connected in this figure. The subfamilies in the CPV group appear in the area from the top to the center of the big cluster. They are connected to each other by many sequences. Another example is EP15, which is at the middle of left side of the big cluster. EP15 has 13 sequences. There are many sequences similar to the entries of EP15 (many small circles around the red square of EF15). However, they are weakly shared with other subfamilies. The numbers of shared sequences between subfamilies are shown in Supporting Information Table S2 (see the column for the nearest subfamily, second nearest subfamily, and third nearest subfamily).
Table 1.
Classification and Description of Subfamilies of EF‐Hand Proteins
| Group | Subfamily | Entries | Plants | Fungi | Nematoda | Insects | Vertebrates | Notes | |
|---|---|---|---|---|---|---|---|---|---|
| CTER | |||||||||
| CTER‐core | CAM | 60 | yes | yes | yes | yes | yes | The members of five subfamilies in CTER‐core are congruent and they are inferred to diverge from a common four‐domain precursor. | |
| TNC | 13 | yes | |||||||
| ELC | 44 | yes | yes | yes | yes | ||||
| RLC | 40 | yes | yes | yes | |||||
| TPNV | 15 | yes | yes | ||||||
| CTER‐plus | CLAT | 3 | yes | The members of CTER‐plus show higher similarity to calmodulin and appear in cluster_1. These subfamilies share a common ancestor with four domains. | |||||
| SQUD | 1 | ||||||||
| CDC | 19 | yes | yes | yes | |||||
| CAL | 3 | yes | |||||||
| CLSP | 3 | yes | |||||||
| CML_O | 1 | yes | |||||||
| CML_M | 2 | yes | |||||||
| CAL8_CE | 1 | yes | |||||||
| YT67_CE | 1 | yes | |||||||
| SPEC | 5 | ||||||||
| BCBP | 12 | yes | |||||||
| CML_07 | 11 | yes | |||||||
| CML_11 | 4 | yes | |||||||
| CDPK | 50 | yes | |||||||
| CML_24 | 2 | yes | |||||||
| CML_T | 3 | yes | |||||||
| CML_B | 1 | yes | |||||||
| PMAT | 2 | yes | |||||||
| CML_17 | 3 | yes | |||||||
| CML_15 | 3 | yes | |||||||
| CTER‐related | |||||||||
| 1 | FIMB | 10 | yes | yes | yes | Fimbrin (FIMB) is an actin filament bundling protein; it has two EF‐hands at its N‐terminus. | |||
| 2 | PARV | 40 | yes | Parvalbumin (PARV) has three EF‐hands, the first of which does not bind calcium ions and covers the hydrophobic patch formed by an EF‐lobe with 2nd and 3rd EF‐hand. | |||||
| 3 | ACTN | 10 | yes | yes | yes | α‐Actinin (ACTN) is an actin filament cross linking protein; it has two EF‐hands at its C‐terminus. α‐Spectrin (FDRN) reinforces the cell membrane by cross linking ankyrin and protein 4.1. It has two EF‐hands at its C‐terminus. | |||
| FDRN | 7 | yes | yes | yes | |||||
| 4 | BET4 | 5 | yes | Polcalcin (BET4) is a calcium binding pollen allergen and has two EF‐hands. It was put in cluster_12. SCO5464 protein (CSCD) is a bacterial protein that has four EF‐hands. Probable GTP diphosphokinase CRSH (CRSH_AT) has calcium dependent ppGpp (guanosine 3′‐diphosphate 5′‐diphosphate) synthetase activity in vitro. It has two EF‐hands. Calcium binding allergen (CML_16) is a plant allergen as is BET4; however, it has four EF‐hands. | |||||
| CSCD | 1 | ||||||||
| CRSH_AT | 1 | yes | |||||||
| CML_16 | 3 | yes | |||||||
| 5 | GPD | 3 | yes | yes | Glycerol‐3‐phosphate dehydrogenase (GPD) is an FAD dependent enzyme located in the outer surface of the inner mitochondrial membrane. It has two EF‐hands at its C‐terminus. | ||||
| 6 | CMSE | 2 | Calerythrin (CMSE) is a bacterial calcium binding protein and has four EF‐hands. Calerythrin is a protein of Saccharopolyspora erythraea. CMSE has two members. Another one is the cabA gene product of Streptomyces ambofaciens. MSV097 putative calcium binding protein (MSV) is a viral protein with four EF‐hands. | ||||||
| MSV | 1 | ||||||||
| 7 | AIF1 | 4 | yes | Allograft inflammatory factor 1 (AIF1) is an actin‐binding protein that enhances membrane ruffling and activation of RAC, a subfamily of the Rho family of GTPases. It has two EF‐hands. Swiprosin‐1 (EFHD2_DM) is an actin binding protein. It has four EF‐hands. | |||||
| EFHD2_DM | 1 | yes | |||||||
| 8 | CBP_DD | 3 | Calfumirin and its related calcium binding proteins (CBP_DD) are calcium binding proteins from Dictyostelium discoideum. CBP_DD has four EF‐hands. | ||||||
| 9 | PLC | 16 | yes | yes | yes | yes | yes | Phospholipase C (PLC) has two EF‐hands at the B‐terminal side of its catalytic domain that hydrolyzes phosphatidylinositol‐4,5‐bisphosphate to inositol‐1,4,5‐triphophate and diacylglycerol. | |
| 10 | SENS | 1 | Calsensin (SENS) is a calcium binding protein from Haemopis marmorata (Green horse leech). It has two EF‐hands. Although we classified SENS as CTER related based on the sequence similarity, its structure is unique. The main chain trace of SENS is quite different from other EF‐hand proteins. The EF‐lobe of SENS looks like an inverted form of other EF‐lobes. | ||||||
| 11 | RYN | 5 | yes | yes | Ryanodine receptor (RYN) is a calcium channel that mediates the release of Ca2+ from the sarcoplasmic reticulum into the cytoplasm. It has two EF‐hands at its C‐terminus. | ||||
| 12 | RASEF_CE | 1 | yes | Ras and EF‐hand domain containing protein (RASEF_CE) has N‐terminal EF‐hand domains, a coiled‐coil motif, and a C‐terminal Rab domain. It has two EF‐hands. Calcium release activated calcium channel regulator (EF4_HS) plays a role in store operated entry of Ca2+ ions. It has two EF‐hands. | |||||
| EF4_HS | 2 | yes | |||||||
| 13 | CAST | 1 | yes | Calcium binding protein CAST (CAST) is from Solanum tuberosum (potato). It has four EF‐hands. | |||||
| 14 | PFPK | 1 | Plasmodium falciparum calcium dependent protein kinase (PFPK) has four EF‐hands at its C‐terminus. | ||||||
| 15 | PPTS | 4 | yes | yes | yes | Serine/threonine‐protein phosphatase (PPTS) has four EF‐hands at the C‐terminal side of the phosphatase domain. | |||
| 16 | CVP | 2 | Calcium vector protein (CVP) interacts with CAVPT, whose function remains unknown, in a calcium dependent manner. It has four EF‐hands. | ||||||
| 17 | LPS | 2 | Calcium binding protein LPS (LPS) is involved in larval development and metamorphosis in Lytechinus pictus (painted sea urchin). It has eight EF‐hands. | ||||||
| 18 | E631_DM | 1 | yes | Calcium binding protein E63–1 (E631_DM) is from Drosophila melanogaster (fruit fly). It has two EF‐hands. It was put in cluster_01. BTB and MATH domain containing protein (BATH25_CE) is from Caenorhabditis elegans. It has two EF‐hands. Sm20, a 20‐kilodalton calcium‐binding protein of Schistosoma mansoni (SM20_SM), is associated with the tegumental membrane and inferred to be modified with carbohydrates. It has four EF‐hands. YNE5_CE contains an uncharacterized calcium‐binding protein encoded at the ORF R08D7.5. It has two EF‐hands. EF3_HS contains EF‐hand calcium‐binding domain‐containing protein 3, which is a protein of about 440‐amino acid length. Two EF‐hands is located at the N‐terminal side. YLJ5_CE contains an uncharacterized calcium‐binding protein, which is encoded at the ORF C50C3.5. It has a coiled coil domain at the N‐terminal side and two EF‐hands. EFHB_HS contains EF‐hand domain‐containing family member B, which is a 833 amino acid proteins encoded by EFHB gene. Two EF‐hands are located at the C‐terminal side. KIC contains two proteins, calcium‐binding protein KIC and calcium‐binding protein PBP1. KIC interacts with kinesin motor protein KCBP in a calcium‐dependent manner and inhibits KCBP microtubule binding activity and microtubule‐stimulated ATPase activity. PBP1 is a potential calcium sensor. They have two EF‐hands. TCH3 contains two calcium binding proteins, one from Arabidospsis and the other from Branchiostoma. Both proteins have six EF‐hands. | |||||
| BATH25_CE | 1 | yes | |||||||
| SM20_SM | 1 | ||||||||
| YNE5_CE | 1 | yes | |||||||
| EF3_HS | 1 | yes | |||||||
| YLJ5_CE | 1 | yes | |||||||
| EFHB_HS | 1 | yes | |||||||
| KIC | 2 | yes | |||||||
| TCH3 | 2 | yes | |||||||
| CPV | |||||||||
| CPV‐core | CLNB | 10 | yes | yes | yes | CPV‐core includes calcineurin B (CLNB), p22 (P22) and visinin (VIS). They are congruent and share the same four domain ancestor, which is different from the ancestor of CTER. There are six other subfamilies in CPV group. SOS3 is a plant calcium sensor involved in the signaling pathway during growth and development and in response to abiotic stresses. CIB is a calcium binding protein that plays a role in the regulation of numerous cellular processes, such as cell differentiation, cell migration, thrombosis, angiogenesis and apoptosis. PCAT_HS has both acyltransferase and acetyltransferase activities. There are two or four EF‐hands at C‐terminal side. KCIP is a regulatory subunit of voltage‐gated rapidly inactivating A‐type potassium channels. CALS is a calcium‐binding protein that interacts with the presenilins and regulates the levels of a presenilin fragment. DREM is a calcium‐dependent transcriptional repressor that binds to the DRE element of genes. | |||
| SOS3 | 10 | yes | |||||||
| P22 | 4 | yes | yes | ||||||
| CIB | 4 | yes | |||||||
| PCAT_HS | 2 | yes | |||||||
| KCIP | 3 | yes | |||||||
| VIS | 31 | yes | yes | yes | yes | ||||
| CALS | 1 | yes | |||||||
| DREM | 1 | yes | |||||||
| CPV‐related | |||||||||
| 1 | DGK | 9 | yes | yes | yes | CPV‐related contains two subfamilies, DGK and DUOX. The members of both subfamilies are chimeric proteins. | |||
| 2 | DUOX | 4 | yes | yes | yes | ||||
| pairings | |||||||||
| PPTS2A | 2AB2E_AT | 1 | yes | PPTS2A contains regulatory subunit of serine/threonine protein phosphatase 2A from various species. This protein has four EF‐hands at the C‐terminal side. 2AB2E_AT contains 2AB2E_ARATH, which is a probable regulatory subunit of serine/threonine protein phosphatase 2A. This protein has two EF‐hands at the C‐terminal side. 2AB2D_AT contains 2AB2D_ARATH, which is also a probable regulatory subunit of serine/threonine protein phosphatase 2A. This protein has three EF‐hands at least. | |||||
| PPTS2A | 7 | yes | yes | ||||||
| 2AB2D_AT | 1 | yes | |||||||
| PEF | CALP | 29 | yes | yes | CALP contains catalytic subunits and regulatory subunits of calcium dependent cysteine protease, calpain. SORC contains sorcin, grancalsin and apoptosis‐linked gene 2 protein (ALG‐2). The members of these two subfamilies have five EF‐hands. They are called penta EF‐hand proteins (PEF). | ||||
| SORC | 13 | yes | yes | yes | yes | ||||
| S100 | HYFL | 8 | yes | S100 has two EF‐hands, N‐terminal one of which is a S100 specific structure with longer calcium binding loop and C‐terminal one of which is a canonical EF‐hand. There are 24 human S100 genes, 19 of which are located within chromosome 1q21. S100 forms homo‐ or hetero‐dimer. ICBP has similar structure to S100, but it is a monomeric protein. HYFL is a chimeric protein with S100 like domain at N‐terminal side and a large repeat domain at C‐terminal side. P26 is a frog protein with two S100 like domains. | |||||
| ICBP | 6 | yes | |||||||
| S100 | 49 | yes | |||||||
| P26 | 1 | yes | |||||||
| RTC | RTC | 3 | yes | yes | RTC has six EF‐hands and is inferred to be in the lumen of endoplasmic reticulum (ER) since it has an N‐terminal leader sequence and a C‐terminal ER retention sequence. SCF is a supercoiling factor, which generates negative supercoils in DNA in conjunction with eukaryotic topoisomerase II. SCF has six EF‐hands. | ||||
| SCF | 2 | yes | |||||||
| SCMC | SCMC | 2 | yes | SCMC is a calcium‐dependent mitochondrial solute carrier, which mediates the reversible, electroneutral exchange of Mg‐ATP or Mg‐ADP against phosphate ions, across the mitochondrial inner membrane. SCMS2_HS is also a calcium‐dependent mitochondrial solute carrier. SCMS2_HS appeared in a cluster different from SCMC. CMC1_CE, CMC2_CE, CMC3_CE and CMC_DM are probable calcium‐binding mitochondrial carrier by similarity. Each one appears in a different cluster. | |||||
| SCMC2_HS | 1 | yes | |||||||
| CMC1_CE | 1 | yes | |||||||
| CMC_DM | 1 | yes | |||||||
| CMC2_CE | 1 | yes | |||||||
| CMC3_CE | 1 | yes | |||||||
| BM40 | BM40QR1 | 93 | yes | yes yes | BM40 is an extracellular calcium binding protein and regulates cell growth through interactions with the extracellular matrix and cytokines. It has two EF‐hands, the calcium coordination of the first of which deviates from canonical EF‐hand. QR1 is a extracellular glycoprotein, C‐terminal side of which shows the similarity to BM40. | ||||
| Misc | |||||||||
| TPP | 6 | yes | This group contains 18 subfamiles, which share at least two members in each of the best three subfamilies of similarity. TPP is thyroid protein p24 or calcyphosine. It has four EF‐hands. NUBN is nucleobindin, which has two EF‐hands. The domain including EF‐hands showed to interact with necdin, a growth suppressor expressed predominantly in postmitotic neurons. GRV is groovin (identical to kakapo), which has two EF‐hands at the C‐terminal side of about 4000 amino‐acid long protein. We included dystrophin in this subfamily. Dystrophin is about 7000 amino‐acid long protein, which acts as an integrator of intermediate filaments, actin and microtubule cytoskeleton networks. It has two EF‐hands at the C‐terminal side. NCAB is a neuronal calcium‐binding protein, which has two EF‐hands at the N‐terminal side of about 300 amino‐acid long. YKT_CE is an uncharacterized calcium‐binding protein of C. elegans. This protein has two EF‐hands at the C‐terminal side. EFH5 is an EF‐hand protein from Trypanosoma and Leishmania. It has four EF‐hands. EFCB1_HS is an EF‐hand calcium‐binding domain‐containing protein 1 from Human. It has four EF‐hands. GYP2_SC is a GTPase‐activating protein of yeast. It has a TBC/rab GTPase‐activating protein (GAP) domain at the N‐terminal side and four EF‐hands at the C‐terminal side of about 950 residues long. PSD2_AT is a phosphatidylserine decarboxylase proenzyme from Arabidopsis. It has two EF‐hands at the N‐terminal side of about 600‐residue long. AEQ is a calcium‐dependent bioluminescence photoprotein. Calcium ions trigger the intramolecular oxidation of the chromophore, coelenterazine into coelenteramide and CO2 with the concomitant emission of light. It has four EF‐hands. ANK_HS is a Ankyrin repeat and EF‐hand domain‐containing protein of human. There are two EF‐hands between four Ankyrin repeat at the N‐terminal side and another four Ankyrin repeat at the C‐terminal side. EF8_HS is a EF‐hand calcium‐binding domain containing protein of human. It has two EF‐hands in 144‐residues long. EF7_HS is a EF‐hand calcium‐binding domain containing protein of human. It has four EF‐hands in 629 residues long. 1F8 is a flagellar calcium‐binding protein of Trypanosoma. It has four EF‐hands. CML_33 is a calcium‐binding protein of Arabidopsis. The 131‐residues long protein has four EF‐hands. CML_34 is calcium‐binding protein of Arabidopsis. The 155‐residues long protein has four EF‐hands. MIRO is a mitochondrial Rho GTPase. There are four EF‐hands between the N‐terminal and the C‐terminal nucleotide binding domains. EP15 is epidermal growth factor receptor substrate 15. There are six EF‐hands in the N‐terminus, which are mixed with EH domain, an interaction site for Asn‐Pro‐Phe (NPF) motifs of target proteins. | ||||||
| NUBN | 4 | yes | yes | ||||||
| GRV | 3 | yes | yes | ||||||
| NCAB | 3 | yes | |||||||
| YKT_CE | 1 | yes | |||||||
| EFH5 | 4 | ||||||||
| EFCB1_HS | 1 | yes | |||||||
| GYP2_SC | 1 | yes | |||||||
| PSD2_AT | 1 | yes | |||||||
| AEQ | 6 | ||||||||
| ANK_HS | 1 | yes | |||||||
| EF8_HS | 1 | yes | |||||||
| EF7_HS | 1 | yes | |||||||
| 1F8 | 2 | ||||||||
| CML_33 | 1 | yes | |||||||
| CML_34 | 1 | yes | |||||||
| MIRO | 5 | yes | yes | yes | yes | ||||
| EP15 | 13 | yes | yes | yes | |||||
| Low‐similarity | |||||||||
| PFS | 1 | There are 23 subfamiles in this group. PFS is a membrane‐associated calcium‐binding protein of Plasmodium. It has six EF‐hands. MICU is a regulator of mitochondrial calcium uniporter (MCU). It has four EF‐hands at the C‐rerminal side of about 500 residue long. UEBP is a URE3‐BP sequence specific DNA binding protein. It has five EF‐hands. TCBP is a calcium binding protein from Tetrahymena. It has four EF‐hands. CLBN is Calbindin, a vitamin D‐dependent calcium‐binding protein, which is a calcium buffer and inferred to activate a membrane Ca2+‐ATPase and a 3′,5′‐cyclic nucleotide phosphodiesterase. It has six EF‐hands. SM16_SM is a 16 kDa calcium‐binding protein, which is expressed in eggs of Schistosoma. It has four EF‐hands. H10E_CE is an uncharacterized protein of C. elegans. It has at least four EF‐hands. CMC1_SC is a truncated non‐functional calcium‐binding mitochondrial carrier SAL1–1, which has tree EF‐hands at the N‐terminal side. KCO_AT is a two pore potassium channel from Arabidopsis. It has two EF‐hands at The C‐terminla side. SARC is a Sarcoplasmic calcium‐binding protein. It has four EF‐hands. FSTL4_HS is a follistatin‐related protein 4 of Human. It has two EF‐hands in the N‐terminal side of about 800 residue long. RBOH is a calcium‐dependent NADPH oxidase that generates superoxide. It is inferred to have six transmembrane helices and has two EF‐hands at the N‐terminal cytoplasmic domain. STIM is a stromal interaction molecule, which acts as Ca2+ sensor in the endoplasmic reticulum with its EF‐hand domain. It has two EF‐hands at the N‐terminal domain in the endoplasmic reticulum. GRP is a cation‐ and diacylglycerol (DAG)‐regulated nucleotide exchange factor activating Ras through the exchange of bound GDP for GTP. It has two EF‐hands at the C‐terminal side. FKBP is a peptidyl‐prolyl cis‐trans isomerase, which is inhibited by FK506. It has two EF‐hands at the C‐terminal side. LAV is a plasmodial‐specific protein. It has four EF‐hands. CCH1_AT is a voltage gated inward‐rectifying Ca2+ channel (VDCC) across the vacuole membrane. It has two EF‐hands between the N‐terminal and the C‐terminal transmembrane domain with six helices. EF9_HS is EF‐hand calcium‐binding domain‐containing protein 9 from Human. It has four EF‐hands. STAT is a signal transducer and transcription activator that mediates cellular responses to interferons (IFNs), cytokine KITLG/SCF and other cytokines and other growth factors. It has two EF‐hand‐like structures at the middle of about 800 residue long. H32 is a hypersensitive reaction associated Ca2+‐binding protein from kidney bean. It has four EF‐hands. RFIP3_HS is Rab11 family‐interacting protein 3 of human. It has four EF‐hands at the middle of about 750 residue long. TPR_AT is an uncharacterized TPR repeat‐containing protein of Arabidopsis. It has two EF‐hands at the N‐terminus of about 800 residue long. CMPK is a calcium and calcium/calmodulin‐dependent serine/threonine‐protein kinase of trumpet lily. It has four EF‐hands at the C‐terminus of about 500 residue long. | |||||||
| MICU | 3 | yes | yes | yes | |||||
| UEBP | 1 | ||||||||
| TCBP | 2 | ||||||||
| CLBN | 11 | yes | yes | ||||||
| SM16_SM | 1 | ||||||||
| H10E_CE | 1 | yes | |||||||
| CMC1_SC | 1 | yes | |||||||
| KCO_AT | 3 | yes | |||||||
| SARC | 8 | ||||||||
| FSTL4_HS | 1 | yes | |||||||
| RBOH | 9 | yes | |||||||
| STIM | 4 | yes | yes | yes | |||||
| GRP | 2 | yes | |||||||
| FKBP | 5 | yes | |||||||
| LAV | 1 | ||||||||
| CCH1_AT | 1 | yes | |||||||
| EF9_HS | 1 | yes | |||||||
| STAT | 17 | yes | yes | ||||||
| H32 | 1 | yes | |||||||
| RFIP3_HS | 1 | yes | |||||||
| TPR_AT | 1 | yes | |||||||
| CMPK | 1 | yes | |||||||
| Isolated | |||||||||
| EF11_HS | 1 | yes |
This group contains 27 subfamilies. EF11_HS is EF‐hand calcium‐binding domain containing protein 11 of human. It has four EF‐hands. EF2_HS is EF‐hand domain‐containing family member C2 of human. It has four EF‐hands at the C‐terminal side of about 750 residue long. PCAT_DM is a lysophosphatidylcholine acyltransferase of fruit fly. It is a memebrane protein at endoplasmic reticulum. There are two EF‐hands at the C‐terminus of luminal domain. EFC1_HS is a EF‐hand and coiled‐coil domain containing protein 1 of human. It has two EF‐hands at the N‐terminus followed by two coiled‐coil domains. CLSM is Calsymin, a bacterial protein with six EF‐hands. CGRE_HS is a cell growth regulator with EF hand domain protein of human. It has two EF‐hands. CRGP is multiple coagulation factor deficiency protein 2 of human. It has two EF‐hands. LPCT_AT is a lysophospholipid acyltransferase from Arabidopsis. It shows acyl‐CoA‐dependent lysophospholipid acyltransferase activity and has two EF‐hands at the C‐terminal side. UBP_HS is a ubiquitin carboxyl‐terminal hydrolase of human. It has four EF‐hands at the N‐terminal side of 1600 residue long. ARP_EG is a calcium‐binding acidic‐repeat protein from Euglena. It has at least 15 EF‐hand‐like repeats. EF12_HS is a EF‐hand calcium‐binding domain containing protein of human. It has two EF‐hands in the middle of about 750 residue long. MICU3_HS is a calcium uptake protein from human mitochondria. It has four EF‐hands at the C‐terminal side. CEX_CE is calexcitin of C. elegans. It has three EF‐hands. SS120_SC is Protein SSP120 of yeast. It has two EF‐hands. CMSO is a calcium binding protein of Streptomyces. This bacterial protein has four EF‐hands. CSCJ is also a calcium binding protein of Streptomyces. This bacterial protein has four EF‐hands. EF10_HS is a EF‐hand calcium‐binding domain containing protein of human. It has two EF‐hands. CBCC is a bacterial EF hand protein from Caulobacter. It has two EF‐hands. CBL is a E3 ubiquitin‐protein ligase and functions as a negative regulator of many signaling pathways that are triggered by activation of cell surface receptors. It has a pair of EF‐hand‐like structure at the N‐terminal side of about 900 residue long. ACHE is a acetylcholinesterase. It has two EF‐hand‐like structures at the C‐terminal side of about 600 residue long. EF14_HS is a EF‐hand calcium‐binding domain‐containing protein of human. It has two EF‐hands at the C‐terminus of about 500 residue long. PKD is a polycystin of mouse, which functions as a calcium permeable cation channel involved in fluid‐flow mechanosensation by the primary cilium. It is a transmembrane protein and has two EF‐hands at the C‐terminal side of about 970 residue long. PXG_AT is a peroxygenase of Arabidopsis. It has four EF‐hands at the N‐terminal side. NBD_AT is a mitochondrial NADH‐ubiquinone oxidoreductase of Arabidopsis. It has two EF‐hands at the middle of about 600 residue long. EF12 is a calcium binding protein from nematode. It has 12 EF‐hands. FSTL1_HS is a follistatin‐related protein of human. It has two EF‐hands in the middle of the chain. TBC8_HS is a TBC1 domain family member of human, which is inferred to act as a GTPase‐activating protein for Rab family protein(s). It has two EF‐hands at the C‐terminal side of about 1100 residue long. |
||||||
| EF2_HS | 1 | yes | |||||||
| PCAT_DM | 1 | yes | |||||||
| EFC1_HS | 1 | yes | |||||||
| CLSM | 1 | ||||||||
| CGRE_HS | 1 | yes | |||||||
| CRGP | 1 | yes | |||||||
| LPCT_AT | 1 | yes | |||||||
| UBP_HS | 1 | yes | |||||||
| ARP_EG | 1 | ||||||||
| EF12_HS | 1 | yes | |||||||
| MICU3_HS | 1 | yes | |||||||
| CEX_CE | 2 | yes | |||||||
| SS120_SC | 1 | yes | |||||||
| CMSO | 2 | ||||||||
| CSCJ | 1 | ||||||||
| EF10_HS | 1 | yes | |||||||
| CBCC | 1 | ||||||||
| CBL | 5 | yes | yes | yes | |||||
| ACHE | 1 | yes | |||||||
| EF14_HS | 1 | yes | |||||||
| PKD | 3 | yes | |||||||
| PXG_AT | 3 | yes | |||||||
| NBD_AT | 3 | yes | |||||||
| EF12 | 3 | yes | |||||||
| FSTL1_HS | 1 | yes | |||||||
| TBC8_HS | 1 | yes |
The names of several subfamilies succeeded from our previous paper (Protein Profile Vol. 2 (4) 1995). The sequences in each subfamily are summarized in Supporting Information Table S1. Subfamilies were classified based on the similarity between the members of them (see Figure 1). “Entries” column shows the number of members in each subfamily. “Plants,” “Fungi,” “Nematoda,” “Insects,” and “Vertebrates” columns show the existence of members from each subfamily in these taxa. “Notes” describes the characteristics of each subfamily.
Descriptions of subfamily groups
CTER
The CTER group was originally described by Nakayama et al.12 We divided CTER into three subgroups: CTER‐core, CTER‐plus, and CTER‐related. The core of this group consists of CAM, TNC, ELC, and RLC (CTER‐core). They are congruent with each other.12 They are inferred to have diverged from a common four domain ancestor. We included TPNV in CTER‐core. Calmodulin (CAM) is an archetypical EF‐hand protein of CTER. CAM is a ubiquitous calcium receptor in (nearly) all eukaryotic cells.3 It passes the secondary messenger, calcium signal to downstream proteins by interacting with them.39 There are nearly 300 proteins listed in the database of calmodulin targets.40 CAM is a subunit of several enzymes and channels.41, 42 CAM interacts with its target via the target's IQ‐motif.42 CAM shows high structural flexibility in binding calcium and interacting with its target.39 Other members of CTER are troponin C (TNC), essential light chain (ELC), regulatory light chain (RLC) and troponin, non‐vertebrate (TPNV). TNC interacts with TNI and TNT to form the hetero‐trimer, troponin, which imparts calcium sensitivity to skeletal and cardiac muscle. TPNV is found in various non‐vertebrates; for example lobster and Drosophila; it has three isoforms. It is a close homolog of TNC; however, its mode of function remains unknown. It has been put into a subfamily separate from TNC. ELC and RLC both enfold the α‐helical portion of the myosin heavy chain. This interaction is mediated by the IQ‐motif.43
The members of CTER‐plus show higher similarity to calmodulin and appear in cluster_1. This group contains 20 subfamilies. These subfamilies share a common ancestor with four domains. These other members of CTER include calmodulin like protein in leaf (CLAT), squidulin (SQUD), CDC31, caltractin (CDC), cal1 protein (CAL), calcium dependent protein kinase (CDPK), Stronglyocentrotus calcium binding protein (SPEC), and membrane associated protein (PMAT). They were described in our previous papers.13, 16 Others are calmodulin like proteins from Arabidopsis (CML_O, CML_M, CML_07, CML_11, CML_24, CML_T, CML_B, CML_17, and CML_15), cal‐8 calmodulin like protein from C. elegans (CAL8_CE), un‐characterized calcium binding protein of C. elegans (YT67_CE), calmodulin like skin protein (CLSP) from mammals, and brain calcium binding protein (BCBP) from mammals. CAL8_CE and YT67_CE, each contains one EF‐hand protein of C. elegans (Q09980_CAEEL and YT67_CAEEL, respectively).
Arabidopsis has six calmodulin genes and fifty other calmodulin like (CML) genes.44 We classified these six calmodulin genes as CAM in CTER. Other calmodulin like genes are classified into eleven subfamilies in the CTER‐plus group. CLAT (CML8_ARATH, CML10_ARATH, and CML11_ARATH) and PMAT (CML35_ARATH and CML36_ARATH) have already been described. Others are classified based on the results of clustering. Nine subfamilies in CTER‐plus are CML_B, CML_M, CML_O, CML_T, CML_07, CML_11, CML_15, CML_17, and CML_24. Some CMLs were placed in CDC—(CML19_ARATH and CML20_ARATH), BET4 (CML28_ARATH), CML_16 (CML42_ARATH and CML43_ARATH), TCH3 (CML12_ARATH), which are in the CTER group. Other CMLs are put into SORC (CML48_ARATH, CML49_ARATH and CML50_ARATH), CML_33 (CML33_ARATH), and CML_34 (CML34_ARATH); these are not in the CTER group.
The subfamilies of CTER‐related, such as the chimeric proteins—FIMB, ACTN, FDRN, PLC, GPD, RYN, PPTS, and PFPK, are similar to calmodulin, but have different domain compositions. Other CTER related branches —for example, PARV, BET4, CSCD, CRSH_AT, CML_16, CMSE, MSV, AIF1, EFHD2_DM, CBP_DD, SENS, RASEF_CE, EF4_HS, CAST, CVP, LPS, E631_DM, BATH25_CE, SM20_SM, YNE5_CE, EF3_HS, YLJ5_CE, EFHB_HS, KIC, and TCH3—are more similar to other subfamilies of CTER. They were initially put into clusters other than cluster_1. CTER‐related was divided into 18 subgroups. Descriptions of these subgroups are shown in Table 1.
CPV
CPV consists of CPV‐core and CPV‐related. CPV‐core includes calcineurin B (CLNB), p22 (P22), and visinin (VIS). CLNB is the B subunit of calcineurin, a calcium dependent protein phosphatase. P22 is a calcium binding protein involved in different processes such as regulation of vesicular trafficking, plasma membrane Na+/H+ exchange, and gene transcription. P22 also inhibits NFAT nuclear translocation and transcriptional activity by suppressing the calcium dependent, calcineurin phosphatase activity. VIS is a calcium dependent regulator of guanylate cyclase. They are congruent and share the same four domain ancestor, which is different from the ancestor of CTER. The descriptions of six other subfamilies in the CPV group are shown in Table 1. CPV‐related contains two subfamilies, DUOX and DGK. The members of both subfamilies are chimeric proteins. DUOX has a peroxidase like domain at its N‐terminus, four EF‐hands at the middle, and both ferric oxido‐reductase and FAD‐binding FR‐type domains at its C‐terminus. DGK has two EF‐hands at the N‐terminal side of its diacylglycerol kinase catalytic domain. A NMR structure of the most N‐terminal domain, next to two EF‐hands, is in the PDB (1TUZ). This structure resembles a pair of EF‐hands; although, there is a long insertion in the loop region of the second EF‐hand like motif. DGK has four EF‐hands at its N‐terminus. The domain with four EF‐hands in CPV‐related also is inferred to share a common four domain ancestor.
Pairings
There are six groups of pairings, each of which contains subfamilies classified as nearest neighbor or subfamilies that are in the same cluster. The subfamilies in each group are all inferred to share common ancestors. These six groups are PPTS2A, PEF, S100, RTC, SCMC, and BM40. Each of these is described in Table 1.
Miscellaneous subfamilies
This group includes 18 subfamilies, each of which has at least two members shared with other subfamilies such as CTER or CPV based on similarity of amino acid sequence. Descriptions of these subfamilies are shown in Table 1.
Low similarity group
There are 23 subfamilies in this group. These subfamilies have little relation to other subfamilies. By definition, fewer than two members of another subfamily are linked to these 23 subfamilies. Descriptions of subfamilies are given in Table 1.
Isolated group
This group contains 27 subfamilies. The entries in the subfamilies in the isolated group show no significant similarity to the entries in other groups. Descriptions of these subfamilies are in Table 1.
Structures and functions of subfamilies
Figures 2, 3, 4, 5 show the representative structures of EF‐hand protein from various subfamilies. In these figures, an EF‐lobe was put in the coordinate system based on the pseudo‐two fold symmetry of the lobe.45, 46 The two fold axis was aligned to the z‐axis and then two EF‐hands were put on the x‐axis. This coordinate system uses the intrinsic symmetry axis. Each structure can be put in the coordinate system without reference to any other structures. The right panel shows the structures viewed down the z‐axis (x‐axis is horizontal, y‐axis is vertical) in the coordinate system. This view shows well the over‐all structure of EF‐lobes and their similarity. The left panel shows the conformational mapping of EF‐lobes.45, 47 The map was created from symmetry aligned structure. The conformation of the EF‐lobe was analyzed by the helix direction on yz‐plane of the coordinate system. The horizontal axis of the plot in left panel is the angle between the y‐axis and helix E of the EF‐lobe. The vertical axis is the angle on the yz‐plane between helix F from two EF‐hands in the EF‐lobe.47 This conformational map discriminates various structures of EF‐lobes. The positional difference in the map is easily interpretable in the real structure of the EF‐lobe.
Figure 2.
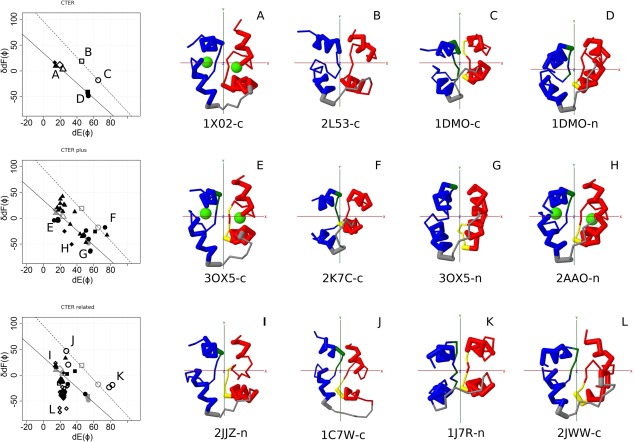
Structures of CTER, CTER‐plus, and CTER‐related. Left panel, Conformational map of EF‐lobe. The horizontal axis is the angle between y‐axis and helix E of the EF‐lobe. The vertical axis is the angle on the yz‐plane between helices F from two EF‐hands in the EF‐lobe. Two lines (solid and dotted lines) show the inferred conformational change of two separate types of EF‐lobe induced by the binding of Ca2+ ions. The EF‐lobe was put in the coordinate system based on the pseudo‐two fold symmetry of the lobe. The structures in this coordinate system, viewed down the z‐axis (x‐axis is horizontal, y‐axis is vertical) are shown. This view clearly shows the overall structure of EF‐lobes and their similarity to one another. Top, CTER. N‐lobe of calcium free calmodulin (filled circle), N‐lobe of calcium free calmodulin with target (filled square), N‐lobe of calcium bound calmodulin (filled triangle), N‐lobe of calcium bound calmodulin with target (filled diamond), C‐lobe of calcium free calmodulin (open circle), C‐lobe of calcium free calmodulin with target (open square), C‐lobe of calcium bound calmodulin (open triangle), C‐lobe of calcium bound calmodulin with target (open diamond). These positions are shown in the following plot using symbols in gray. Middle, CTER‐plus. Subfamily BCBP (filled circle), subfamily CDC (filled triangle), subfamily CDPK (filled diamond), subfamily CLSP (filled square). Bottom, CTER‐related. Subfamily ACTN (filled circle), subfamily AIF1 (filled triangle), subfamily BET4 (filled diamond), subfamily CMSE (filled square), subfamily CVP (open circle), subfamily KIC (open square), subfamily PARV (open diamond), subfamily PLC (open triangle). Right panel, Representative structures of each group. Each structure corresponds to the position shown in the conformational map (Left panel). A, C‐lobe of calcium bound calmodulin; B, C‐lobe of calcium free calmodulin with target; C, C‐lobe of calcium free calmodulin; D, N‐lobe of calcium free calmodulin; E, C‐lobe of calcium bound CaBP (BCBP); F, C‐lobe of magnesium bound CaBP (BCBP); G, N‐lobe of calcium free CaBP (BCBP); H, N‐lobe of calcium bound CDPK; I, N‐lobe of calcium free AIF1; J, C‐lobe of calcium bound CVP; K, N‐lobe of calcium free CVP; L, C‐lobe of calcium free parvalbumin (PARV). red, odd (N‐terminal) EF‐hand; blue, even (C‐terminal) EF‐hand; gray, linker connecting two EF‐hands; green sphere, Ca2+ ion.
Figure 3.
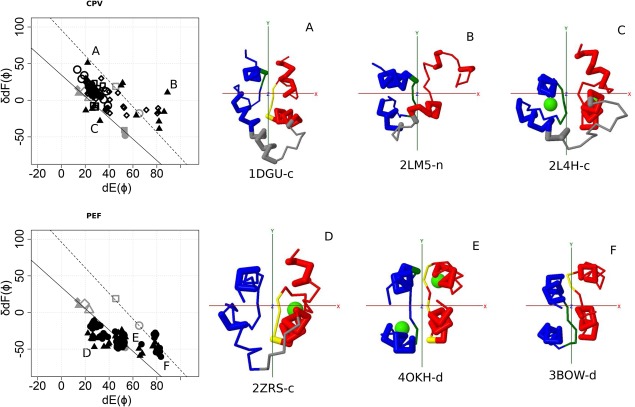
Structures of CPV and PEF. Left panel, Conformational map of EF‐lobe. Top, CPV. Subfamily CALS (filled circle), subfamily CIB (filled triangle), subfamily CLNB (filled diamond), subfamily KCIP (filled square), subfamily P22 (open circle), subfamily SOS3 (open square), subfamily VIS (open diamond). Bottom, PEF. Subfamily CALP (filled circle), subfamily SORC (filled triangle). The positions A, B, C, and D of CTER are shown in the following plot using symbols with gray. Right panel, Structures of each group. A, C‐lobe of calcium bound CIB; B, N‐lobe of calcium bound CIB; C, C‐lobe of calcium bound CIB; D, C‐lobe of calcium bound ALG‐2 (SORC); E, The pair of fifth domains of calcium bound calpain (CALP); F, The pair of fifth domains of calcium free calpain (CALP). red, odd (N‐terminal) EF‐hand; blue, even (C‐terminal) EF‐hand; gray, linker connecting two EF‐hands; green sphere, Ca2+ ion. For details, see the legend for Figure 2.
Figure 4.
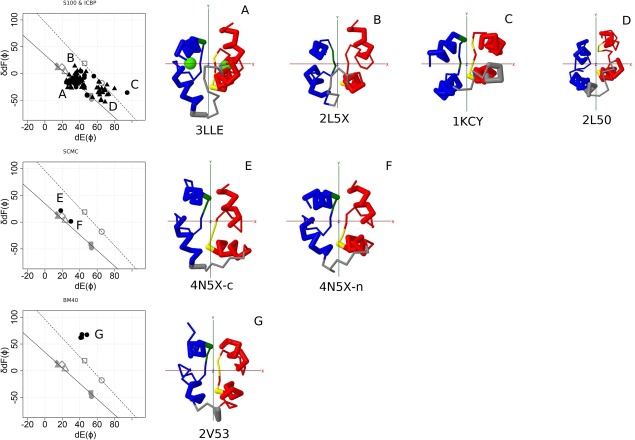
Structures of S100&ICBP, SCMC, and BM40. Left panel, Conformational maps of EF‐lobes. Top, S100&ICBP. Subfamily ICBP (filled circle), subfamily S100 (filled triangle). Middle, SCMC. Subfamily SCMC (filled circle). Bottom, BM40. Subfamily BM40 (filled circle). The positions A, B, C, and D of CTER are shown in the following plot using symbols with gray. Right panel, Structures of each group. A, Calcium bound S100B (S100); B, calcium bound S100A13 with target (S100); C, calcium free calbindin D9k (ICBP); D, calcium free S100A16 (S100); E, C‐lobe of calcium bound SCMC; N‐lobe of calcium bound SCMC; G, Calcium bound BM40. red, odd (N‐terminal) EF‐hand; blue, even (C‐terminal) EF‐hand; gray, linker connecting two EF‐hands; green sphere, calcium. For details, see the legend for Figure 2.
Figure 5.
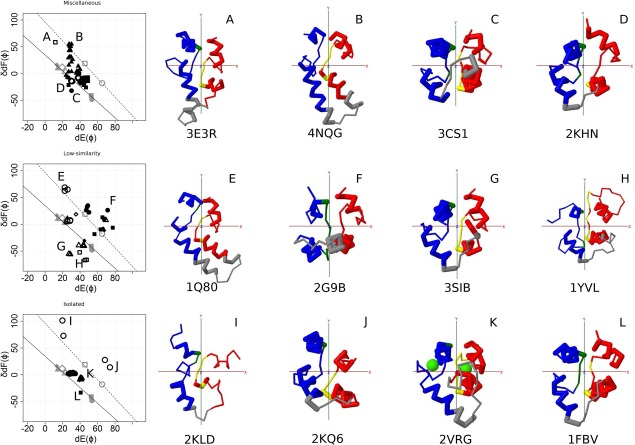
Structures of Miscellaneous, Low‐similarity, and Isolated. Left panel, Conformational maps of EF‐lobes. Top, Miscellaneous. Subfamily 1F8 (filled circle), subfamily AEQ (filled triangle), subfamily CML_33 (filled diamond), subfamily EP15 (filled square), subfamily MIRO (open circle), subfamily TPP (open square). Middle, Low‐similarity. Subfamily CLBN (filled circle), subfamily FKBP (filled triangle), subfamily LAV (filled diamond), subfamily MICU (filled square), subfamily SARC (open circle), subfamily STAT (open square), subfamily STIM (open diamond), subfamily UEBP (open triangle). Bottom, Isolated. Subfamily ACHE (filled circle), subfamily CBL (filled triangle), subfamily CMSO (filled diamond), subfamily CRGP (filled square), subfamily PKD (open circle). The positions A, B, C, and D of CTER are shown in the following plot using symbols with gray. Right panel, Structures of each group. A, Calcium bound calcyphosin (TPP); B, Mitrocomin (AEQ); C, Flagellar Calcium binding Protein (1F8); D, EH 1 domain from human intersectin‐1 (EP15) E, Sarcoplasmic calcium binding protein (SARC); F, calcium bound calbindin D28k (CLBN); G, URE3‐binding protein (UEBP); H, STAT1 (STAT); I, Polycystin‐2 (PKD); J, polycystin‐2 (PKD); K, MCFD2 (CRGP); L, c‐Cbl (CBL). red, odd (N‐terminal) EF‐hand; blue, even (C‐terminal) EF‐hand; gray, linker connecting two EF‐hands; green sphere, Ca2+ ion. For details, see the legend for Figure 2.
Four points (A, B, C, and D) shown in CTER plot (the top of Fig. 2 left panel) are reference points for calcium‐bound, target‐bound apo, and two conformers of apo structures of EF‐lobes. Two lines (solid and dotted lines) in Figure 2 show the inferred conformational change of EF‐lobe induced by the binding of calcium ions. N‐lobe of calmodulin shows simple change along lower solid line. C‐lobe of calmodulin should move along the upper dotted line. The transition from dotted line to solid line would occur in the C‐lobe of calmodulin for calcium binding. As discussed in the following section, many structures appear along the solid line.
CTER
The representative structures of an EF‐lobe of CTER are summarized in Figure 2 (top row). The EF‐lobes of CAM and of other CTER members have four different conformations. We made a plot to show the conformational status of EF‐lobes; these are shown as A, B, C, and D in the plot.47 The plots are shown at the left panel of the figures. Position A represents a calcium bound conformation for both N‐ and C‐lobes. Positions D and C are calcium free conformations for N‐lobes and C‐lobes, respectively. Position B is a semi‐open conformation of the C‐lobe, which binds a target but is in the calcium free conformation. The representative structures for these four positions are also shown in the figure (right panel).
The plots of conformations of CTER‐plus are shown at the middle of Figure 2. We show some representative structures. Positions E and F are calcium bound and calcium free structures of the C‐lobe from members of BCBP subfamily. Position G represents a calcium free structure of the N‐lobe of BCBP. These three positions are close to A, C, and D of CTER. Position H is a structure of calcium bound CDPK. This is some distance from the solid line, but the conformation is calcium bound.
The plots for CTER‐related are shown at the bottom of Figure 2. Almost all subfamilies, except PARV (open diamond), are on one of the two lines. PARV shows an open conformation in each EF‐hand; but its EF‐lobe appears to be slightly closed, since its two helices F come closer together (Fig. 2 right, L).
CPV
The plots for CPV are shown in Figure 3 (upper row). The lobes appear along the two lines. One outlier, at position B, is the N‐lobe of CIB. Most of the CIBs appear along the upper line (filled triangle). The structures of EF‐lobes of CPV are similar to those of CTER; although, the relative positions of the N‐lobe and the C‐lobe are completely different from that in CTER.
Pairings
There are several structures for groups of Pairings (PEF, S100, SCMC, and BM40). The Pairings group of PEF (CALP&SORC) is one of the oldest groups; it is widely distributed among eukaryotes, as are CTER and CPV. The distributions of S100&ICBP are limited in vertebrates. The plots for PEF are shown in Figure 3 (lower row). Most of PEF are near the lower line. However, the pairs of fifth domains of PEF are near the upper line. These pairs of fifth domains resemble a four helix bundle and show little change upon calcium binding. The plots of S100&ICBP are shown in Figure 4 (upper row). Almost all structures are near the two lines. Only one SCMC structure has been reported (Fig. 4, middle row). Both N‐ and C‐lobes bind Ca2+ ions; they appear near the position A of CTER. The structure of BM40 is far outside the two lines (Fig. 4, lower row). As shown in Table 1, QR1 shares only two members each from S100 and SM20_SM based on their similarities. BM40 shares no members with other subfamilies except QR1. They are unique EF‐hand proteins.
Miscellaneous subfamilies
There are six subfamilies of EF‐hand proteins for which structures have been reported. Almost all structures appear along the two lines (Fig. 5, upper row). The structures appearing at the marginal positions (A—D) are shown. They all resemble the canonical EF‐hand; although, some have longer helices.
Low similarity group
The plots for low similarity groups are shown in Figure 5 (middle row). There are eight subfamilies, for which the structures of EF‐hands are reported. Many plots deviate from the two reference lines. SARC [Fig. 6(E)] looks like AEQ [Fig. 5(B)]; although, the sequence similarity between them is low. They appear at similar positions in the plots (position E, Fig. 5 middle and position B, Fig. 5 upper). It is difficult to determine whether they have a common ancestor and diverged beyond significant sequence similarity or whether they arose independently, but structural constrains made their structures similar.
Figure 6.
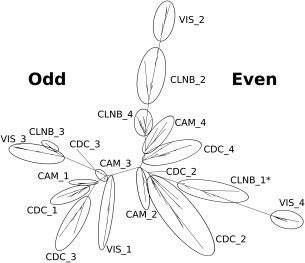
Domain tree of CTER and CPV. CTER is a group of subfamily containing CAM, TNC, ELC, RLC, and so on. CPV is another group of subfamily containing CLNB, P22, VIS, and so on. The groups of subfamilies are summarized in Table I. The sequences of EF‐hand domain from the members of CTER (CAM and CDC) and CPV (CLNB and VIS) were aligned. The evolutionary relationship was analyzed by using RAxML. The best tree obtained was shown. CTER and CPV have four EF‐hands, which are EF1, EF2, EF3, and EF4 from the N‐terminus. These four domains resulted from the duplication and fusion of an ancestral EF‐lobe, which had two EF‐hands (EF‐odd and EF‐even). By the duplication and fusion of this ancestral EF‐lobe, EF‐odd diverged to EF1 and EF3 and EF‐even to EF2 and EF4. The tree has two branches, one of which is the descendant of EF‐odd, the other of EF‐even. The ellipse shows the branch containing EF‐hands of each subfamily. For example, VIS_2 means that the ellipse contains EF2 of the VIS subfamily.
Isolated group
There are five subfamilies for which the structure of an EF‐hand is reported. The plots are shown in Figure 5 (lower). Although these subfamilies show little similarity to other EF‐hand subfamilies, many structures appear along the two lines. The positions I and J deviate a great deal; they occur in PKD. In this group, the symmetrical relationship between two EF‐hands is broken. Odd domains appear closed; Even domains look open.
Evolutionary congruence of domains
Relationship between CTER and CPV
EF‐hand motifs usually occur in pairs, forming an EF‐lobe. Several four domain EF‐hand proteins are inferred to have arisen by a duplication of an EF‐lobe. CTER and CPV are groups of typical, four domain EF‐hand proteins. However, the relative positions of EF‐lobes differ between CTER and CPV. They probably arose from different four domain ancestors. We analyzed the evolutionary relationship between CTER and CPV. Figure 6 shows the domain level analysis of this relationship. The best tree made by the maximum likelihood method using RAxML shows clear separation of odd and even domains; although, one branch of odd (the first domain of CLNB) appears in the even group. Also, each domain of CTER forms a cluster and that of CPV makes a different cluster. This means that CTER and CPV share a common EF‐lobe, which then diverged to the ancestors of CTER and of CPV. Figure 7 shows the tree made with EF‐lobe sequences by RAxML. Using this tree, we inferred the ancestral sequence of every node. Figure 8 shows the sequences of nodes for root, CTER_lobe, CPV_lobe, CTER_N, CTER_C, CPV_N, and CPV_C. The inferred root sequence and CTER_lobe sequence are identical. There are a few differences between the CTER_lobe and the CPV_lobe. The structural difference between CTER and CPV is the mutual position of N‐ and C‐lobes. There is little interaction between the N‐lobes and the C‐lobes of CTER; however, the interaction of the two lobes of CPV is much greater. The N‐ and C‐lobes of CPV usually lie side by side in a dimer like structure. There is a hydrophobic cluster at the interface between N‐ and C‐lobes (Fig. 9). As shown in Figure 9, this cluster is obvious in the ancestral structure of the CPV_N and CPV_C dimer. In the CTER_lobe and in the CTER_N&C lobe, the hydrophobic residues are replaced with hydrophilic amino acids. The only pair of hydrophobic residues consists of a Met of helix F in EF2 and an Ile of helix E in EF3. In the CPV_lobe, one residue is changed in the cluster and three residues make a hydrophobic cluster—Met and Ile of helix F in EF2 and Ile of helix E in EF3. This might make homo‐dimer formation possible with the CPV_lobe. However, the interaction is head to tail, so homo‐polymeric interactions become possible. We speculate that trimeric interaction, including the C‐tail helix, might prevent the formation of a polymer. We infer that the mutual position of N‐ and C‐lobes and also the C‐tail helix in CPV had been determined before the duplication and fusion of the CPV ancestor. The ancestral lobe of CTER, a well as CPV, might interact with the target helix before fusion of two EF‐lobes. This is why CTER, especially calmodulin, can accommodate such a variety of targets in several different conformations.
Figure 7.
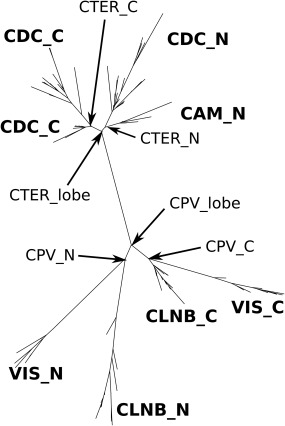
Tree for EF‐lobes of CTER and CPV. This tree shows the relationship among EF‐lobes from CTER and CPV analyzed by using RAxML. The sequences of EF‐lobes were made by concatenating EF1 and EF2 or EF3 and EF4. We omitted the linker between two EF‐hands in the EF‐lobe. The tree has two major branches for CTER and CPV. CTER_N, CTER_C, CPV_N, and CPV_C are the nodes for the precursor of each EF‐lobe corresponding to N‐terminal side lobes of CAM and CDC, C‐terminal side lobes of CAM and CDC, N‐terminal side lobes of CLNB and VIS or C‐terminal side lobes of CLNB and VIS. The CTER_lobe and the CPV_lobe are precursors of CTER_N and CTER_C, or of CPV_N and CPV_C, respectively. Based on this tree we inferred the ancestral sequences of each node by using PAML. (This figure is rotated 90 degree counter clock‐wise.).
Figure 8.
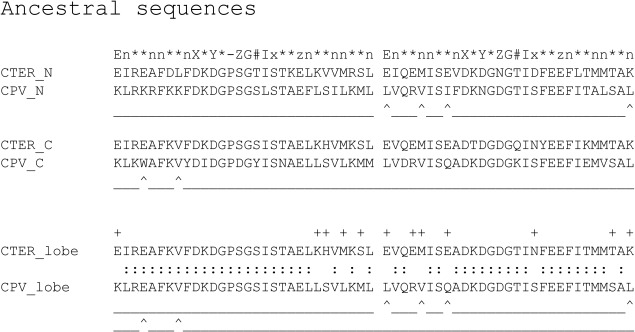
Inferred sequences for the nodes of the lobe tree. We inferred the sequences at every node shown in Figure7 by using PAML. The sequence of CTER_N, for example, is an ancestral sequence, from which every N‐lobe (N‐terminal side EF‐lobe) of CAM and CDC diverged. CTER_N and CTER_C diverged from an ancestral CTER_lobe, as well as CPV_N and CPV_C from an ancestral CPV_lobe. (+) indicates the difference between the CTER_lobe and the CPV_lobe. (^) indicates the position of hydrophobic residues observed at the interface between N‐lobe and C‐lobe of the calcineurin B subunit.
Figure 9.
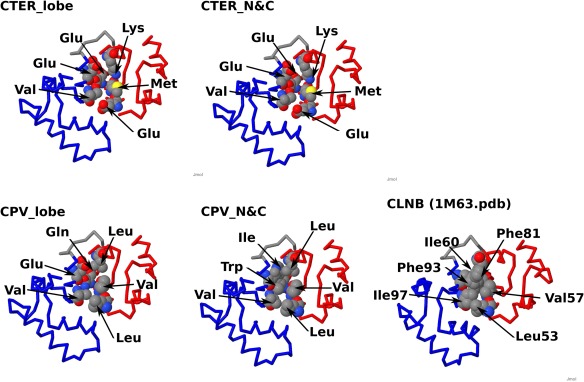
The interface between two lobes in CPV. Residues at the interface between two EF‐lobes are shown based on the structure of calcineurin B (1M63). The residues at the interface between N‐ and C‐lobes are show in the CPK model. Four residues (V57, L53, I60, and F81) are in the N‐lobe, two residues (F93 and I97) are in the C‐lobe in CLNB (right at bottom). Two lobes are connected with hydrophobic side chains. The interface of the model made from CPV_N and CPV_C (see Figure 8) is shown at the middle of bottom (CPV_N&C). The residues are hydrophobic. The CPV_lobe shows the model of a dimer made from the sequence of the CPV_lobe in Figure 8. Two hydrophobic residues are replaced with hydrophilic ones. However, Val and Leu of the N‐lobe and Val of the C‐lobe do make hydrophobic contacts. The right figure at top shows a model made from the CTER_lobe. There are many hydrophilic residues. Only a pair of Val and Met connect two lobes with hydrophobic interactions. The situation is the same for a model from CTER_N and CTER_C. red, N‐lobe; blue, C‐lobe; gray, linker connecting two EF‐hands.
Relationship between CTER and PEF
PEF is a group of penta‐EF‐hand proteins. Their fifth domains pair to form dimers. PEF proteins are widely distributed from fungi to mammals. The tree made from domain sequences shows Odd‐Even congruence with CTER and CPV, which means that CTER, CPV, and PEF share the same ancestral EF‐lobe (data not shown). The tree made from EF‐lobes is shown in Figure 10. Based on this tree, we inferred the node for each EF‐lobe (Fig. 11). The precursor sequences for EF‐lobes of PEF show conservative features of EF‐hand. Figure 12 shows the interface between EF‐lobes of PEF protein (small subunit of calpain, 1AJ5.pdb). There are hydrophobic clusters between the N‐lobe and the C‐lobe and between the C‐lobe and the dimer lobe. The residues in the cluster are conserved in the precursors of N‐ and C‐lobes. We infer that the interaction between the two lobes was probably established before fusion of the two lobes.
Figure 10.
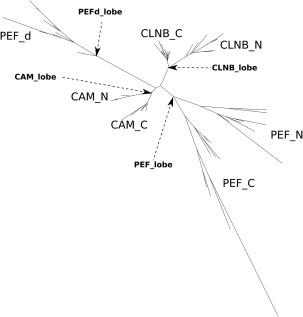
Tree for EF‐lobes of CAM, CLNB, and PEF (CALP and SORC). The tree was made from the alignment of N‐ and C‐lobes of CAM, CLNB, and PEF and the dimer lobe (a pair of fifth domains) of PEF. CAM_N, branch of CAM N‐lobes; CAM_C, branch of CAM C‐lobes; CAM_lobe, ancestor of CAM_N and CAM_C; CLNB_N, branch of CLNB N‐lobes; CLNB_C, branch of CLNB C‐lobes; CLNB_lobe, ancestor of CLNB_N and CLNB_C; PEF_N, branch of PEF N‐lobes; PEF_C, branch of PEF C‐lobes; PEF_d, branch of dimer lobes of PEF; PEF_lobe, ancestor of PEF_N and PEF_C; PEFd_lobe, ancestor of PEF_d. (This figure is rotated 90 degrees counter clock‐wise.).
Figure 11.
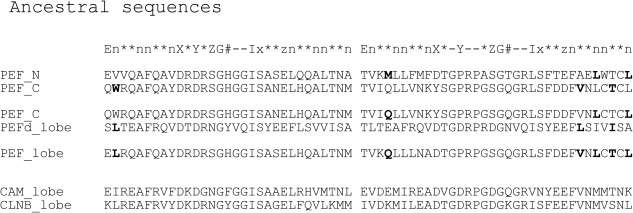
Inferred sequences at the nodes of tree for EF‐lobes of PEF, CAM, CLNB. The ancestral sequences (PEF_lobe, PEFd_lobe, PEF_N, PEF_C, CAM_lobe and CLNB_lobe) were inferred by PAML based on the tree shown in Figure 10. To show the residues at the interaction sites between two lobes, sequences of a pair of PEF_N and PEF_C lobes, and a pair of PEF_C and PEFd_lobes are shown. The residues in bold face are at the interaction sites between two lobes (see Figure 12).
Figure 12.
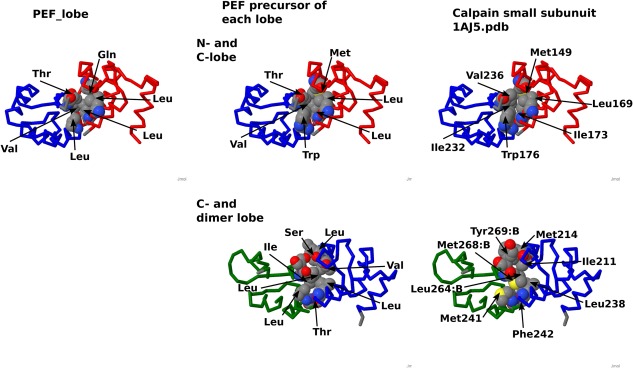
The interface between EF‐lobes of PEF. Homologous residues of inferred sequences of precursors are mapped on the structure of the small subunit of calpain (1AJ5.pdb). The interface residues between the EF‐lobes of calpain (1AJ5.pdb) are shown in the CPK model (right, top and bottom). Hydrophobic residues connect two lobes. Models made from node sequences of PEF_N and PEF_C and PEFd are shown at the middle (top, PEF_N and PEF_C; bottom, PEF_C and PEF_d). A model made from the PEF_lobe is shown at the top left. Hydrophobic pairs connect two lobes. red N‐lobe; blue, C‐lobe, green, dimer lobe, gray, linker connecting two EF‐hands.
Other subfamilies
PEF is in the pairings group. As shown above, PEF is related to CTER and CPV. S100 in pairings probably diverged from CTER in vertebrates. Other subfamilies of the pairing group are also inferred to have diverged from the same ancestor of CTER. Miscellaneous and low similarity groups show little similarity to other subfamilies, but the subfamilies in the isolated group do not show any clear relation to other subfamilies of EF‐hands.
There are several subfamilies, the structures of whose members have been reported, in isolated groups. They are ACHE, CBL, CMSO, CRGP, and PKD. We made trees using domain sequences for each subfamily using Uniref50 alignment. We postulate that the EF‐lobe of each subfamily arose from the duplication and fusion of a single EF‐hand motif. So, the root of this tree should be between odd and even nodes, since they are out groups for each other. Figure 13 shows the inferred sequences for the nodes of each domain, and also Odd and Even. ACHE and CBL do not seem to share the common ancestor of other EF‐hands. The origins of domain 1 and of domain 2 of these subfamilies might be different, since there is little conservation of sequence between them. CMSO, a bacterial EF‐hand protein, appears to contain a canonical EF‐hand. The inferred root sequence of CMSO diverged from the roots of CTER and CPV. This might due to the adaptive divergence of each EF‐hand domain in prokaryotes. Most bacterial EF‐hand proteins are believed to have arisen from horizontal gene transfer from eukaryotes. Recently, there have been several reports of calcium signaling in prokaryotes.24 The true origin of bacterial EF‐hand proteins remains unknown and should be analyzed carefully. CRGP and PKD also appear to be canonical EF‐hands. The inferred root sequences are similar to that of CMSO. This is due to the difference between domain 1 and domain 2. Either domain might have diverged, probably by adaptive selection.
Figure 13.
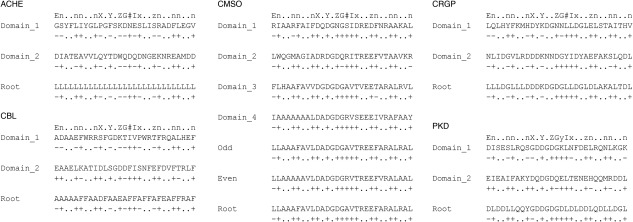
Precursor sequences of several subfamilies from isolated groups. In the isolated group, five subfamilies (ACHE, CBL, CMSO, CRGP, and PKD) contain at least one member whose structure has been determined. These structures are similar to the canonical EF‐hand (see Fig. 5, bottom). Based on the tree constructed with the alignment using Uniref50 for each subfamily, we inferred sequences of the precursor node for each EF‐hand domain. CMSO has four EF‐hand domains. Odd shows the precursor sequence of domains 1 and 3. Even shows the precursor sequence of domains 2 and 4. The EF‐hand mnemonic is shown at the top of each subfamily.
Conclusions
The EF‐hand is a helix‐loop‐helix calcium binding motif about thirty residues long. EF‐hands usually occur as a pair; this EF‐lobe is both a structural unit and a unit of evolution. We classified about 800 sequences of EF‐hands into six groups—CTER, CPV, PEF pairings, miscellaneous, low similarity, and isolated. We concluded that the majority of EF‐hands, including those in CTER and CPV groups and those in PEF pairing groups evolved from a single EF‐lobe. In these three groups, the relative positions of the EF‐lobes are completely different. We infer that the structure of the EF‐lobe had been established before two EF‐lobes fused. Initially, weak interaction between two EF‐lobes determined their mutual positions, and then the interaction got stronger by adaptive evolution and gene fusion of two lobes. Flexibility of the central helix of calmodulin probably reflects the lack of interaction between its two ancestral EF‐lobes. The relative positions of the two EF‐lobes of the proteins in CTER group, including calmodulin, might have been established in conjunction with the interactions of the target helix with the two EF‐lobes. This implies that the structures of these proteins reflect selection for their functions. The sites selected by adaptive evolution might be important for the prediction of the conformations of proteins.
Most of the EF‐hand proteins in our database probably descended from one ancestral EF‐lobe, a pair of EF‐hands. However, some subfamilies in isolated and low similarity groups are not congruent with the EF‐lobe precursor, even if their conformations are similar to the canonical EF‐hand. Even‐Odd congruency and ancestral sequence prediction are essential to discriminate between EF‐hand homologs and analogs (pretenders).
Supporting information
Supporting Information Figures.
Supporting Information Table 1.
Supporting Information Table 2.
Supporting Information.
References
- 1. Han J‐H, Batey S, Nickson AA, Teichmann SA, Clarke J (2007) The folding and evolution of multidomain proteins. Nat Rev Mol Cell Biol 8:319–330. [DOI] [PubMed] [Google Scholar]
- 2. Kawasaki H, Kretsinger RH (1994) Calcium‐binding proteins. 1: EF‐hands. Protein Profile 1:343–517. [PubMed] [Google Scholar]
- 3. Clapham DE (2007) Calcium signaling. Cell 131:1047–1058. [DOI] [PubMed] [Google Scholar]
- 4. Tufty RM, Kretsinger RH (1975) Troponin and parvalbumin calcium binding regions predicted in myosin light chain and T4 lysozyme. Science 187:167–169. [DOI] [PubMed] [Google Scholar]
- 5. Moews PC, Kretsinger RH (1975) Refinement of the structure of carp muscle calcium‐binding parvalbumin by model building and difference fourier analysis. J Mol Biol 91:201–225. [DOI] [PubMed] [Google Scholar]
- 6. Blanchard H, Grochulski P, Li Y, Arthur JSC, Davies PL, Elce JS, Cygler M (1997) Structure of a calpain Ca2+‐binding domain reveals a novel EF‐hand and Ca2+‐induced conformational changes. Nat Struct Mol Biol 4:532–538. [DOI] [PubMed] [Google Scholar]
- 7. Lin G, Chattopadhyay D, Maki M, Wang KKW, Carson M, Jin L, Yuen P, Takano E, Hatanaka M, DeLucas LJ, Narayana SVL (1997) Crystal structure of calcium bound domain VI of calpain at 1.9 Å resolution and its role in enzyme assembly, regulation, and inhibitor binding. Nat Struct Mol Biol 4:539–547. [DOI] [PubMed] [Google Scholar]
- 8. Wójcik J, Góral J, Pawłowski K, Bierzyński A (1997) Isolated calcium‐binding loops of EF‐hand proteins can dimerize to form a native‐like structure. Biochemistry 36:680–687. [DOI] [PubMed] [Google Scholar]
- 9. Shaw GS, Hodges RS, Sykes BD (1990) Calcium‐induced peptide association to form an intact protein domain: 1H NMR structural evidence. Science 249:280–283. [DOI] [PubMed] [Google Scholar]
- 10. Apic G, Gough J, Teichmann SA (2001) Domain combinations in archaeal, eubacterial and eukaryotic proteomes1. J Mol Biol 310:311–325. [DOI] [PubMed] [Google Scholar]
- 11. Moncrief ND, Kretsinger RH, Goodman M (1990) Evolution of EF‐hand calcium‐modulated proteins. I. Relationships based on amino acid sequences. J Mol Evol 30:522–562. [DOI] [PubMed] [Google Scholar]
- 12. Nakayama S, Moncrief ND, Kretsinger RH (1992) Evolution of EF‐hand calcium‐modulated proteins. II. Domains of several subfamilies have diverse evolutionary histories. J Mol Evol 34:416–448. [DOI] [PubMed] [Google Scholar]
- 13. Nakayama S, Kawasaki H, Kretsinger R, Evolution of EF‐hand proteins In: Carafoli PDE, Krebs P‐DDJ, Eds. (2000) Calcium homeostasis. Topics in biological inorganic chemistry. Berlin/Heidelberg: Springer, pp. 29–58. [Google Scholar]
- 14. Kretsinger RH, Nockolds CE (1973) Carp muscle calcium‐binding protein II. Structure determination and general description. J Biol Chem 248:3313–3326. [PubMed] [Google Scholar]
- 15. Sigrist CJA, Castro E. d, Cerutti L, Cuche BA, Hulo N, Bridge A, Bougueleret L, Xenarios I (2013) New and continuing developments at PROSITE. Nucleic Acids Res 41:D344–D347. [DOI] [PMC free article] [PubMed] [Google Scholar]
- 16. Kawasaki H, Nakayama S, Kretsinger RH (1998) Classification and evolution of EF‐hand proteins. Biometals 11:277–295. [DOI] [PubMed] [Google Scholar]
- 17. Grabarek Z (2011) Insights into modulation of calcium signaling by magnesium in calmodulin, troponin C and related EF‐hand proteins. Biochim Biophys Acta 1813:913–921. [DOI] [PMC free article] [PubMed] [Google Scholar]
- 18. Marshall CB, Nishikawa T, Osawa M, Stathopulos PB, Ikura M (2015) Calmodulin and STIM proteins: two major calcium sensors in the cytoplasm and endoplasmic reticulum. Biochem Biophys Res Commun 460:5–21. [DOI] [PubMed] [Google Scholar]
- 19. Li MX, Hwang PM (2015) Structure and function of cardiac troponin C (TNNC1): implications for heart failure, cardiomyopathies, and troponin modulating drugs. Gene 571:153–166. [DOI] [PMC free article] [PubMed] [Google Scholar]
- 20. Sheikh F, Lyon RC, Chen J (2015) Functions of myosin light chain‐2 (MYL2) in cardiac muscle and disease. Gene 569:14–20. [DOI] [PMC free article] [PubMed] [Google Scholar]
- 21. Dantas TJ, Daly OM, Morrison CG (2012) Such small hands: the roles of centrins/caltractins in the centriole and in genome maintenance. Cell Mol Life Sci 69:2979–2997. [DOI] [PMC free article] [PubMed] [Google Scholar]
- 22. Zhang Y, He CY (2012) Centrins in unicellular organisms: functional diversity and specialization. Protoplasma 249:459–467. [DOI] [PubMed] [Google Scholar]
- 23. Gao X, Cox KL, Jr , He P (2014) Functions of calcium‐dependent protein kinases in plant innate immunity. Plants 3:160–176. [DOI] [PMC free article] [PubMed] [Google Scholar]
- 24. Domínguez DC, Guragain M, Patrauchan M (2015) Calcium binding proteins and calcium signaling in prokaryotes. Cell Calcium 57:151–165. [DOI] [PubMed] [Google Scholar]
- 25. Kolobynina KG, Solovyova VV, Levay K, Rizvanov AA, Slepak VZ (2016) Emerging roles of the single EF‐hand Ca2+ sensor tescalcin in the regulation of gene expression, cell growth and differentiation. J Cell Sci 129:3533–3540. [DOI] [PMC free article] [PubMed] [Google Scholar]
- 26. Sole FD, Vadnagara K, Moe OW, Babich V (2012) Calcineurin homologous protein: a multifunctional Ca2+‐binding protein family. Am J Physiol Ren Physiol 303:F165–F179. [DOI] [PMC free article] [PubMed] [Google Scholar]
- 27. Lim S, Dizhoor A, Ames J (2014) Structural diversity of neuronal calcium sensor proteins and insights for activation of retinal guanylyl cyclase by GCAP1. Front Mol Neurosci 7:19. [DOI] [PMC free article] [PubMed] [Google Scholar]
- 28. Campbell RL, Davies PL (2012) Structure–function relationships in calpains. Biochem J 447:335–351. [DOI] [PubMed] [Google Scholar]
- 29. Maki M, Takahara T, Shibata H (2016) Multifaceted roles of ALG‐2 in Ca2+‐regulated membrane trafficking. Int J Mol Sci 17:1401. [DOI] [PMC free article] [PubMed] [Google Scholar]
- 30. Colotti G, Poser E, Fiorillo A, Genovese I, Chiarini V, Ilari A (2014) Sorcin, a calcium binding protein involved in the multidrug resistance mechanisms in cancer cells. Molecules 19:13976–13989. [DOI] [PMC free article] [PubMed] [Google Scholar]
- 31. Leclerc E, Heizmann CW (2011) The importance of Ca2+/Zn2+ signaling S100 proteins and RAGE in translational medicine. Front Biosci Sch Ed 3:1232–1262. [DOI] [PubMed] [Google Scholar]
- 32. Kizawa K, Takahara H, Unno M, Heizmann CW (2011) S100 and S100 fused‐type protein families in epidermal maturation with special focus on S100A3 in mammalian hair cuticles. Biochimie 93:2038–2047. [DOI] [PubMed] [Google Scholar]
- 33. Bradshaw AD (2012) Diverse biological functions of the SPARC family of proteins. Int J Biochem Cell Biol 44:480–488. [DOI] [PMC free article] [PubMed] [Google Scholar]
- 34. García‐Galiano D, Navarro VM, Gaytan F, Tena‐Sempere M (2010) Expanding roles of NUCB2/nesfatin‐1 in neuroendocrine regulation. J Mol Endocrinol 45:281–290. [DOI] [PubMed] [Google Scholar]
- 35. Hajnóczky G, Booth D, Csordás G, Debattisti V, Golenár T, Naghdi S, Niknejad N, Paillard M, Seifert EL, Weaver D (2014) Reliance of ER–mitochondrial calcium signaling on mitochondrial EF‐hand Ca2+ binding proteins: MIROS, MICUs, LETM1 and solute carriers. Curr Opin Cell Biol 29:133–141. [DOI] [PMC free article] [PubMed] [Google Scholar]
- 36. del Arco A, Contreras L, Pardo B, Satrustegui J (2016) Calcium regulation of mitochondrial carriers. Biochim Biophys Acta 1863:2413–2421. [DOI] [PubMed] [Google Scholar]
- 37. Schwaller B (2014) Calretinin: from a “simple” Ca2+ buffer to a multifunctional protein implicated in many biological processes. Front Neuroanat 8:3. [DOI] [PMC free article] [PubMed] [Google Scholar]
- 38. Tang BL (2015) MIRO GTPases in mitochondrial transport, homeostasis and pathology. Cells 5:1. [DOI] [PMC free article] [PubMed] [Google Scholar]
- 39. Hoeflich KP, Ikura M (2002) Calmodulin in action: diversity in target recognition and activation mechanisms. Cell 108:739–742. [DOI] [PubMed] [Google Scholar]
- 40. Yap KL, Kim J, Truong K, Sherman M, Yuan T, Ikura M (2000) Calmodulin target database. J Struct Funct Genomics 1:8–14. [DOI] [PubMed] [Google Scholar]
- 41. Saimi Y, Kung C (2002) Calmodulin as an ion channel subunit. Annu Rev Physiol 64:289–311. [DOI] [PubMed] [Google Scholar]
- 42. Jurado LA, Chockalingam PS, Jarrett HW (1999) Apocalmodulin. Physiol Rev 79:661–682. [DOI] [PubMed] [Google Scholar]
- 43. Houdusse A, Cohen C (1996) Structure of the regulatory domain of scallop myosin at 2 A resolution: implications for regulation. Structure 4:21–32. [DOI] [PubMed] [Google Scholar]
- 44. McCormack E, Braam J (2003) Calmodulins and related potential calcium sensors of Arabidopsis. New Phytol 159:585–598. [DOI] [PubMed] [Google Scholar]
- 45. Kawasaki H, Kretsinger RH (2014) Structural differences among subfamilies of EF‐hand proteins — A view from the pseudo two‐fold symmetry axis. Proteins 82:2915–2924. [DOI] [PubMed] [Google Scholar]
- 46. Kawasaki H, Kretsinger RH (2012) Analysis of the movements of helices in EF‐hands. Proteins 80:2592–2600. [DOI] [PubMed] [Google Scholar]
- 47. Kawasaki H, Kretsinger RH (2015) HVM: a web‐based tool for alignment of EF‐hand lobes relative to their local pseudo two‐fold axes. Protein Pept Lett 22:264–269. [DOI] [PubMed] [Google Scholar]
Associated Data
This section collects any data citations, data availability statements, or supplementary materials included in this article.
Supplementary Materials
Supporting Information Figures.
Supporting Information Table 1.
Supporting Information Table 2.
Supporting Information.


