. 2017 Sep 5;6:e30697. doi: 10.7554/eLife.30697

Figure 4. Silencing the hypothalamic-habenular projection impairs escape behaviors.

(A) Timeline for Cre-dependent DREADDi strategy. Image for DREADDi expression (red) in LH somata and LH terminals in LHb. (B) Sample histograms for Fs-evoked latency to escape (30 trials) in a CTRL and DREADDi-expressing mouse. Bottom. Bar graphs and scatter plots for failure rates and latencies to escape (CTRL vs DREADDi, N = 17, 17; unpaired t-test; failures: t = 2.97, **p=0.005; latency: t = 2.79, **p=0.008). (C) Looming light test. Sample speed across time during the looming test in CTRLs and DREADDi-expressing animals. Bottom. Latency to escape (CTRL vs DREADDi, N = 12, 15; unpaired t-test; t = 4.12, ***p=0.0004) and strategy adopted upon the looming stimulus (Chi-square test, X2 = 1.29, p=0.25) in the two experimental groups. Results are reported as mean ±S.E.M. N = mice. MHb, medial habenula, EPN, entopeduncular nucleus, VmH, ventral medial hypothalamus. See Figure 4—source data 1.

Figure 4—source data 1.
DOI: 10.7554/eLife.30697.022

Figure 4.

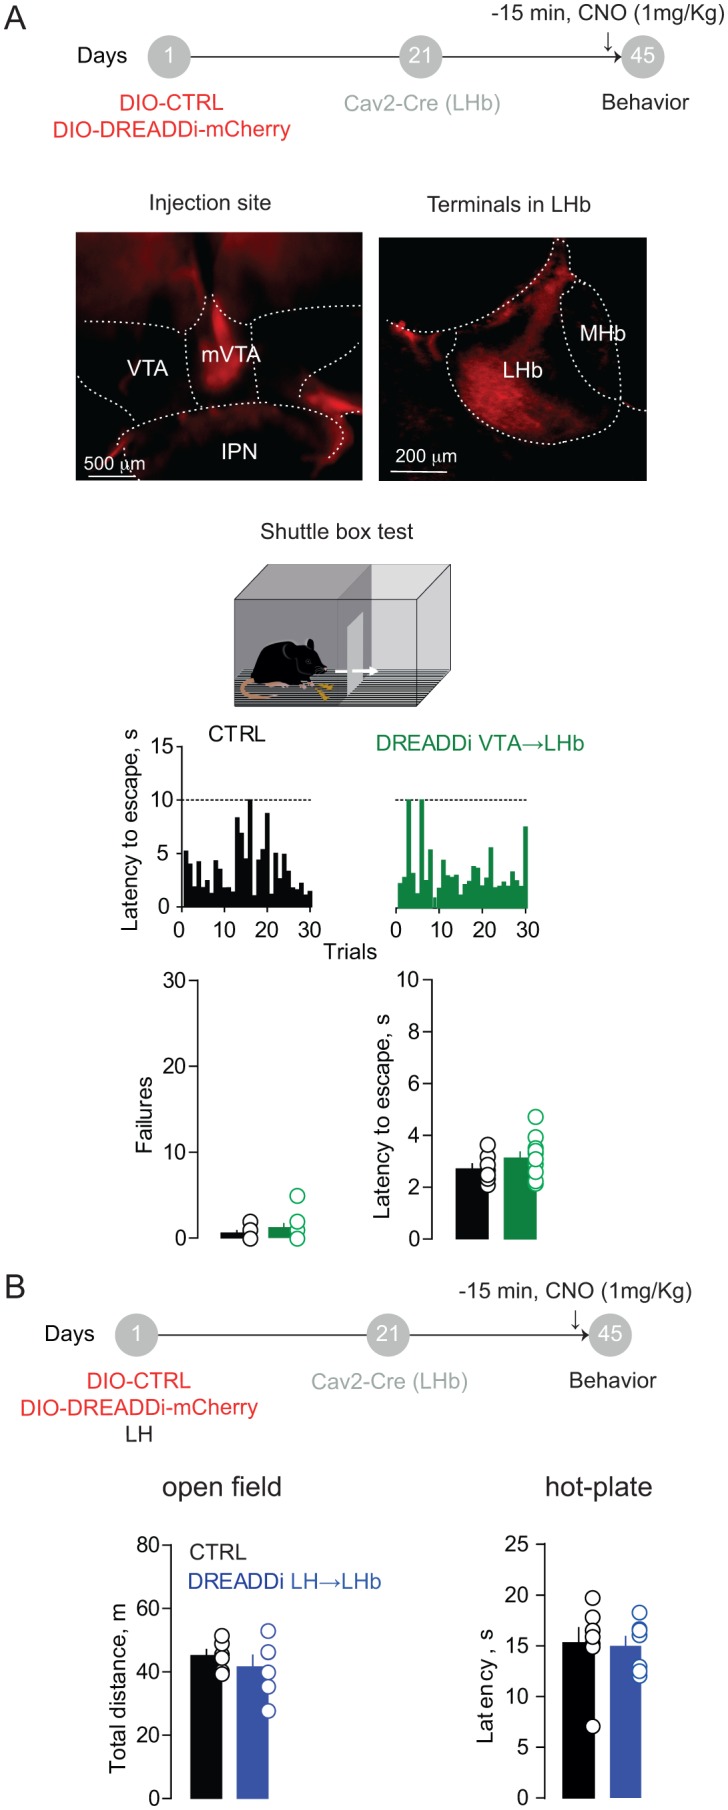
Figure 4—figure supplement 1. Behavioral assessment of DREADDi activation on VTA→LHb and LH→LHb projections.

Figure 4—figure supplement 1.

(A) Timeline for Cre-dependent DREADDi strategy within the VTA. Representative image for DREADDi expression (red) in mVTA somata and terminals in LHb. Sample histograms for Fs-evoked latency to escape over 30 trials in a CTRL and DREADDi-expressing mouse. Bottom. Bar graphs and scatter plots for failure rates and latencies to escape (CTRL vs DREADDi, N = 7 vs 10; unpaired t-test; Failures: t = 1.17, p=0.25; Latency: t = 1.26, p=0.22). (B) Timeline for Cre-dependent DREADDi expression in LH→LHb. Bar graphs and scatter plots for data collected in the open field (CTRL vs DREADDi; N = 6 vs 6; unpaired t-test, t = 0.85; p=0.41) and in the hot-plate test (N = 7 vs 7; unpaired t-test, t = 0.16; p=0.87). N = mice. MHb, medial habenula, VTA, ventral tegmental area, IPN, interpeducular nucleus. See also Figure 4. See Figure 4—figure supplement 1—source data 1.
Figure 4—supplement figure 1—source data 1.
elife-30697-fig7.xlsx (40.6KB, xlsx)
DOI: 10.7554/eLife.30697.023