Abstract
This study evaluates the capabilities of a whole-body photon counting CT system to differentiate between four common kidney stone materials, namely uric acid (UA), calcium oxalate monohydrate (COM), cystine (CYS),and apatite (APA) ex vivo. Two different x-ray spectra (120 kV and 140 kV) were applied and two acquisition modes were investigated; The macro-mode generates two energy threshold based image-volumes and two energy bin based image-volumes. In the chesspattern-mode, however, four energy thresholds are applied. A virtual low energy image, as well as a virtual high energy image are derived from initial threshold-based images, while considering their statistically correlated nature. The energy bin based images of the macro-mode, as well as the virtual low and high energy image of the chesspattern-mode serve as input for our dual energy evaluation. The dual energy ratio of the individually segmented kidney stones were utilized to quantify the discriminability of the different materials. The dual energy ratios of the two acquisition modes showed high correlation for both applied spectra. Wilcoxon-rank sum tests and the evaluation of the area under the receiver operating characteristics curves suggest that the UA kidney stones are best differentiable from all other materials (AUC = 1.0), followed by CYS (AUC ≈ 0.9 compared against COM and APA). COM and APA, however, are hardly distinguishable (AUC between 0.63 and 0.76). The results hold true for the measurements of both spectra and both acquisition modes.
Keywords: CT, Dual-Energy CT, Multi-Energy CT, Spectral CT, Photon-Counting CT, Kidney Stone
INTRODUCTION
The therapeutic treatment of kidney stones strongly depends on their material composition. Several energy selective imaging techniques in Computed Tomography (CT) help to investigate the material characteristics and morphological information of kidney stones. Previous studies elaborate on utilizing kV-switching approaches,1, 2 Dual Source CT,3–7 or Dual Layer CT,8 in order to characterize common types of kidney stones.
Motivated by recent reports assessing the dual energy capabilities of photon counting detector CT (PDC-CT) systems,9–12 this phantom study investigates the differentiability of four different pure kidney stone materials using image information obtained by a research PCD-CT system. The differentiation performance was evaluated comparing the dual energy ratios (DER) of the pure kidney stone materials with respect to two different acquisition modes (macro-mode and chesspattern-mode) and two applied x-ray spectra (120 kV and 140 kV).
METHODS AND MATERIALS
Scanner Configuration
For this study a research whole-body PCD-CT scanner (Somatom CounT, Siemens Healthcare, Forchheim/Germany) was used.13–15 The dual source system contains both an energy integrating detector and a PCD. This study focuses on acquisitions of the PCD. The CdTe-based PCD comprises 32 detector rows. Each row contains 480 pixels with an individual pitch of 1.125 mm. A pixel is subdivided into 4 × 4 so called sub-pixels. Each sub-pixel features two hardware based energy thresholds that allow the generation of signals based on photon energies that just exceed the thresholds as they are set by the user. By considering only photon energies that are found within an energy window (which is determined by two neighboring energy thresholds16), so called bin images are generated. The readout occurs either in the macro-mode (MM) or the chesspattern-mode (CM). In the MM every single sub-pixel is configured having the same two energy thresholds(TL and TH), resulting in the acquisition of two threshold based images and two energy bin based images (upper limit of highest bin is determined by the maximal energy exposed by the x-ray tube). The energy bin based images inherently provide almost independent photon statistics. In the CM four thresholds are applied (TL1,TH1, TL2, and TH2). However, in this mode only every second sub-pixel features the same low and high energy thresholds. The acquisitions in CM result in four threshold based images and four bin based images. Since the bin based images rely on photons that are measured in two neighboring sub-pixels, there is a non-intuitive statistical correlation among these images.17
Phantom Preparation
In order to assess the quality of kidney stone material separation using the presented PCD-CT scanner, 40 kidney stones were investigated. The full set of kidney stones consists of four subsets, each consisting of 10 real kidney stones with pure chemical composition. The investigated materials were uric acid (UA, 71.5 – 273.9 mm3), calcium oxalate monohydrate (COM, 21.4 – 204.2 mm3), cystine (CYS, 64.3 – 287.1 mm3), and apatite (APA, 18.0 – 202.73 mm3). The purity of the materials was earlier determined by infrared spectroscopy. Each subset of stones was arranged in an array of small cups that were half way filled with gelatine. After the stones were separately located in the middle of the gelatines surfaces, the rest of the cups was filled with gelatine. The arrays were placed in a 20cm wide cylindrical water phantom (positioned at the top of the table) in order to provide a reasonable attenuation of the x-ray spectrum. The arrays were aligned in x/y plane.
Image Acquisition and Reconstruction
Each array of kidney stones was measured using a tube voltage of 120 kV and 140 kV, both in MM and CM. For the MM acquisition the energy thresholds were set to 25 and 75 keV. For the acquisitions using the CM, however, energy thresholds of 25, 75, 25, 75 keV were applied in order to control the aforementioned correlations typical for CM. All acquisitions were made following an abdominal sequence protocol with a rotation time of 1.0 s and an effective tube current time product of 102 mAs. The collimation was set to 32 × 0.5 mm. The images were reconstructed in a field of view (FOV) of 110 mm, using a weighted backprojection algorithm with a quantitative medium smooth kernel (D30)18 resulting in comparatively lower noise levels and coarser structure. Since the diameter of the water container did not exceed the FOV of the system (275 mm), the reconstructions did not require further data completion and were free of truncation artifacts.19
Evaluation
In order to discriminate the kidney stone materials out of the acquired CT images, the DER for each kidney stone was calculated. The DER is derived by dividing the mean CT-values of a kidney stone in a CT-image acquired using a lower energy spectrum, and the same stone in a respective higher energy spectrum. In case of the MM acquisition these low and high energy images correspond to the two energy bin based images. Since the CM provides up to eight distinct images, we perform a statistical decorrelation that utilizes the four threshold-based images to generate two images that mime a virtual low energy image and a virtual high energy image, without shedding spectral information. In order to obtain the CT-value statistics of each stone and each image, the stones were segmented and measured individually. The measured DERs per stone material and spectrum were compared against the values of the other stones. Statistical tools used to assess the quality of distinction were a Wilcoxon rank-sum test to test for equal DER medians, and an analysis of the receiver operating characteristic (ROC) and its area under the curve (AUC). The AUC quantifies the differentiability of the measured stones as a case of binary classification. Whilst AUC values around 0.5 imply a random assignation of a class, a value closer to 1.0 indicates high accuracy of distinction.
RESULTS
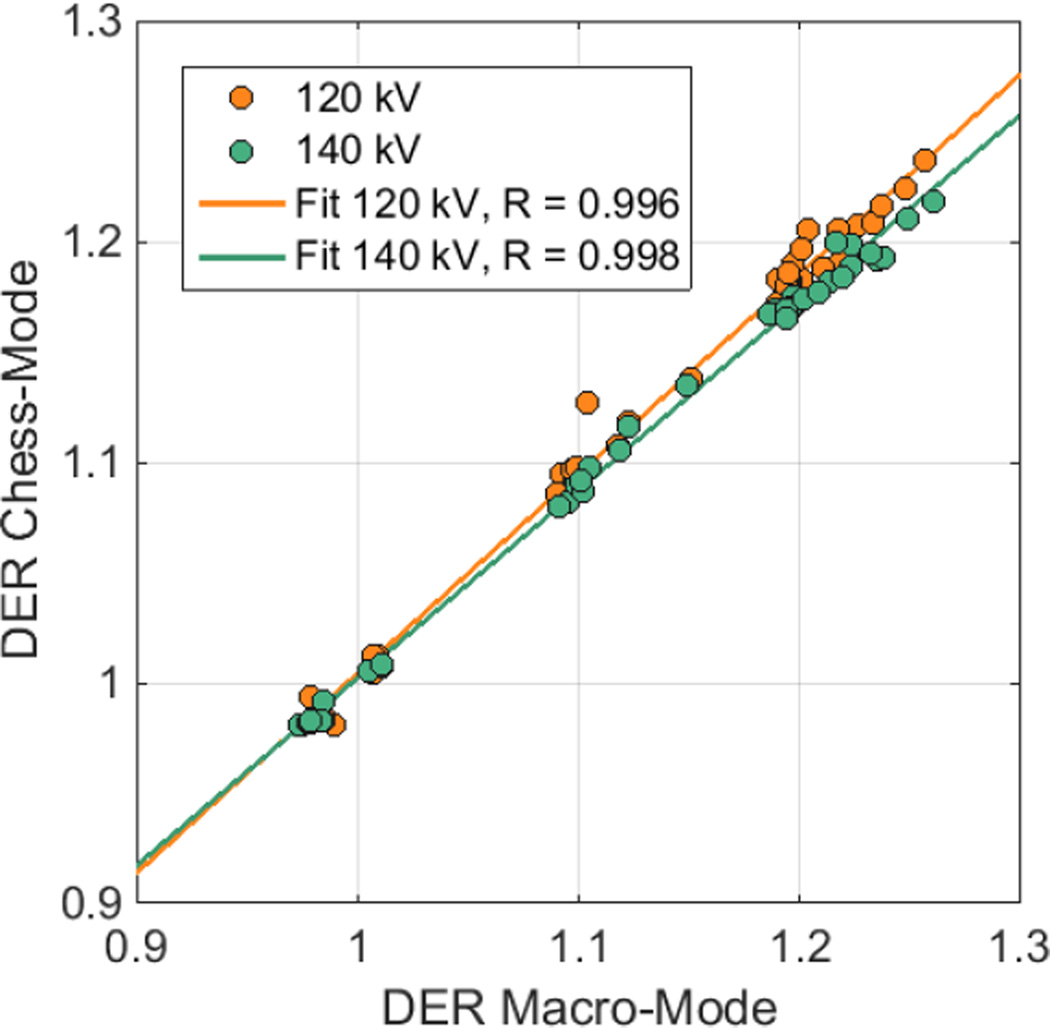
Fig. 1 illustrates the correlation of the DER for the two applied spectra with respect to the two acquisition modes. The correlation is similar for the two spectra. The plot indicates four point accumulations that represent the DER for the particular kidney stone materials. The first accumulation around DER 1.0/1.0 (MM/CM) suggest the measured DER of the UA based stones, the second one around DER 1.1/1.1 represents the CYS material stones, and between DER 1.2/1.18 and 1.22/1.22 depict the COM and APA based kidney stones. This plot also allows to estimate how well the material can be differentiated using the applied spectra.
Figure 1.
Correlation of DER between Macro-Mode images, and Chess-Mode images
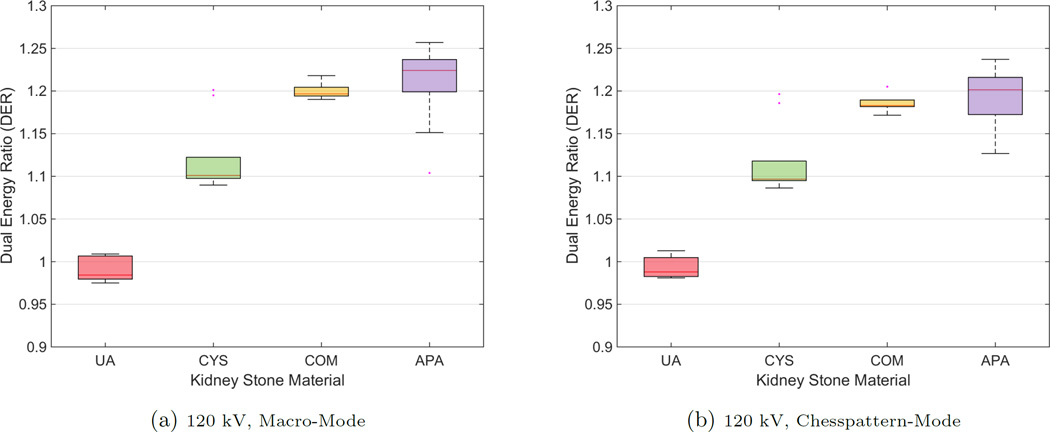
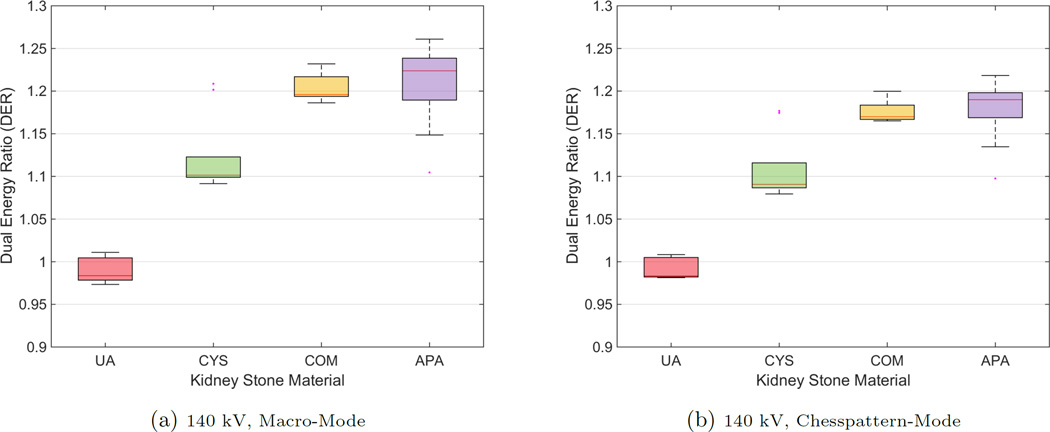
The boxplots in Fig. 2 and Fig. 3 exemplarily show the results of the two acquisitions with a typical 120 kV spectrum and a 140 kV spectrum, respectively, both for MM and CM. The results of the two acquisition modes look similar in terms of their inter-quartile range and the magnitude of the whiskers. The outlying corresponding DER for the CYS measurements can also be seen in the correlation plot. The deviation of that stone appears in all acquisitions. The apparent overlap of the boxes comparing the COM and the APA measurements indicate the difficulty to differentiate the two materials. This observation is confirmed by the application of a pairwise Wilcoxon rank-sum test. For all stone types the DER distribution was found distinct, except for the case of comparing COM and APA, where the null hypothesis (i.e. no difference of medians) cannot be rejected (at a 5% significance level). A further validation provides the ROC curves and the AUCs. Fig. 4 compares the differentiability of UA against CYS. The AUC equals 1.0, which indicates distinct differentiation. The resulting AUC is identical when comparing UA against COM and APA. Whereas CYS and APA (Fig. 5), CYS and COM (Fig. 6), and UA against all other materials can be differentiated rather well, this is not the case for COM and APA (AUC values between 0.66 and 0.76, Fig. 7).
Figure 2.
Boxplots for mean DERs for all kidney stone materials
Figure 3.
Boxplots for mean DERs for all kidney stone materials
Figure 4.
ROC Curves for UA vs. CYS, sensitivity on the y-axis, 1-specificity on the x-axis
Figure 5.
ROC Curves for CYS vs. APA, sensitivity on the y-axis, 1-specificity on the x-axis
Figure 6.
ROC Curves for CYS vs. COM, sensitivity on the y-axis, 1-specificity on the x-axis
Figure 7.
ROC Curves for COM vs. APA, sensitivity on the y-axis, 1-specificity on the x-axis
It can also be observed that despite the correlated nature of the CM images, the DER of the derived virtual low energy and virtual high energy image correspond to the DER-values of the MM scans, where the respective spectrum was applied. Among all tested kidney stone materials, UA is the material that is best differentiability from the others (always provides an AUC = 1.0), followed by CYS (AUC ≈ 0.9). This is the case for all tested spectra and acquisition modes.
DISCUSSION
We compared the ability to distinguish between four different kidney stone materials (UA, CYS, COM, APA) based on their DER. All CT images were obtained by a research PCD-CT scanner. The scan parameters included two different scan modes (MM and CM) and two different x-ray spectra (120 kV and 140 kV). Threshold-based images from the CM were processed to generate a virtual low energy image and a virtual high energy image. MM and the decorrelated CM showed similar performances for both tested spectra.
CONCLUSION
The material characteristic DER is crucial for differentiation of materials in Dual Energy processing. Four different pure kidney stone materials were compared in two different acquisition modes and two different spectra. For the MM acquisition, the bin based images serve as input for the Dual Energy evaluation. In case of the CM, the resulting threshold images were processed to generate statistically decorrelated virtual low and virtual high energy images. This study demonstrates similar material separation capabilities for all introduced acquisitions. Whereas UA was the most distinguishable material, the differentiation of CYS based kidney stones also showed good results. However, in this study COM based kidney stones couldn’t be reliably distinguished from the APA based kidney stones.
Acknowledgments
The presented CT scanner, as well as the used algorithm are prototypes and not commercially available.
REFERENCES
- 1.Joshi M, Langan D, Sahani D, Kambadakone A, Aluri S, Procknow K, Wu X, Bhotika R, Okerlund D, Kulkarni N, et al. [SPIE Medical Imaging] International Society for Optics and Photonics; 2010. Effective atomic number accuracy for kidney stone characterization using spectral ct; pp. 76223K–76223K. [Google Scholar]
- 2.Kaza RK, Platt JF, Cohan RH, Caoili EM, Al-Hawary MM, Wasnik A. Dual-energy ct with single-and dual-source scanners: current applications in evaluating the genitourinary tract. Radio-graphics. 2012;32(2):353–369. doi: 10.1148/rg.322115065. [DOI] [PubMed] [Google Scholar]
- 3.Primak AN, Fletcher JG, Vrtiska TJ, Dzyubak OP, Lieske JC, Jackson ME, Williams JC, McCollough CH. Noninvasive differentiation of uric acid versus non-uric acid kidney stones using dual-energy ct. Academic radiology. 2007;14(12):1441–1447. doi: 10.1016/j.acra.2007.09.016. [DOI] [PMC free article] [PubMed] [Google Scholar]
- 4.Graser A, Johnson TR, Bader M, Staehler M, Haseke N, Nikolaou K, Reiser MF, Stief CG, Becker CR. Dual energy ct characterization of urinary calculi: initial in vitro and clinical experience. Investigative radiology. 2008;43(2):112–119. doi: 10.1097/RLI.0b013e318157a144. [DOI] [PubMed] [Google Scholar]
- 5.Thomas C, Krauss B, Ketelsen D, Tsiikas I, Reimann A, Werner M, Schilling D, Hennenlotter J, Claussen CD, Schlemmer H-P, et al. Differentiation of urinary calculi with dual energy ct: effect of spectral shaping by high energy tin filtration. Investigative radiology. 2010;45(7):393–398. doi: 10.1097/RLI.0b013e3181df9d28. [DOI] [PubMed] [Google Scholar]
- 6.Qu M, Jaramillo-Alvarez G, Ramirez-Giraldo JC, Liu Y, Duan X, Wang J, Vrtiska TJ, Krambeck AE, Lieske J, McCollough CH. Urinary stone differentiation in patients with large body size using dual-energy dual-source computed tomography. European radiology. 2013;23(5):1408–1414. doi: 10.1007/s00330-012-2727-4. [DOI] [PMC free article] [PubMed] [Google Scholar]
- 7.Duan X, Li Z, Yu L, Leng S, Halaweish AF, Fletcher JG, McCollough CH. Characterization of urinary stone composition by use of third-generation dual-source dual-energy ct with increased spectral separation. AJR. American journal of roentgenology. 2015;205(6):1203. doi: 10.2214/AJR.15.14348. [DOI] [PMC free article] [PubMed] [Google Scholar]
- 8.Hidas G, Eliahou R, Duvdevani M, Coulon P, Lemaitre L, Gofrit ON, Pode D, Sosna J. Determination of renal stone composition with dual-energy ct: In vivo analysis and comparison with x-ray diffraction 1. Radiology. 2010;257(2):394–401. doi: 10.1148/radiol.10100249. [DOI] [PubMed] [Google Scholar]
- 9.Taguchi K, Zhang M, Frey EC, Xu J, Segars WP, Tsui BM. [Medical Imaging] International Society for Optics and Photonics; 2007. Image-domain material decomposition using photon-counting ct; pp. 651008–651008. [Google Scholar]
- 10.Alessio AM, MacDonald LR. Quantitative material characterization from multi-energy photon counting ct. Medical physics. 2013;40(3):031108. doi: 10.1118/1.4790692. [DOI] [PMC free article] [PubMed] [Google Scholar]
- 11.Li Z, Leng S, Yu L, Yu Z, McCollough CH. [SPIE Medical Imaging] International Society for Optics and Photonics; 2015. Image-based material decomposition with a general volume constraint for photon-counting ct; pp. 94120T–94120T. [DOI] [PMC free article] [PubMed] [Google Scholar]
- 12.Gutjahr R, Polster C, Kappler S, Pietsch H, Jost G, Hahn K, Schöck F, Sedlmair M, Allmendinger T, Schmidt B, et al. [SPIE Medical Imaging] International Society for Optics and Photonics; 2016. Material decomposition and virtual non-contrast imaging in photon counting computed tomography: an animal study; pp. 97831G–97831G. [Google Scholar]
- 13.Kappler S, Glasser F, Janssen S, Kraft E, Reinwand M. [SPIE Medical Imaging] International Society for Optics and Photonics; 2010. A research prototype system for quantum-counting clinical ct; pp. 76221Z–76221Z. [Google Scholar]
- 14.Kappler S, Hannemann T, Kraft E, Kreisler B, Niederloehner D, Stierstorfer K, Flohr T. [SPIE Medical Imaging] International Society for Optics and Photonics; 2012. First results from a hybrid prototype ct scanner for exploring benefits of quantum-counting in clinical ct; pp. 83130X–83130X. [Google Scholar]
- 15.Kappler S, Henning A, Krauss B, Schoeck F, Stierstorfer K, Weidinger T, Flohr T. [SPIE Medical Imaging] International Society for Optics and Photonics; 2013. Multi-energy performance of a research prototype ct scanner with small-pixel counting detector; pp. 86680O–86680O. [Google Scholar]
- 16.Taguchi K, Iwanczyk JS. Vision 20/20: Single photon counting x-ray detectors in medical imaging. Medical physics. 2013;40(10):100901. doi: 10.1118/1.4820371. [DOI] [PMC free article] [PubMed] [Google Scholar]
- 17.Kappler S, Henning A, Schoeck F, Stierstorfer K, Weidinger T, Flohr T. [IEEE Transactions on Medical Imaging: Special Issue On Spectral CT], IEEE. 2014. A hybrid research prototype ct scanner with photon counting detector. [Google Scholar]
- 18.Stierstorfer K, Rauscher A, Boese J, Bruder H, Schaller S, Flohr T. Weighted fbpa simple approximate 3d fbp algorithm for multislice spiral ct with good dose usage for arbitrary pitch. Physics in medicine and biology. 2004;49(11):2209. doi: 10.1088/0031-9155/49/11/007. [DOI] [PubMed] [Google Scholar]
- 19.Yu Z, Leng S, Kappler S, Hahn K, Li Z, Halaweish AF, Henning A, Ritman EL, Mc-Collough CH. [SPIE Medical Imaging] International Society for Optics and Photonics; 2016. Low-dose performance of a whole-body research photon-counting ct scanner; pp. 97835Q–97835Q. [Google Scholar]


