

Summary
Most mycobacterial species spontaneously form biofilms, inducing unique growth physiologies and reducing drug sensitivity. Biofilm growth progresses through three genetically programmed stages: substratum attachment, intercellular aggregation and architecture maturation. Growth of Mycobacterium smegmatis biofilms requires multiple factors including a chaperonin (GroEL1) and a nucleoid-associated protein (Lsr2), although how their activities are linked remains unclear. Here we show that Lsr2 participates in intercellular aggregation, but substratum attachment of Lsr2 mutants is unaffected, thereby genetically distinguishing these developmental stages. Further, we identify a suppressor mutation in a glycopeptidolipid synthesis gene (mps) that results in hyperaggregation of cells and fully restores the form and functions of Δlsr2 mutant biofilms. Suppression by the mps mutation is specific to Δlsr2; it does not rescue the maturation-deficient biofilms of a ΔgroEL1 mutant, thereby differentiating the process of aggregation from maturation. Gene expression analysis supports a stepwise process of maturation, highlighted by temporally separated, transient inductions of iron and nitrogen import genes. Furthermore, GroEL1 activity is required for induction of nitrogen, but not iron, import genes. Together, our findings begin to define molecular checkpoints during development of mycobacterial biofilms.
Keywords: Biofilms, phenotypic drug tolerance, substratum attachment, intercellular aggregation, maturation, glycopeptidolipids
Abbreviated Summary
This study exploits a fortuitously discovered suppressor of a biofilm-defective mutant, lsr2, to map the temporal order of genetic activities during biofilm development in mycobacteria. Genes involved in substratum attachment, intercellular aggregation and maturation are distinguished. Comparison of transcriptomes of lsr2 mutant with its suppressor redefines the role of Lsr2 and glycopeptidolipids in biofilm development, and also identifies genes, which are induced upon intercellular aggregation and play important role in maturation.
Introduction
Most microbial species naturally grow as sessile, matrix-encapsulated, multicellular communities, called biofilms, which attach to surfaces or air-liquid interfaces (Lopez et al., 2010, Fux et al., 2005, Islam et al., 2012). Biofilm growth is a programmed process, in which participating cells must establish physical contacts and chemical communications among each other, and constantly adapt to the changing microenvironments within the growing three-dimensional architecture (Sakuragi & Kolter, 2007, Hogan & Kolter, 2002, Camilli & Bassler, 2006, Davies et al., 1998). The varied growth dynamics within biofilms result in considerable cellular heterogeneity, which along with the physical protection from the extracellular matrix, promotes bacterial persistence under exogenous stress (Davies, 2003, Stoodley et al., 2002). In the human body, a vast majority of microbial infections are considered to occur as biofilms, which are extraordinarily recalcitrant to antimicrobial therapeutics (Davies, 2003, Fux et al., 2005, Hoiby et al., 2010, Mah & O’Toole, 2001). Biofilms also constitute a unique host-pathogen interface, in which the resident microbes manipulate and evade host immunity to facilitate their persistence (Anderson & O’Toole, 2008, Leid et al., 2005, Prabhakara et al., 2011).
The assemblage of microbes into biofilms proceeds through distinct stages. These include the attachment of single-cell planktonic microbes onto a substratum; aggregation and growth of the adherent cells into three-dimensionally organized structures; and encapsulation of the structures by a self-produced matrix of extracellular polymeric substance. Each of these stages, defined by specific genetic requirements, is hierarchically ordered in the developmental processes (Moorthy & Watnick, 2005, Petrova & Sauer, 2009, Pratt & Kolter, 1998, Stanley & Lazazzera, 2004). For example, Vibrio cholerae biofilm development requires cheY-3 dependent monolayer formation, which is subsequently followed by bap1 and leuO dependent matrix synthesis (Moorthy & Watnick, 2005). Similarly, biofilm development in Pseudomonas aeruginosa occurs in four stages, initiated by reversible attachment that proceeds to irreversible attachment, followed by two stages of maturation (Petrova & Sauer, 2009). While bfiS is required for transition from reversible to irreversible stage, bfmR facilitates transition from irreversible attachment to maturation-1 stage, and mifR appears to be involved in transition from maturation-1 to maturation-2 stage (Petrova & Sauer, 2009). Anchorage of Staphylococci biofilms to the host substrata is facilitated by MSCRAMMs (microbial surface components recognizing adhesive matrix molecules), whereas intercellular aggregation requires the presence of the ica locus encoding polysaccharide intercellular adhesin (PIA) and accumulation associated proteins Aap and SasG (Heilmann et al., 1996, Cramton et al., 1999, Conrady et al., 2008, Cucarella et al., 2001).
Pathogenic and environmental species of mycobacteria including Mycobacterium tuberculosis, Mycobacterium avium, Mycobacterium ulcerans and Mycobacterium smegmatis form drug-tolerant biofilms through dedicated genetic programs (Ojha et al., 2005, Ojha et al., 2008, Hall-Stoodley et al., 2006, Bosio et al., 2011, Marsollier et al., 2007, Bosio et al., 2012, Yamazaki et al., 2006). Moreover, a multi-stage developmental process of mycobacterial biofilms is suggested by the arrest of a ΔgroEL1 mutant of M. smegmatis at the monolayer stage (Ojha et al., 2005, Ojha et al., 2010). However, molecular demarcations of the developmental stages and the underlying checkpoints remain unclear for mycobacterial biofilms. In this study, fortuitous discovery of a suppressor of a biofilm-defective mutant, Δlsr2, has allowed us to address this gap. By analysis of the suppressor, we distinguish substratum attachment from intercellular aggregation in mycobacterial biofilms, and show that intercellular aggregation but not substratum attachment is necessary for subsequent development of matured biofilms. The findings reveal a hierarchical order of developmental stages in mycobacterial biofilm formation.
Results
Suppression of a Δlsr2 mutant by a mutation in mps
To isolate biofilm-defective mutants, a pool of 100,000 transposon mutants of M. smegmatis mc2155 was cultured in a syringe containing detergent-free medium (Fig. S1). Thick pellicles developed at the air-liquid interface after 5 days of incubation. We hypothesized that the liquid underlying the pellicle contained mutants, which either existed predominantly in planktonic form, or were micro-clusters of cells dislodged from the pellicles. To enrich and isolate this subpopulation, we filtered the contents of the syringe through a 5 μm filter. We recovered 120 colonies representing 27 unique mutants from the filtrate (Table S1). Of these, 28 had an insertion at the 449th nucleotide of MSMEG_2952, and 61 had an insertion at the 261st nucleotide of MSMEG_6092, which encodes for a nucleoid associated protein, Lsr2. While the isolation of lsr2 as a biofilm-defective mutant is consistent with previous reports (Nguyen et al., 2010, Chen et al., 2006), the abundance of siblings of lsr2 and MSMEG_2952 mutants in the filtrate suggests that the mutants are able to grow better in the relatively hypoxic condition below the pellicles. To further understand their phenotypes, we constructed precise deletions of MSMEG_2952 and lsr2 in mc2155. Both mutants failed to grow at the air-medium interface, instead accumulated biomass at the bottom of the culture (Figs. 1A–B). This was corroborated by increase in CFU of ΔMSMEG_2952 and Δlsr2 among the submerged subpopulation (Fig. S2A). Moreover, both mutants formed smooth colonies on a solid medium, but exhibited normal growth in planktonic culture (Figs. S2B and S2C).
Figure 1. Suppression of biofilm-defective mutants, Δlsr2 and ΔMSMEG_2952, by a secondary mutation in a GPL biosynthesis gene, mps.

A. Top-down view of pellicle biofilms of the indicated strains formed on an air-liquid interface after 5 days of incubation. mc2155 is the parent strain of M. smegmatis. Δlsr2/Δmps and Δlsr2/ΔgroEL1 denote deletions of both genes in the same strain; ΔMSMEG_2952/mpsS11X denotes truncation of mps in ΔMSMEG_2952 strain; Δlsr2comp denotes a Δlsr2 strain complemented with a plasmid carrying the wild-type copy of lsr2. While growth in Δlsr2 and ΔMSMEG_2952 occurs beneath the liquid at the bottom on the culture, ΔgroEL1 and ΔgroEL1/Δmps form untextured monolayers at the interface that contrast with the textured pellicle produced by the other strains. B. Biomass (wet weight per mL of culture medium) of 5-day old pellicles from the indicated strains (mean ± SD, n=3, ***p < 0.001). Values for Δlsr2 and ΔMSMEG_2952 could not be determined (ND) due to lack of pellicles. C and D. Thin layer chromatography (TLC) showing loss of glycopeptidolipids (GPL) in ΔMSMEG_2952/mpsS11X (C), and Δlsr2/Δmps (D). mc2155 and the respective single mutant strains were used as controls in both panels. The arrows indicate four major species of apolar GPL constitutively present in the envelope, which differ from each other with respect to the extent of methylation on the sugar moieties (Ojha et al., 2002).
During unsuccessful attempts to complement ΔMSMEG_2952, we obtained three rough-colony revertants that maintained their morphology even in the absence of the complementing plasmid (Fig. S3A). Because of the deletion in MSMEG_2952 (Fig. S3B), the smooth-to-rough colony conversion was interpreted to be due to an extragenic suppressor mutation. Whole-genome sequence analysis of one of the revertants, followed by targeted PCR of all three clones, revealed a single nucleotide insertion in MSMEG_0400 gene that truncates its open reading frame (data not shown). MSMEG_0400 encodes a mycobacterial non-ribosomal peptide synthase (mps), which synthesizes the peptide backbone of glycopeptidolipids (GPLs) (Billman-Jacobe et al., 1999). Mutations in mps have been shown to eliminate the outermost capsular layer of the envelope, reduce cell permeability, cause hyperaggregation, and result in a colony morphology rougher than mc2155 (Billman-Jacobe et al., 1999, Etienne et al., 2002). To verify the suppressor mutation, we engineered an amber mutation at the 11th residue (S11X) of mps in an unmarked ΔMSMEG_2952 strain (Fig. S3C). The double mutant, called ΔMSMEG_2952/mpsS11X, was expectedly devoid of GPL and formed fully matured biofilms that were indistinguishable from the parent mc2155 (Figs. 1A–C). Similar to ΔMSMEG_2952/mpsS11X, a deletion of mps in a Δlsr2 background (Δlsr2/Δmps) resulted in loss of GPLs and substantially restored biofilm formation (Figs. 1A–B and D). Interestingly, deletion of mps did not rescue the impaired biofilms of a ΔgroEL1 mutant (Ojha et al., 2005), implying distinct roles for Lsr2 and GroEL1 in formation of biofilms (Figs. 1A–B).
Cell-substratum attachment and intercellular aggregation have distinct genetic requirements
Suppression of Δlsr2 and ΔMSMEG_2952 by an mps mutation was surprising, given that GPLs have been proposed to have an important role in M. smegmatis biofilm formation by facilitating cellular attachment to the substratum and sliding motility (Recht & Kolter, 2001). To further clarify this apparent discrepancy, we analyzed biofilms of a deletion mutant of mps in mc2155 background. The mutant was confirmed for loss of GPL in its envelope (Fig. S3D). Similar to mc2155, the Δmps strain formed biofilms at the air-medium interface (Fig. 1A), which together with earlier reports of the hyperaggregative and rough-colony morphology of a Δmps strain (Billman-Jacobe et al., 1999, Etienne et al., 2002), led us to hypothesize that the mutants from our screen would be defective in intercellular aggregation. We therefore evaluated the aggregation proficiencies of ΔMSMEG_2952, Δlsr2 and their suppressor strains. We determined the rate of decrease in optical density of cells in a standing, detergent-free liquid suspension. In this assay, reduction in cumulative cell surface area upon aggregation proportionately reduces the total light scatter (Malik et al., 2003). Aggregation of a suspension of wild-type and Δlsr2 complemented cells in detergent-free PBS progressively increased to a maximum value in about 10 minutes, while aggregation of Δlsr2 and ΔMSMEG_2952 cells was significantly delayed (Fig. 2A). However, aggregation of the suppressor strains reached a saturating value in less than five minutes, consistent with the previously observed hyperaggregation with Δmps cells (Fig. 2A). The findings of the optical assay were further verified by a qualitative microscopic assay, in which 200 μL of homogenously suspendend cells of a fluorescently labeled strain was placed on a pre-focused glass-bottom dish on an inverted microscope and appearance of fluorescent aggregates at the bottom was measured over a 10-minute period. Consistent with the optical assay, Δlsr2 produced fewer aggregates than mc2155, but numerous large aggregates of Δlsr2/Δmps were easily evident in the period (Fig. 2B).
Figure 2. Genetic distinction between substratum attachment and intercellular aggregation. A.

Aggregation index of the indicated strains suspended in detergent-free PBS over the indicated time period. The strain nomenclature is same as described for figure 1A. B. Visualization of aggregates of the indicated strains (expressing mCherry) settled at the bottom of a glass surface from a suspension over a 10-minute period. C. A representative fluorescent micrograph showing the indicated strains, each expressing mCherry constitutively, attached to the bottom of a polystyrene plate after 24-hour of incubation. The plate was washed three times to remove non-adherent cells before imaging. D. The plot shows the coverage of the surface by each strain in five biologically independent micrographs (mean ± SD, n = 5, **** denotes p < 0.0001 by unpaired t-test). The values, obtained using ImageJ software, represent the ratios of the total pixels associated with bright areas to the total area.
We further investigated if substratum attachment of cells was impacted by the mutations. Detergent-free suspensions of fluorescently labeled strains were analyzed for their attachment to a polystyrene substratum after 24 hours of incubation at 37°C. In this assay, both ΔMSMEG_2952 and Δlsr2 cells formed a uniform monolayer on the substratum, similar to mc2155 (Figs. 2C–D). By contrast, attachment of their suppressor strains was non-uniform, and dominated by cellular aggregates (Figs. 2C–D). This implies that substratum attachment and intercellular aggregation require distinct surface properties of the envelope, determined by different sets of genes. Furthermore, GPL appears to have opposite role in substratum attachment and intercellular aggregation. Importantly, neither substratum attachment nor intercellular aggregation was impaired in the ΔgroEL1 mutant (Fig. S4): consistent with a role of the chaperonin at a developmental stage following attachment and intercellular aggregation.
To precisely define the role of GPL in biofilm development, we closely compared the growth and development of pellicle biofilms by Δmps with mc2155. Expectedly, mc2155 formed a uniform monolayer along the sidewall of the container as well as on the air-medium interface by 3rd day of incubation, developing into matured pellicles by 5th day (Figs. 3A–B). By contrast, Δmps mutant primarily formed suspended and isolated aggregates, with spotted attachment foci on the sidewall after 3 days of incubation (Figs. 3A–B). Although the biomass of the suspended aggregates of Δmps increased by the 4th day, unoccupied space on the air-medium interface remained evident (Fig. 3B). However, the mutant formed a fully textured pellicle, similar to its parent mc2155, by the 5th day. The developmental course of Δmps biofilms is consistent with a specific role of GPL as a facilitator of cellular motility and subsequent spreading on a surface, likely by reducing cell-cell aggregation.
Figure 3. Biofilm development by mc2155 and Δmps strains. A.

A side view of biofilms of the two strains formed on the sidewall of the culture dish after 3-day incubation. The arrow indicates the horizontal plane of the air-medium interface. B. A top-down view of pellicle biofilms of the two strains across the air-medium interface at the indicated time point.
Phenotypic similarity between ΔMSMEG_2952 and Δlsr2 led us to analyze the expression of each of the two genes upon mutation in the other. While expression of MSMEG_2952 remained unchanged upon lsr2 mutation, expression of lsr2 was about 8-fold less in ΔMSMEG_2952 (Fig. S5). Moreover, overexpression of lsr2 from a constitutively strong promoter (Phsp60) restored the biofilm development of ΔMSMEG_2952 (Fig. S5). It is thus likely that lsr2 expression is responsive to a cis-element in MSMEG_2952. To avoid redundancy, we omitted ΔMSMEG_2952 and its suppressor from further studies.
Biofilms of Δlsr2/Δmps have similar properties to mc2155 biofilms
We next investigated whether the Δlsr2/Δmps strain exhibited other characteristics associated with the biofilms of mc2155. The extracellular abundance of free mycolic acids (FM), as a matrix material, is one of the key structural features of mycobacterial biofilms (Ojha et al., 2010, Ojha et al., 2008). While the FM levels were reduced in Δlsr2 biofilms, the levels in Δlsr2/Δmps biofilms were similar to mc2155, suggesting a restoration of signals that trigger FM synthesis and maturation of biofilms (Figs. 4A–B). We further tested Δlsr2/Δmps biofilms for tolerance to antibiotics and conjugal transfer of DNA, two established properties of mycobacterial biofilms (Ojha et al., 2010, Nguyen et al., 2010). A substantial restoration of both phenotypes was observed in Δlsr2/Δmps biofilms (Figs. 4C–D). Together, these three assays indicate that the biofilms formed by the suppressor are morphologically and functionally similar to that of the parent mc2155 strain.
Figure 4. Physiological and functional similarities between mc2155 and the suppressor (Δlsr2/Δmps) biofilms. A.

Radio-TLC showing free mycolic acid (FM) synthesized by mc2155, Δlsr2 and its suppressor Δlsr2/Δmps after 5 days of growth in biofilms. Purified 14C-FM was used as a marker (M). Cells were labeled with 14C-acetate, and radiolabeled lipids equivalent to 10,000 cpm were loaded for analysis by thin-layer chromatography in chloroform: methanol (96:4). B. Quantitative analysis of the level of FM as a percentage of total apolar lipids in Figure 4A. Data represent mean ± SE (n = 3, ** denotes p < 0.01 by unpaired t-test). C. Frequency of conjugal transfer of DNA between a recipient strain of M. smegmatis MKD8, and the indicated donor strains (mean ± SD, n = 3, * denotes p < 0.05 by unpaired t-test). D. Sensitivity of 5-day old biofilms of the indicated strains to 400 μg/mL of rifampicin. Following 5 days of growth, rifampicin was added in the liquid beneath the pellicles and incubated for the times indicated on the x-axis. At each time point, cells were harvested and plated on fresh medium to determine their viability (mean ± SD, n = 3).
Lsr2 has an indirect role in biofilm formation
Lsr2 binds at hundreds of genomic sites and impacts the expression of a large set of genes in M. smegmatis (Gordon et al., 2010, Colangeli et al., 2007). Thus, lsr2 mutations have pleiotropic effects that complicate the interpretation of the mutant phenotypes. The suppressor of Δlsr2 offers an advance. We reasoned that genes that have lower expression in Δlsr2, but restored back to the mc2155 level in Δlsr2/Δmps, could have consequential role in morphological and/or functional development of biofilms. We therefore compared the transcriptomes of mc2155, Δlsr2 and Δlsr2/Δmps strains grown in biofilms using RNA-seq (Table S2). Because the Δlsr2 mutant does not form pellicle biofilms, but can be distinguished from mc2155 and Δlsr2/Δmps as colonies, we assessed colony biofilm as a model to compare the three strains.
The transcriptomes from mc2155 and Δlsr2 colonies identified 162 genes with increased expression (Fig. 5A, Table S3), and 112 genes with decreased expression in the mutant (Fig. 5A, Table S4), when a statistically significant (q < 0.05) 4-fold difference was used as the cut-off point. The differences observed from RNA-seq data are much greater than those identified in a previous microarray-based transcriptomic study performed on planktonic cultures of Δlsr2 and mc2155 (Colangeli et al., 2007). This could be attributed either to differences in growth condition or a greater linear dynamic range of the RNA-seq technique. However, similar to our data, more genes with increased expression than those with decreased expression were found in the previous study (Colangeli et al., 2007). This finding is in agreement with the idea that Lsr2 is primarily a negative regulator of gene expression. No difference in the expression of mps was observed (Table S2), which was consistent with the similar levels of GPLs found in both Δlsr2 and mc2155 (Fig. 1C). However, Kocíncová et.al. proposed that Lsr2 negatively regulates mps expression (Kocincova et al., 2008). Their conclusion was based on analysis of smooth colony variants, which produced high levels of GPL and had mutations in lsr2. It is plausible that the consequence of Lsr2 on mps expression is conditional upon the presence of additional unidentified mutations in the variants.
Figure 5. Transcriptomics of colony cultures of mc2155, Δlsr2 and Δlsr2/Δmps strains on agar plates.

A and B. Volcano plots depicting statistically significant differences in the transcript levels of genes between mc2155 and Δlsr2 (A), and mc2155 and Δlsr2/Δmps (B) strains obtained by RNA-seq. The y-axis shows the statistical significance (q-values) of the mRNA fold difference, shown on the x-axis. The values in green (increased) and red (decreased) boxes represent genes with a greater than 4-fold, statistically significant (q < 0.05) differences in the expression. Complete list of these genes is in Table S2. C. Validation of the differential expression of a select set of genes (indicated on x-axis) by RT-qPCR (mean ± SD, n = 3). The sigA transcript was used as an endogenous reference for normalization.
The transcriptome profile of the Δlsr2/Δmps suppressor cells showed a striking contrast between genes positively and negatively impacted by the loss of Lsr2 (Figs. 5A–B, Table S3 and S4). Expression of all but one (except MSMEG_6451) genes negatively impacted by a deletion of lsr2 was restored by the secondary deletion of mps, implying that these genes are under indirect control of Lsr2 (Figs. 5A–B, and Table S4). A randomly selected subset of five genes confirmed the RNA-seq patterns (Fig. 5C). Deletion of MSMEG_6451 in mc2155 did not produce any detectable biofilm phenotype, thereby ruling out a significant contribution to the Δlsr2 phenotype (data not shown). Only seven genes with elevated expression in the Δlsr2 reverted back to mc2155-like expression in the Δlsr2/Δmps double mutant (Table S3). Deletion of these seven genes in a Δlsr2 background failed to alter the Lsr2-dependent deficiency in biofilm formation (data not shown), suggesting that expression of these genes does not contribute to the Δlsr2 phenotype. Together, the transcriptome of the suppressor confirms Lsr2 as a negative regulator. Although the precise effect of Lsr2 on the envelope that determines aggregation remains unknown, it appears to be less important in a GPL-free envelope.
Nitrogen starvation response in late biofilm development
To understand the significance of the 111 genes (excluding lsr2) whose expression is restored to the mc2155 levels upon deletion of mps in a Δlsr2 mutant, we examined using RNA-seq their expression in early (84 hours post inoculation) and late (144 hours post inoculation) stages of mc2155 pellicle biofilms, compared with their expression in a planktonic culture (Table S5). Eighty-three of these genes were induced exclusively at the late stage, and one was induced at both stages, while the expression of the remaining 27 genes did not change significantly between the two conditions (Fig. 6A, Table S6). The late expression of the 83 genes is consistent with their induction after successful establishment of Lsr2-dependent aggregated growth. A majority of the 83 genes had been detected in a previous microarray-based transcriptomic study of M. smegmatis biofilms (Ojha & Hatfull, 2007). Their restored expression in a genetic suppressor of an aggregation-deficient mutant suggests they are induced in response to intercellular aggregation, and thus unambiguously defines these 83 genes as biofilm-specific factors associated with the late-stage of development.
Figure 6. Genes with restored expression in the Δlsr2/Δmps suppressor are induced during maturation of mc2155 biofilms.

A. Heat map depicting difference in expression levels of 111 genes, which are decreased in a Δlsr2 strain but restored in a Δlsr2/Δmps strain (Table S4). Expression of genes was measured in early and late biofilms (bf) of mc2155, and compared to their basal levels in a planktonic (plnk) culture of the strain. 83 of these genes are expressed exclusively in late-stage biofilms (see the list in Table S6). B. Expression of three amt genes (amt1; MSMEG_ 2425, amt2; MSMEG_4635 and amt3: MSMEG_6259) in planktonic mc2155 cells after 3 hours of incubation in N0, or C0 variations of biofilm (bf) medium, free of primary sources of nitrogen and carbon, respectively. C. 5-day biofilms of the wild-type and indicated mutants in N1/2 or C1/2 variations of complete bf medium containing half the amounts of these nutrients. The mutants are denoted with their respective MSMEG_ numbers. D. planktonic growth of wild-type and mutants shown in panel C in N1/2 biofilm medium. E. Expression of Fe sequestering genes (MSMEG_0615 and MSMEG_4509) and amt1 during biofilm growth of mc2155 at the indicated time post inoculation. F. Comparison of expression of the amt genes in planktonic (plnk) and 5-day (5d) biofilms (bf) of wild-type and ΔgroEL1 cells. All expression levels were determined by RT-qPCR and Ct values were normalized using the sigA transcript. Data in panels B, D, E and F represent mean ± SD, n = 3.
Fifty-one out of the 83 genes, including putative nitrite reductases (MSMEG_0427-28), ammonium transporters (amt1; MSMEG_ 2425, amt2; MSMEG_4635 and amt3: MSMEG_6259) and Glu/Gln synthetases (MSMEG_6260 and 6263), are controlled by a nitrogen-starvation sensing regulator GlnR (Amon et al., 2008, Jenkins et al., 2013) (Table S6). This suggests a biofilm-specific N-starvation response in cells during late stages of development. To further confirm the N-starvation response in late biofilms, we examined the effect of N depletion on expression of the amt genes in planktonic cultures of mc2155. The expression of all three amt genes was induced by 60–200 fold within three hours of incubation of cells in N0 medium, which lacked supplemental ammonium sulfate and casamino acids, but had normal glucose (Fig. 6B). However, incubation in C0 medium (without any primary carbon source, but with normal levels of N sources) did not produce a transcriptional response in the genes (Fig. 6B). As expected, deletion mutants of loci containing amt genes, ΔMSMEG_2425-27, ΔMSMEG_4635-36 and ΔMSMEG_6259-68, failed to form mature biofilms in N1/2-medium (50% of normal levels of ammonium sulfate and casamino acids)(Fig. 6C). The biomass of the mutants were correspondingly lower than the wild type (Fig. S6A), although no significant difference in cell density was observed (Figs. S6B–C). This suggests that nitrogen assimilation in the mutants was above the threshold of the amount required for viability, but below the threshold necessary to produce biomass for the pellicles. This is further supported by the fact that the mutants showed no significant deficiency during planktonic growth in N1/2 medium (Fig. 6D). Consistent with the N-specific induction of the genes, the mutants formed normal biofilms in C1/2-medium (50% of normal levels of glucose) (Fig. 6C).
amt genes are induced after Fe import genes in biofilms
A biofilm-specific response to iron (Fe) limitation, reflected by induced expression of Fe sequestration pathways and their requirement for biofilm formation, has been described previously (Ojha & Hatfull, 2007). Interestingly, the RNA-seq data in this study suggested that the genes involved in Fe sequestration, including exochelin and mycobactin biosynthesis (MSMEG_0011-15, MSMEG_4509-16) (Ojha & Hatfull, 2007), as well as the ESX-3 system (MSMEG_0615-25) (Siegrist et al., 2009), are induced earlier than the 83 genes associated with late biofilms including the three amt genes (Table S6). This highlights distinct transcriptional programs in biofilm formation, defined by their specific gene expression patterns. To precisely determine the induction times of Fe and N import genes during biofilm development, we analyzed the expression levels of an amt gene (amt1) and two genes representing Fe sequestration systems (MSMEG_0615 and MSMEG_4509). The mRNA samples were collected from an early (day-3) stage through to the matured biofilm stage (day-7) (Ojha et al., 2005). Induction of the two Fe sequestration genes peaked at day-4, while induction of amt1 was maximal at day-5 (Fig. 6E). Expression of all three genes decreased to a basal level by day-6 (Fig. 6E), suggesting that the inductions of Fe and N import genes are driven more by increased metabolic demand during developmental phases of biofilm formation, rather than by acute starvation in the restrictive microenvironment within biofilms.
Induction of amt, but not Fe import genes, requires GroEL1 activity in biofilms
The chaperonin GroEL1 modulates mycolic acid biosynthesis to produce FM during maturation of biofilms (Ojha et al., 2010, Ojha et al., 2005). We therefore examined the requirement for GroEL1-dependent functions for induction of Fe and N import activities. Induction of the Fe import genes in the day-4 biofilms was mostly unaffected in a ΔgroEL1 mutant (Fig. S7A). However, induction of all three amt genes in day-5 biofilms required GroEL1 activity (Fig. 6F). Their induction in a nitrogen-limiting planktonic culture of a ΔgroEL1 strain was unaffected (Fig. S7B), thereby ruling out a direct role of GroEL1 in their regulation. Thus, signals inducing amt genes, and perhaps other N import genes, are likely generated from a GroEL1-dependent checkpoint that likely occurs before the day-5 stage.
Discussion
Our study sheds light on the likely order of molecular events and their genetic requirements during development of M. smegmatis biofilms (Fig. 7). During early stages of biofilm formation, Lsr2 appears to be critical for aggregated growth of cells that contain GPLs on the surface. However, the precise determination of the Lsr2-dependent aggregation factor(s) requires further investigation. In contrast to the effect of Lsr2, GPLs in the envelope appear to inhibit aggregation or promote disaggregation. Thus, the presence of GPL in the envelope could maximize the surface area of the suspended planktonic aggregates during initial attachment to a substratum, and also allow spreading of the aggregates on the substratum by facilitating sliding motility in the loosely-held cells (Recht & Kolter, 2001). The inverse relationship between aggregation and sliding motility is further consistent with the hypermotility of a Δlsr2 mutant on a semi-solid substratum (Arora et al., 2008). However, GPL-dependent attachment and motility appears to be unimportant for biofilm development on an air-liquid interface, likely because the liquid permits free diffusion and growth of suspended aggregates. Biofilms formed by cells without GPLs on a solid substratum are likely to be poorly attached, but developmentally matured. Thus, GPLs could have a specialized role in formation of anchored biofilms under shear fluid flow. This process could be relevant for environmental mycobacteria like M. avium, which is abundantly found in showerheads and sewage systems (Feazel et al., 2009).
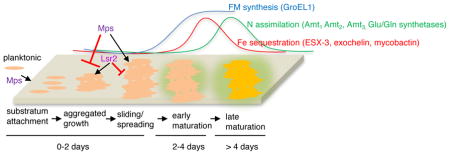
Figure 7. A model depicting the cellular and molecular events and their approximate times that demarcate the stages of biofilm development in M. smegmatis.

Levels of FM synthesis, Fe sequestration and N import/assimilation in early and late maturation stages, relative to early stage of aggregated growth, are shown above the developmental scheme. Representations are not scaled. The genes used in this study to define these stages are indicated. Planktonic cells attach to a substratum, the coverage of which is determined by Mps-dependent GPLs in the envelope. GPLs inhibit aggregation and also allow spreading of cells on the substratum. Lsr2 is required for aggregated growth of cells containing GPLs in the envelope. Growth of aggregates triggers GroEL1-dependent FM synthesis, and induction of Fe-sequestration pathways that mark the early stage of maturation. These are followed by induction of N-assimilation/import genes at late-stage of maturation.
Following the early events of attachment and aggregated growth (~ 2 days under the studied condition), a GroEL1-dependent increase in FM synthesis is observed (Ojha et al., 2005, Ojha et al., 2010), triggering the next phase of development. The later requirement of the chaperonin in the developmental process is also consistent with the observation that ΔgroEL1 strains exhibit a normal aggregation phenotype (Fig. S4). The sequential induction of Fe and N import genes at the day-4 and day-5 stages, respectively, indicates that there are additional discrete steps in the maturation process. The temporal nature of these steps further suggests that each step is likely characterized by a unique physiological cell state, which is determined by the requirement for specific nutrients during different phases of maturation. Although the induction of Fe-import genes at the day-4 stage is consistent with a requirement for Fe at this stage, the signals leading to this requirement appear to originate prior to the GroEL1-dependent phase of the maturation process. The GroEL1-dependent induction of amt genes at the day-5 stage biofilm, but not in planktonic culture, indicates that there are biofilm-specific signals produced that are necessary for the maturation.
Given that Lsr2 is required during early stages for intercellular aggregation, restoration of conjugal transfer of DNA and rifampicin tolerance in the Δlsr2 suppressor is broadly consistent with the idea that the cellular phenotypes unique to biofilms emerge during the later developmental stages. Delayed and differential expression of Fe and N utilization genes could play an important role in the temporal emergence of these biofilm-associated phenotypes. In summary, the characterization of a suppressor of a biofilm defective lsr2 mutant from a secondary mutation in mps has redefined the roles of both Lsr2 and Mps in early stages of mycobacterial biofilm development, and provided an evidence for the relationship between form and functions of biofilms. In addition, the transcriptional profiling of these mutants has offered an unprecedented molecular insight into the order of genetic events in maturation of biofilms. These findings together provide a more detailed framework to further determine the biology of mycobacteria in biofilms.
Experimental Procedures
Bacterial strains and media
A list of all strains and plasmids are in Tables S7 and S8. Unless indicated, M. smegmatis mc2155 was grown at 37°C in 7H9ADC (Becton Dickinson) with 0.05% Tween-80 for planktonic cultures. 7H10ADC agar (Becton Dickinson) was used for plate cultures. Escherichia coli (DH5α) was grown at 37°C in LB broth or LB agar. As necessary, hygromycin, kanamycin and zeocin were added at 150, 20 or 25 μg/mL, respectively, to the growth medium. Biofilms of M. smegmatis strains were grown as described earlier (Ojha et al., 2005). Briefly, cells from 10 μL of saturated planktonic cultures were inoculated into 10 mL of antibiotic-free complete biofilm medium (modified M63 medium: 15 mM NH4SO4, 100 mM KH2PO4, 0.5% w/v casamino acids, 1.8 μM FeSO4.7H2O, 110 mM glucose, 1 mM MgSO4, 1 mM CaCl2) in either 60 mm polystyrene dishes or 12-well polystyrene plates, and incubated stationary at 30°C up to 7-days. The N0 version of biofilm medium was prepared by omitting casamino acids and ammonium sulfate from the complete biofilm medium. The N1/2 version was prepared by reducing the initial concentrations of the nitrogen sources by half. Similarly, C0 and C1/2 versions of biofilm medium were prepared by either omitting glucose (for C0), or reducing it to half (for C1/2).
Screening of transposon mutant library
A high-density library of ~100,000 primary colonies was prepared using phMycomarT7 (Sassetti et al., 2001). The library was pooled and cultured in 7H9ADC with 0.05% w/v Tween-80 with 20 μg/mL kanamycin until OD 1.0 (6 ×10⁸ CFU/mL). About 100,000 cells were inoculated in 5 mL biofilm media and aspirated into a 10 mL syringe. The syringe was placed upright, with its tip sterilized and parafilm-wrapped for 5 days (Supplementary Fig. 1). The content of the syringe was filtered through a 5 μm filter and plated on 7H10ADC with 20 μg/mL kanamycin. Transposon insertion sites in the colonies were mapped as described earlier (Ojha et al., 2015).
Construction of mutants and plasmids
All plasmids and oligonucleotides used in this study are listed in Tables S7 and S9, respectively. Mutations in M. smegmatis were constructed using previously described methods (Bardarov et al., 2002, van Kessel et al., 2008). The isogenic deletion mutant, ΔMSMEG_2952, was constructed using the gene replacement technique (Bardarov et al., 2002), for which the PCR-amplified allelic exchange substrates were cloned into AflII-XbaI (left arm) and NheI-BglII (right arm) of pYUB854, respectively. The recombinant plasmid was subsequently packaged into the PacI site of phAE87. The recombinant transducing particles were transduced into mc2155. Recombinant hygr colonies were confirmed by Southern blot for the expected genotype. Recombineering was used for construction of all other mutants. For construction of mpsS11X, an unmarked ΔMSMEG_2952 strain containing the recombineering plasmid pJV62 was grown in 7H9 medium with 0.2% succinate and 0.05% Tween-80 at 37°C until an OD600 0.5, 0.2% acetamide was added to induce the recombineering proteins. Electrocompetent cells were prepared after 4 hours of induction. 60 base-pair single stranded oligonucleotides were designed with the necessary mutations and co-electroporated with the marker plasmid pJT4. The plasmid pJT4 was constructed by cloning the hygr gene from pYUB854 into pMH94 between the XbaI and NheI sites. Electroporated colonies were plated on 7H10ADC with hygromycin (150 μg/mL), and kanamycin (20 μg/mL). Candidate revertant colonies were selected based on rough colony morphology and confirmed by sequencing. For construction of deletion strains by recombineering, allelic exchange substrates were generated by sewing-PCR on either side of a loxP flanked zeocin-resistant cassette using the respective primers listed in Supplementary table 6. The PCR-products were electroporated into an electrocompetent recombineering strain, mc2155-pJV53-SacB, and plated on 7H10ADC with 25 μg/mL zeocin. The genotype of zeor colonies was confirmed by PCR. The recombineering plasmid, pJV53-SacB, was removed by plating the cells on 7H10ADC with 15% sucrose, and screening sucrose resistant colonies for sensitivity to kanamycin, the marker for pJV53-SacB. The zeor marker was removed by excision using a Cre recombinase. pCre-SacB was electroporated into the mutant cells and transformants were screened for loss of zeor. The zeos colonies were screened on 7H10ADC with 15% sucrose to obtain clones without the pCre-SacB plasmid. The rescued unmarked mutants were complemented as indicated. The rescued unmarked Δlsr2 and ΔgroEL1 strains were used for introducing mps deletion by recombineering.
Attachment assay
Briefly, cells constitutively overexpressing mCherry from an integrative plasmid were cultured in 10 mL of detergent-free 7H9ADC media until late-log phase. The cells were harvested and washed three times in 10 mL PBS, and resuspended in PBS to an OD600 of 0.1. Subsequently, a 5 mL aliquot of each sample was transferred to a polystyrene petri dish (Falcon) and incubated at 37°C for 24 hours. After the incubation, liquid was aspirated from the plate and residual unattached cells were removed by three washes of 10 mL PBS, each for 5 minutes on a shaker at 50 rpm. Attached cells were fixed with 2% paraformaldehyde made in PBS for 15 minutes at room temperature. The plates were air-dried for 24 hours at room temperature and examined under fluorescent microscope at 20X magnification. Micrographs were analyzed by ImageJ.
Aggregation assay
Strains of M. smegmatis were inoculated from an agar plate into 10 mL of 7H9ADC media without Tween-80 and cultured until saturation. Cells were washed 3 times and resuspended in 10 mL of PBS. The cellular aggregates in the suspension were broken with repeated passage through an 18G needle fitted in a syringe. After vortexing for 30 seconds, 1mL of the cell suspension was added to a cuvette and placed in the spectrophotometer. The initial (0 minute) OD600 reading was taken the moment the lid of the spectrophotometer was closed and readings were at taken each subsequent minute for 15 minutes. Aggregation index scores were calculated using the following equation:
For microscopic analysis of the aggregates settling from suspension, cells constitutively overexpressing mCherry from an extrachromosomal plasmid were cultured and processed the same way as for the optical assay. Then 200 μL of cells, adjusted to a density of 106 cfu/mL in detergent-free PBS, placed on a pre-focused optical dish for 10min under inverted fluorescent microscope at 20X magnification. Appearance of aggregated at the focal plane (bottom of the dish) were recorded.
Antibiotic tolerance assay
The antibiotic sensitivity of biofilms at a given time of drug exposure was determined as described earlier (Ojha et al., 2008). Briefly, two sets of each strain were cultured as biofilms in complete biofilm medium for 5 days at 30°C. To one set, 400 μg/mL rifampicin was added and the exposed biofilms were incubated at 30°C for the indicated period, while the other set was incubated unexposed. At the indicated time point, the rifampicin exposed and unexposed biofilms were harvested, dispersed in PBS with 0.1% Tween-80 for 24 hours, and plated on 7H10ADC to count the number of viable cells. The ratio of viable cells in exposed to unexposed biofilms was calculated to determine the percentage of surviving cells.
Genome sequencing and analysis
Genomic DNA from the described strains was isolated and a library preparation of the fragments was performed using the Ion XpressTM Plus Fragment Library kit (Life Technologies) according to manufacturer’s instructions. One microgram of DNA was fragmented by incubation at 37°C for 9 minutes in 1X reaction buffer and 25% Enzyme Mix II. The reaction was stopped by addition of stop buffer and DNA was purified using Ampure XP reagent (Agencourt). A 1:10 dilution of fragmented DNA was analyzed on the Agilent Bioanalyzer to verify that median fragment size was 350–450 bp. Sequencing adapters and Ion Xpress barcodes were ligated to fragmented DNA, nick repair was performed and DNA was purified using Ampure beads. The library was size selected for 350–400 bp fragments using an E-Gel SizeSelectTM (Life Technologies). The library was amplified via 8 cycles of PCR. Library quantitation was performed using the Ion Library Quantitation kit (Life Technologies). Following template generation by OneTouch2 and bead enrichment, the library was loaded on an Ion Torrent PGM 318 chip (Life Technologies) and the sequencing reaction was run for 850 flows for a median read length of 283 bp. Raw sequences were filtered for quality score of 20 and the sequence alignment was performed on a CLC Genomics platform.
Extraction and analysis of lipids
FM analysis was performed as described previously (Ojha et al., 2008). Briefly, cells were grown as biofilms in complete biofilm medium containing 1 μCi/mL of 14C-acetic acid, sodium salt (Perkin Elmer # NEC084H001MC). Total cells were harvested, washed, and FM-rich apolar lipids were extracted in 2mL methanol: 0.3% NaCl (10: 1) and 1mL petroleum ether per 50mg dried biomass. Apolar lipids equivalent to 10,000cpm from the air-dried organic layer were analyzed by thin-layer chromatography in chloroform: methanol (96:4). GPL analysis was performed as described previously (Ojha et al., 2002). Briefly, indicated strains were grown in 50mL of detergent-free 7H9ADC medium at 37 °C until saturation, and total lipids from harvested cells were extracted twice with 10mL of chloroform: methanol (2:1) for 24 h at room temperature, and the extracts were pooled and dried at room temperature. The air-dried lipids were resuspended in 7mL chloroform: methanol: water (4:2:1), and centrifuged at 2000 rpm for 10 minutes to collect the organic layer, which was air-dried and resuspended in 1mL chloroform: methanol (2:1). The suspension was treated with an equal volume of 0.2M NaOH in methanol at 37 °C for 30 minutes and then neutralized with glacial acetic acid. The organic layer was collected by centrifugation. The deacylated lipids obtained from the dried organic layer were then developed on a TLC plate with in chloroform: methanol (9:1). GPL was visualized by spraying the plate with 0.2% orcinol in 10% ethanolic H2SO4, followed by 10 minutes of baking at 121°C.
RNA-seq
mc2155 and its mutant derivatives were grown on 7H10ADC plates at 37 °C to obtain a confluent lawn. Total RNA was extracted from the lawn of cells using a Qiagen RNeasy kit and contaminating DNA was removed with the turbo DNA-free kit (Thermo Fisher Scientific). For each sample, 5 μg of total RNA was processed for rRNA removal using the RiboZero kit (Illumina). Strand-specific DNA libraries were then prepared with 100ng of mRNA using the Scriptseq Complete Kit- Bacteria (Illumina). Libraries were sequenced on the NextSeq500 platform (Illumina). Sequences were analyzed by Rockhopper (McClure et al., 2013) at default settings using the reference genome of M. smegmatis mc2 155 (NC_008596). RNA-seq of planktonic and pellicle biofilms of mc2155 were performed similarly, but cells were grown in detergent-free modified M63 biofilm medium as previously described (Ojha et al., 2005).
RT-qPCR
All oligonucleotides used for RT-qPCR are listed in Table S9. DNA-free RNA for RT-qPCR was extracted as described for RNA-seq. For each sample, 200 ng of RNA was used for reverse transcription using the Maxima First Strand cDNA Synthesis Kit (Thermo Fisher Scientific). RT-qPCR was performed on a 7000 fast RT-qPCR System (Applied Biosystems) with SYBR Green Master Mix following the manufacturer’s instructions. Relative expression of target gene is calculated as 2−ΔCt (gene of interest-sigA).
Filter mating assay
Filter mating assay was done according to the protocol as described previously (Nguyen et al., 2010). Briefly, donor and recipient strains were cultured in tryptic soy broth (TSB) with 0.05%Tween-80 at 37°C until an OD600 of 1.0. Aliquots of 0.5 mL each of donor and recipient cells were mixed together and pelleted by centrifugation. The cells were washed twice in TSB, and were resuspended in a final volume of 100 μL TSB. Cells were spotted onto a filter, which was placed on tryptic soy agar (TSA) and incubated at 30°C for 24 hours. The cells were removed from the filter and resuspended in 1ml TSB with 0.05%Tween-80 by vortexing. The numbers of donors, recipients, and transconjugants were determined by plating cells onto TSA plates with appropriate antibiotics that selected for each population. The conjugation frequency was expressed as the number of transconjugants per donor.
Supplementary Material
Acknowledgments
The authors acknowledge technical help from Kathleen Kulka, Mohammad Islam, Timothy Connors, Jacob Richards and Natalie Boucher, and gifts of phT7MycoMar, pJV62 and pJV53-SacB from Eric Rubin, Graham Hatfull and Todd Gray, respectively. Authors acknowledge two Wadsworth Center Core facilities – Applied Genomic Technologies, and Media and Tissue Culture – for their support, as well as Dr. Kimberly Mclive Reed of Health Research Inc. for reading and editing the manuscript. This work was supported by grants from NIH to AKO (AI107595 and AI132422), WRJ (AI26170) and KMD (AI107258). Y.Y., J.T., K.M.D., W.R.J. and A.O. designed experiments. Y.Y., J.T., Y.L. and C.V. performed experiments. Y.Y., K.M.D., W.R.J., and A. O. analyzed data. Y.Y., K.M.D. and A.O. wrote the manuscript.
Footnotes
Competing Interest
The authors declare no competing financial interests.
References
- Amon J, Brau T, Grimrath A, Hanssler E, Hasselt K, Holler M, Jessberger N, Ott L, Szokol J, Titgemeyer F, Burkovski A. Nitrogen control in Mycobacterium smegmatis: nitrogen-dependent expression of ammonium transport and assimilation proteins depends on the OmpR-type regulator GlnR. J Bacteriol. 2008;190:7108–7116. doi: 10.1128/JB.00855-08. [DOI] [PMC free article] [PubMed] [Google Scholar]
- Anderson GG, O’Toole GA. Innate and induced resistance mechanisms of bacterial biofilms. Curr Top Microbiol Immunol. 2008;322:85–105. doi: 10.1007/978-3-540-75418-3_5. [DOI] [PubMed] [Google Scholar]
- Arora K, Whiteford DC, Lau-Bonilla D, Davitt CM, Dahl JL. Inactivation of lsr2 results in a hypermotile phenotype in Mycobacterium smegmatis. J Bacteriol. 2008;190:4291–4300. doi: 10.1128/JB.00023-08. [DOI] [PMC free article] [PubMed] [Google Scholar]
- Bardarov S, Bardarov S, Jr, Pavelka MS, Jr, Sambandamurthy V, Larsen M, Tufariello J, Chan J, Hatfull G, Jacobs WR., Jr Specialized transduction: an efficient method for generating marked and unmarked targeted gene disruptions in Mycobacterium tuberculosis, M. bovis BCG and M. smegmatis. Microbiology. 2002;148:3007–3017. doi: 10.1099/00221287-148-10-3007. [DOI] [PubMed] [Google Scholar]
- Billman-Jacobe H, McConville MJ, Haites RE, Kovacevic S, Coppel RL. Identification of a peptide synthetase involved in the biosynthesis of glycopeptidolipids of Mycobacterium smegmatis. Molecular microbiology. 1999;33:1244–1253. doi: 10.1046/j.1365-2958.1999.01572.x. [DOI] [PubMed] [Google Scholar]
- Bosio S, Leekha S, Gamb SI, Wright AJ, Terrell CL, Miller DV. Mycobacterium fortuitum prosthetic valve endocarditis: a case for the pathogenetic role of biofilms. Cardiovasc Pathol. 2011 doi: 10.1016/j.carpath.2011.11.001. [DOI] [PubMed] [Google Scholar]
- Bosio S, Leekha S, Gamb SI, Wright AJ, Terrell CL, Miller DV. Mycobacterium fortuitum prosthetic valve endocarditis: a case for the pathogenetic role of biofilms. Cardiovasc Pathol. 2012;21:361–364. doi: 10.1016/j.carpath.2011.11.001. [DOI] [PubMed] [Google Scholar]
- Camilli A, Bassler BL. Bacterial small-molecule signaling pathways. Science. 2006;311:1113–1116. doi: 10.1126/science.1121357. [DOI] [PMC free article] [PubMed] [Google Scholar]
- Chen JM, German GJ, Alexander DC, Ren H, Tan T, Liu J. Roles of Lsr2 in colony morphology and biofilm formation of Mycobacterium smegmatis. J Bacteriol. 2006;188:633–641. doi: 10.1128/JB.188.2.633-641.2006. [DOI] [PMC free article] [PubMed] [Google Scholar]
- Colangeli R, Helb D, Vilcheze C, Hazbon MH, Lee CG, Safi H, Sayers B, Sardone I, Jones MB, Fleischmann RD, Peterson SN, Jacobs WR, Jr, Alland D. Transcriptional regulation of multi-drug tolerance and antibiotic-induced responses by the histone-like protein Lsr2 in M. tuberculosis. PLoS pathogens. 2007;3:e87. doi: 10.1371/journal.ppat.0030087. [DOI] [PMC free article] [PubMed] [Google Scholar]
- Conrady DG, Brescia CC, Horii K, Weiss AA, Hassett DJ, Herr AB. A zinc-dependent adhesion module is responsible for intercellular adhesion in staphylococcal biofilms. Proceedings of the National Academy of Sciences of the United States of America. 2008;105:19456–19461. doi: 10.1073/pnas.0807717105. [DOI] [PMC free article] [PubMed] [Google Scholar]
- Cramton SE, Gerke C, Schnell NF, Nichols WW, Gotz F. The intercellular adhesion (ica) locus is present in Staphylococcus aureus and is required for biofilm formation. Infect Immun. 1999;67:5427–5433. doi: 10.1128/iai.67.10.5427-5433.1999. [DOI] [PMC free article] [PubMed] [Google Scholar]
- Cucarella C, Solano C, Valle J, Amorena B, Lasa I, Penades JR. Bap, a Staphylococcus aureus surface protein involved in biofilm formation. J Bacteriol. 2001;183:2888–2896. doi: 10.1128/JB.183.9.2888-2896.2001. [DOI] [PMC free article] [PubMed] [Google Scholar]
- Davies D. Understanding biofilm resistance to antibacterial agents. Nature reviews Drug discovery. 2003;2:114–122. doi: 10.1038/nrd1008. [DOI] [PubMed] [Google Scholar]
- Davies DG, Parsek MR, Pearson JP, Iglewski BH, Costerton JW, Greenberg EP. The involvement of cell-to-cell signals in the development of a bacterial biofilm. Science. 1998;280:295–298. doi: 10.1126/science.280.5361.295. [DOI] [PubMed] [Google Scholar]
- Etienne G, Villeneuve C, Billman-Jacobe H, Astarie-Dequeker C, Dupont MA, Daffe M. The impact of the absence of glycopeptidolipids on the ultrastructure, cell surface and cell wall properties, and phagocytosis of Mycobacterium smegmatis. Microbiology. 2002;148:3089–3100. doi: 10.1099/00221287-148-10-3089. [DOI] [PubMed] [Google Scholar]
- Feazel LM, Baumgartner LK, Peterson KL, Frank DN, Harris JK, Pace NR. Opportunistic pathogens enriched in showerhead biofilms. Proceedings of the National Academy of Sciences of the United States of America. 2009;106:16393–16399. doi: 10.1073/pnas.0908446106. [DOI] [PMC free article] [PubMed] [Google Scholar]
- Fux CA, Costerton JW, Stewart PS, Stoodley P. Survival strategies of infectious biofilms. Trends Microbiol. 2005;13:34–40. doi: 10.1016/j.tim.2004.11.010. [DOI] [PubMed] [Google Scholar]
- Gordon BR, Li Y, Wang L, Sintsova A, van Bakel H, Tian S, Navarre WW, Xia B, Liu J. Lsr2 is a nucleoid-associated protein that targets AT-rich sequences and virulence genes in Mycobacterium tuberculosis. Proceedings of the National Academy of Sciences of the United States of America. 2010;107:5154–5159. doi: 10.1073/pnas.0913551107. [DOI] [PMC free article] [PubMed] [Google Scholar]
- Hall-Stoodley L, Brun OS, Polshyna G, Barker LP. Mycobacterium marinum biofilm formation reveals cording morphology. FEMS Microbiol Lett. 2006;257:43–49. doi: 10.1111/j.1574-6968.2006.00143.x. [DOI] [PubMed] [Google Scholar]
- Heilmann C, Schweitzer O, Gerke C, Vanittanakom N, Mack D, Gotz F. Molecular basis of intercellular adhesion in the biofilm-forming Staphylococcus epidermidis. Molecular microbiology. 1996;20:1083–1091. doi: 10.1111/j.1365-2958.1996.tb02548.x. [DOI] [PubMed] [Google Scholar]
- Hogan DA, Kolter R. Pseudomonas-Candida interactions: an ecological role for virulence factors. Science. 2002;296:2229–2232. doi: 10.1126/science.1070784. [DOI] [PubMed] [Google Scholar]
- Hoiby N, Bjarnsholt T, Givskov M, Molin S, Ciofu O. Antibiotic resistance of bacterial biofilms. Int J Antimicrob Agents. 2010;35:322–332. doi: 10.1016/j.ijantimicag.2009.12.011. [DOI] [PubMed] [Google Scholar]
- Islam MS, Richards JP, Ojha AK. Targeting drug tolerance in mycobacteria: a perspective from mycobacterial biofilms. Expert Rev Anti Infect Ther. 2012;10:1055–1066. doi: 10.1586/eri.12.88. [DOI] [PMC free article] [PubMed] [Google Scholar]
- Jenkins VA, Barton GR, Robertson BD, Williams KJ. Genome wide analysis of the complete GlnR nitrogen-response regulon in Mycobacterium smegmatis. BMC Genomics. 2013;14:301. doi: 10.1186/1471-2164-14-301. [DOI] [PMC free article] [PubMed] [Google Scholar]
- Kocincova D, Singh AK, Beretti JL, Ren H, Euphrasie D, Liu J, Daffe M, Etienne G, Reyrat JM. Spontaneous transposition of IS1096 or ISMsm3 leads to glycopeptidolipid overproduction and affects surface properties in Mycobacterium smegmatis. Tuberculosis (Edinb) 2008;88:390–398. doi: 10.1016/j.tube.2008.02.005. [DOI] [PubMed] [Google Scholar]
- Leid JG, Willson CJ, Shirtliff ME, Hassett DJ, Parsek MR, Jeffers AK. The exopolysaccharide alginate protects Pseudomonas aeruginosa biofilm bacteria from IFN-gamma-mediated macrophage killing. J Immunol. 2005;175:7512–7518. doi: 10.4049/jimmunol.175.11.7512. [DOI] [PubMed] [Google Scholar]
- Lopez D, Vlamakis H, Kolter R. Biofilms. Cold Spring Harb Perspect Biol. 2010;2:a000398. doi: 10.1101/cshperspect.a000398. [DOI] [PMC free article] [PubMed] [Google Scholar]
- Mah TF, O’Toole GA. Mechanisms of biofilm resistance to antimicrobial agents. Trends Microbiol. 2001;9:34–39. doi: 10.1016/s0966-842x(00)01913-2. [DOI] [PubMed] [Google Scholar]
- Malik A, Sakamoto M, Hanazaki S, Osawa M, Suzuki T, Tochigi M, Kakii K. Coaggregation among nonflocculating bacteria isolated from activated sludge. Applied and environmental microbiology. 2003;69:6056–6063. doi: 10.1128/AEM.69.10.6056-6063.2003. [DOI] [PMC free article] [PubMed] [Google Scholar]
- Marsollier L, Brodin P, Jackson M, Kordulakova J, Tafelmeyer P, Carbonnelle E, Aubry J, Milon G, Legras P, Andre JP, Leroy C, Cottin J, Guillou ML, Reysset G, Cole ST. Impact of Mycobacterium ulcerans biofilm on transmissibility to ecological niches and Buruli ulcer pathogenesis. PLoS pathogens. 2007;3:e62. doi: 10.1371/journal.ppat.0030062. [DOI] [PMC free article] [PubMed] [Google Scholar]
- McClure R, Balasubramanian D, Sun Y, Bobrovskyy M, Sumby P, Genco CA, Vanderpool CK, Tjaden B. Computational analysis of bacterial RNA-Seq data. Nucleic Acids Res. 2013;41:e140. doi: 10.1093/nar/gkt444. [DOI] [PMC free article] [PubMed] [Google Scholar]
- Moorthy S, Watnick PI. Identification of novel stage-specific genetic requirements through whole genome transcription profiling of Vibrio cholerae biofilm development. Molecular microbiology. 2005;57:1623–1635. doi: 10.1111/j.1365-2958.2005.04797.x. [DOI] [PMC free article] [PubMed] [Google Scholar]
- Nguyen KT, Piastro K, Gray TA, Derbyshire KM. Mycobacterial biofilms facilitate horizontal DNA transfer between strains of Mycobacterium smegmatis. Journal of bacteriology. 2010;192:5134–5142. doi: 10.1128/JB.00650-10. [DOI] [PMC free article] [PubMed] [Google Scholar]
- Ojha A, Anand M, Bhatt A, Kremer L, Jacobs WR, Jr, Hatfull GF. GroEL1: a dedicated chaperone involved in mycolic acid biosynthesis during biofilm formation in mycobacteria. Cell. 2005;123:861–873. doi: 10.1016/j.cell.2005.09.012. [DOI] [PubMed] [Google Scholar]
- Ojha A, Hatfull GF. The role of iron in Mycobacterium smegmatis biofilm formation: the exochelin siderophore is essential in limiting iron conditions for biofilm formation but not for planktonic growth. Molecular microbiology. 2007;66:468–483. doi: 10.1111/j.1365-2958.2007.05935.x. [DOI] [PMC free article] [PubMed] [Google Scholar]
- Ojha AK, Baughn AD, Sambandan D, Hsu T, Trivelli X, Guerardel Y, Alahari A, Kremer L, Jacobs WR, Jr, Hatfull GF. Growth of Mycobacterium tuberculosis biofilms containing free mycolic acids and harbouring drug-tolerant bacteria. Molecular microbiology. 2008;69:164–174. doi: 10.1111/j.1365-2958.2008.06274.x. [DOI] [PMC free article] [PubMed] [Google Scholar]
- Ojha AK, Hatfull GF, Jacobs WR., Jr . Genetic Dissection of Mycobacterial Biofilms. In: Parish T, Roberts D, editors. Mycobacteria Protocols. New York: Springer; 2015. [Google Scholar]
- Ojha AK, Trivelli X, Guerardel Y, Kremer L, Hatfull GF. Enzymatic hydrolysis of trehalose dimycolate releases free mycolic acids during mycobacterial growth in biofilms. J Biol Chem. 2010;285:17380–17389. doi: 10.1074/jbc.M110.112813. [DOI] [PMC free article] [PubMed] [Google Scholar]
- Ojha AK, Varma S, Chatterji D. Synthesis of an unusual polar glycopeptidolipid in glucose-limited culture of Mycobacterium smegmatis. Microbiology. 2002;148:3039–3048. doi: 10.1099/00221287-148-10-3039. [DOI] [PubMed] [Google Scholar]
- Petrova OE, Sauer K. A novel signaling network essential for regulating Pseudomonas aeruginosa biofilm development. PLoS pathogens. 2009;5:e1000668. doi: 10.1371/journal.ppat.1000668. [DOI] [PMC free article] [PubMed] [Google Scholar]
- Prabhakara R, Harro JM, Leid JG, Harris M, Shirtliff ME. Murine immune response to a chronic Staphylococcus aureus biofilm infection. Infect Immun. 2011;79:1789–1796. doi: 10.1128/IAI.01386-10. [DOI] [PMC free article] [PubMed] [Google Scholar]
- Pratt LA, Kolter R. Genetic analysis of Escherichia coli biofilm formation: roles of flagella, motility, chemotaxis and type I pili. Molecular microbiology. 1998;30:285–293. doi: 10.1046/j.1365-2958.1998.01061.x. [DOI] [PubMed] [Google Scholar]
- Recht J, Kolter R. Glycopeptidolipid acetylation affects sliding motility and biofilm formation in Mycobacterium smegmatis. J Bacteriol. 2001;183:5718–5724. doi: 10.1128/JB.183.19.5718-5724.2001. [DOI] [PMC free article] [PubMed] [Google Scholar]
- Sakuragi Y, Kolter R. Quorum-sensing regulation of the biofilm matrix genes (pel) of Pseudomonas aeruginosa. J Bacteriol. 2007;189:5383–5386. doi: 10.1128/JB.00137-07. [DOI] [PMC free article] [PubMed] [Google Scholar]
- Sassetti CM, Boyd DH, Rubin EJ. Comprehensive identification of conditionally essential genes in mycobacteria. Proceedings of the National Academy of Sciences of the United States of America. 2001;98:12712–12717. doi: 10.1073/pnas.231275498. [DOI] [PMC free article] [PubMed] [Google Scholar]
- Siegrist MS, Unnikrishnan M, McConnell MJ, Borowsky M, Cheng TY, Siddiqi N, Fortune SM, Moody DB, Rubin EJ. Mycobacterial Esx-3 is required for mycobactin-mediated iron acquisition. Proceedings of the National Academy of Sciences of the United States of America. 2009;106:18792–18797. doi: 10.1073/pnas.0900589106. [DOI] [PMC free article] [PubMed] [Google Scholar]
- Stanley NR, Lazazzera BA. Environmental signals and regulatory pathways that influence biofilm formation. Molecular microbiology. 2004;52:917–924. doi: 10.1111/j.1365-2958.2004.04036.x. [DOI] [PubMed] [Google Scholar]
- Stoodley P, Sauer K, Davies DG, Costerton JW. Biofilms as complex differentiated communities. Annu Rev Microbiol. 2002;56:187–209. doi: 10.1146/annurev.micro.56.012302.160705. [DOI] [PubMed] [Google Scholar]
- van Kessel JC, Marinelli LJ, Hatfull GF. Recombineering mycobacteria and their phages. Nature reviews Microbiology. 2008;6:851–857. doi: 10.1038/nrmicro2014. [DOI] [PMC free article] [PubMed] [Google Scholar]
- Yamazaki Y, Danelishvili L, Wu M, Hidaka E, Katsuyama T, Stang B, Petrofsky M, Bildfell R, Bermudez LE. The ability to form biofilm influences Mycobacterium avium invasion and translocation of bronchial epithelial cells. Cellular microbiology. 2006;8:806–814. doi: 10.1111/j.1462-5822.2005.00667.x. [DOI] [PubMed] [Google Scholar]
Associated Data
This section collects any data citations, data availability statements, or supplementary materials included in this article.