Abstract
Purpose
To develop a single-shot spiral perfusion pulse sequence with outer-volume suppression (OVS) to achieve whole heart coverage with a short temporal footprint of 10 ms per slice location.
Methods
A highly-accelerated single-shot variable density spiral pulse sequence with an integrated OVS module for reduced FOV (rFOV) perfusion imaging with 2 mm spatial resolution was developed and evaluated in simulations, phantom experiments and in clinical patients with (N=8) or without OVS (N=8). Images were reconstructed by block low-rank sparsity with motion-guidance (BLOSM) and graded by two cardiologists on a 5-point scale (1-excellent, 5-poor).
Results
Simulation and phantom results showed that OVS effectively suppressed the signal outside the desired FOV. Clinical patient data demonstrated high quality perfusion images with rFOV. The average image quality scores of full FOV cases and rFOV cases were 3.1 ± 0.64 and 2.3 ± 0.46 (p = 0.02) from cardiologist 1, and 2.5 ± 0.54 and 1.8 ± 0.47 (p = 0.04) from cardiologist 2, showing superior image quality for the rFOV images as compared to the full FOV images.
Conclusion
A single-shot spiral perfusion sequence which utilizes OVS and BLOSM performs perfusion imaging with a very short temporal footprint per image supporting whole-heart coverage with good image quality.
Keywords: Single-shot, spiral trajectory, first-pass perfusion, outer-volume suppression
Introduction
In the US alone over 8.2 million people suffer from angina pectoris, resulting in the performance of nearly 10 million stress tests annually to evaluate for the presence of coronary artery disease (CAD)1. Adenosine stress perfusion cardiac magnetic resonance (CMR) has emerged as a technique with high diagnostic and prognostic utility in the evaluation of CAD2-5. Currently available CMR perfusion imaging techniques still suffer from limitations, including dark-rim artifacts6 resulting from cardiac motion and Gibbs ringing at high-contrast interfaces and limited spatial coverage of the ventricle, both of which are related to temporal footprint of the acquisition and the limited time available for data acquisition in each heartbeat. Recent 3D techniques have addressed the issue of spatial coverage of the ventricle and have demonstrated clinical utility in multi-center studies7-9. However, these techniques have a relatively long temporal footprint which limits in-plane spatial resolution10.
We have shown that spiral pulse sequences demonstrate reduced motion-induced dark-rim artifacts, and can accurately detect obstructive CAD as defined by quantitative coronary angiography11-13. Given the high acquisition efficiency of spiral techniques, we recently demonstrated whole-heart coverage with a 3-interleaved spiral pulse sequence capable of imaging 8 slices with a 2 mm in-plane resolution with a temporal resolution footprint of 35 ms per slice14. However, the need for multiple interleaves necessitates the use of a flip angle of around 30°, and each interleave traverses the center of k-space at a separate time relative to the saturation pulse. Given the high acquisition efficiency of spiral trajectories, we sought to determine the feasibility of acquiring a complete perfusion image following a single RF excitation. This single-shot excitation approach acquires data with a very short temporal footprint due to the high sampling efficiency, but also requires highly accelerated spiral trajectories with an associated SNR penalty which can be mitigated using a 90-degree excitation pulse.
Although the heart only occupies a small region of the chest, an imaging field of view (FOV) that encompasses the whole chest is required to avoid spatial aliasing that results from violation of the Nyquist sampling rate. For spiral imaging, where the readout direction is continually changing, a traditional anti-aliasing filter, which can be used to restrict the FOV in the RO direction, cannot be utilized and the full extent of the object must be supported in all directions to avoid aliasing. By using an outer-volume suppression (OVS) strategy to achieve a reduced FOV (rFOV), k-space can be sampled more coarsely resulting in improved sampling efficiency15. Multiple studies have demonstrated successful application of OVS for cardiac imaging16,17, however OVS has not previously been applied to T1-weighted Gd enhanced myocardium first pass perfusion imaging.
The goal of this study was to develop an SR-recovery and OVS strategy suitable for a single-shot rFOV spiral perfusion sequence capable of achieving full heart coverage with high spatial resolution and a short temporal footprint. Given the high acquisition efficiency of spiral pulse sequences, we sought to develop a technique which can image a slice with a single 90-degree excitation and a single spiral readout to achieve an unprecedented temporal footprint of <10 ms per image.
Methods
Design Consideration
We have previously shown that first-pass myocardial perfusion imaging using accelerated spirals with an optimized trajectory and k-t sampling pattern can produce high quality 2D perfusion images with whole-heart coverage at heart rates up to 125 BPM14. This technique uses multiple spiral interleaves with an effective acceleration factor of 5 to achieve whole heart coverage with 8 slices and in-plane resolution of 2 mm by supporting a 340 mm2 FOV. The temporal footprint of each perfusion image is 35 ms. We propose that the delay time between saturation and data acquisition can be used to perform OVS to reduce aliasing from objects outside of the desired rFOV. When combined with a single-shot spiral readout, this OVS preparation would enable perfusion imaging with the same in-plane resolution as described above, but with a temporal acquisition footprint of <10 ms/slice
Single-shot Excitation and SNR Consideration
The balance between spatial resolution, temporal footprint, and SNR can be expressed as follows:
| (1) |
where η is the SNR efficiency of variable-density spiral trajectory18, δxyz is the spatial resolution, Ttotal is the total readout time for specific slice and C is a constant which depends on the proton density, relaxation times (T1 and T2*) and sequence parameters. In the optimized multi-shot spiral technique, we utilized 3 spirals with a 5 ms readout duration per interleaf (total readout duration 15 ms). If we only used a single spiral with a 5 ms readout, SNR would reduce to 58%. By increasing the readout to 8 ms, the maximal duration which produces high-quality perfusion images at 1.5T with minimal drop-out and off resonance artifacts as shown previously12, SNR would still reduce to 73% as compared to the multi-shot spiral acquisition, assuming that other sequence parameters are held constant. While the single-shot sequence will have lower SNR due to the shorter total readout, as only one excitation is needed per image, a 90° flip angle can be used to recover SNR. For the aforementioned 3 interleaved spiral the optimal flip angle for constant magnetization with interleaved acquisition was 31 degrees14. This difference in FA should result in a 94% increase in SNR (sin(90°)/sin(31°)) for the single-shot sequence with 90° excitation. The last factor to consider is the trajectory factor (η) which describes the relative loss of SNR due to non-uniform weighting of noise in k-space resulting from variable density sampling and density compensation. For the given trajectories, following the description of Tsai et al18, this factor was 0.8 for the single-shot technique as compared to the 3-interleaved sequence. Combining these factors, the single-shot technique should have raw data with an SNR that is 13% higher than that of the 3-interleaved pulse sequence, while reducing the temporal foot print from 35ms per image to 10 ms per interleave. Notably, the single-shot trajectory requires a 12x undersampling of the outer region of k-space to achieve the same 2-mm spatial resolution, at a FOV of 340mm2. By using OVS, the effective undersampling of k-space is reduced by a factor of 2 which reduces aliasing and should result in improved CS reconstruction as compared to the single-shot full FOV technique.
OVS Design and Evaluation
We implemented a rapid, B1-robust 2D OVS technique to enable imaging of a reduced FOV that only includes the heart. The OVS preparation is similar to that described by Smith et al15, and uses the design method described by Pauly et al19. The preparation (Fig. 1a) consists of a non-selective tip-down, followed by spatially selective tip-back and a spoiler. A 4 ms adiabatic BIR-420 tip-down pulse is used for non-selective excitation, and a 2.2 ms jinc-shaped 2D spiral spatial selective19 pulse with a time-bandwidth product of 4 is used to tip back spins within a 100 mm cylindrical rFOV. The pulse was designed with a resolution of 100mm and an excitation FOV of 800 mm (±400 mm). A 2 ms spoiler gradient is used to dephase residual transverse magnetization. The rFOV was designed to be large enough to encompass the heart even in the presence of respiratory motion. The excitation FOV was designed to be large enough that the first spatial side-lobe would be outside of the body.
Figure 1.
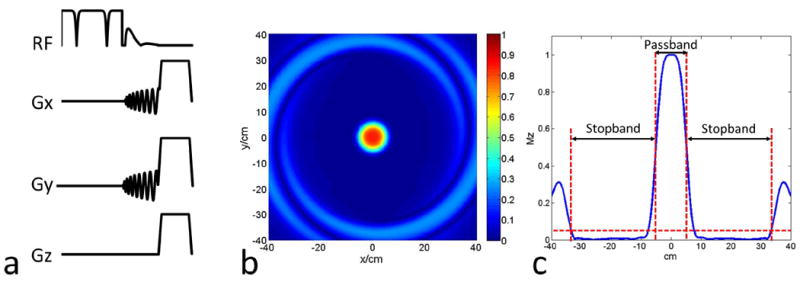
(a) Diagram of the 2D OVS pulse sequence, which is consisted of a non-selective adiabatic BIR-4 tip-down pulse, 2D spiral spatial selective tip-back pulse and the spoiler to crush the residual signal. (b) 2D spatial profile of the rFOV = 100 mm design. (c) 1D spatial profile across the 2D profile center to show the stopband is around ±335 mm.
The two-dimensional spatial profile of the module was evaluated using a Bloch simulation. To evaluate the performance of the OVS module as a function of B0 and B1 inhomogeneity, we performed Bloch simulations of the module over a range of B0 (±300Hz) and B1 scale factors of 0.2 to 1.2. Bloch equations were performed using a T1 of 300 ms and a T2 of 50 ms.
To test the OVS module performance, three Siemens QA water phantoms with short T1 (100 ms) were scanned by a Cartesian fast low angle shot (FLASH) sequence and the proposed spiral sequence with and without OVS module. The FLASH sequence parameters included: echo time (TE) 1.2 ms, repetition time (TR) 1 s, FA 15°, matrix size 128×128, slice thickness 10 mm with FOV 170 mm. Spiral pulse sequence parameters are as described below in the “Pulse Sequence Design” section.
Pulse Sequence Design
The pulse sequence is shown schematically in Figure 2 (a). Non-selective saturation with an adiabatic BIR-4 pulse is applied for T1-weighted preparation. A spectrally selective fat-saturation (SPAIR) pulse is used to achieve fat suppression, followed by the OVS module to suppress signals from outside the heart. The SPAIR pulse is applied at a time for which fat is nulled by the combination of the BIR-4 saturation and SPAIR pulse at the time of spiral acquisition of the first slice. This novel approach is detailed in Supporting Figure 1.
Figure 2.
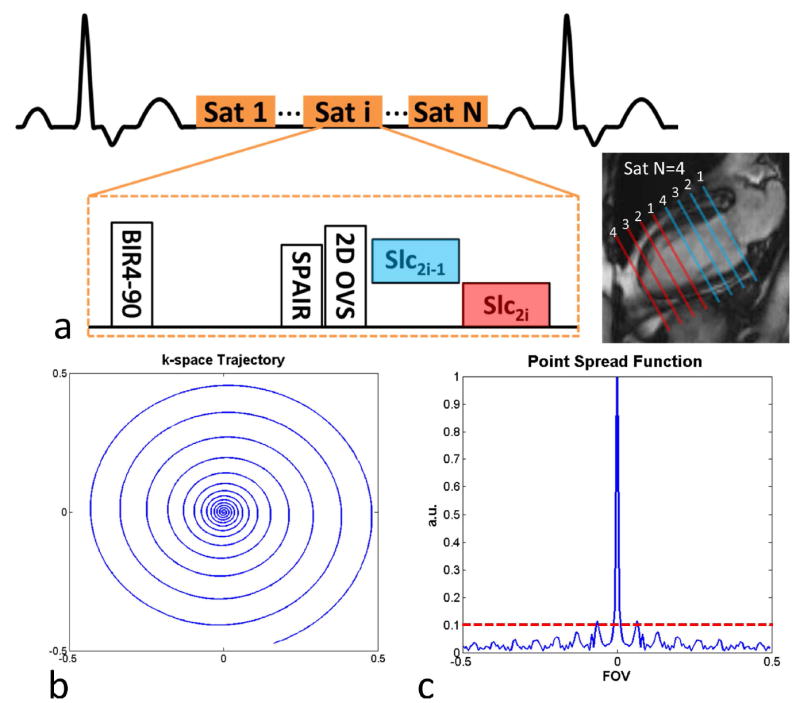
(a) Schematic of the single-shot spiral perfusion with 2D OVS pulse sequence. (b) k-space trajectory of the single-shot spiral with Fermi-shape dual density design and (c) corresponding point spread function to show the incoherent sampling pattern.
For each slice location, a single-shot spiral readout is acquired with a single 90-degree excitation pulse. Typically, 2 slices are acquired in each SR block with the acquisition order shown in Figure 2 (a), and SR blocks are repeated until all the slices are imaged.
The single-shot spiral trajectory is presented in Figure 2 (b). It is an 8 ms constant-slew spiral using a Fermi-shape dual density design14, with 20% of the center fully sampled (in time along the trajectory) and a broad transition to reach the ending density of 0.15x Nyquist, achieving 2mm resolution at a reduced FOV of 170 mm. The slew rate for the spiral was 120 T/m/s and the spiral achieves a maximal gradient strength of 25mT/m at the end of the spiral trajectory.
The corresponding point spread function (PSF) is shown in Figure 2 (c). The PSF has a low first side-lobe amplitude, and the side-lobe energy is distributed over a number of low amplitude side-lobes resulting from the variable density sampling strategy. When combined with rotation by the golden angle (111.25°) in time, this strategy produces a relatively incoherent and noise-like aliasing pattern well suited to CS reconstruction.
Image Reconstruction
Block low-rank sparsity with motion-guidance (BLOSM)21 combined with SENSE22 was implemented to reconstruct the under-sampled perfusion images through optimization of:
| (2) |
where m represents the estimated perfusion images, d is the acquired under-sampled k-space data, and Fu is the under-sampled non-uniform Fourier transform, which only takes values at the k-space positions where d are acquired. S is the coil sensitivity map, which is estimated using eigen-analysis23 from temporal average images. ΦR represents the operator for block tracking and creation of rearranged clusters, after m is divided into blocks which are tracked using displacement maps R. ║*║p* is a joint Schatten p-norm that exploits the regional low rank property. A solution to equation 2 was obtained by solving an unconstrained Lagrangian problem using an iterative soft-thresholding (IST) algorithm24 The image reconstruction was implemented in MATLAB (R2013b, the MathWorks, Natick, MA).
Human Studies
To compare the performance of the full FOV and rFOV perfusion sequence, resting first-pass perfusion was performed in 16 subjects (8 for each sequence) undergoing clinically ordered CMR studies. The indications for the clinical CMR studies included evaluation of myocardial viability (N=4), pericardial disease (N=4), arrhythmias (premature ventricular contractions/ventricular tachycardia) (N=3), cardiac sarcoid (N=3), hypertrophic cardiomyopathy (N=1) and right ventricular enlargement (N=1). Written informed consent was obtained from all subjects, and imaging studies were performed under institutional review board (IRB) approved protocols. Imaging was performed on a 1.5T MRI scanner (MAGNETOM Avanto, Siemens Medical Solutions, Erlangen, Germany). Perfusion imaging was performed using 0.075mmol/kg Gd-DTPA (Bayer AG, Leverkusen, Germany) injected intravenously at a rate of 4mL/s followed by 25 mL of saline flush at 4mL/s. The subjects were asked to hold their breath as long as possible followed by shallow breathing during the acquisition of perfusion images over 50-60 heart beats. A 32-channel cardiac phased-array receiver coil (Invivo Corporation, Best, Netherlands) was used for signal reception. Imaging protocols for the full FOV and rFOV sequence are shown in Table 1. Common sequence parameters included: echo time (TE) 1.0 ms, repetition time (TR) 9 ms, saturation recovery time (SRT) 80 ms, FA 90°, temporal footprint 8 ms each slice, 2 slices per saturation, slice thickness 10 mm with no gap between slices, and 8 slices covering the whole left ventricle.
Table 1.
Sequence parameters for full FOV and rFOV sequences.
| Full FOV (N=8) | rFOV (N=8) | |
|---|---|---|
| FOV (mm) | 340 | 170 |
| Resolution (mm) | 2.0 | 2.0 |
| Starting density | 1.2 | 1.2 |
| Ending density | 0.08 | 0.15 |
| Fully sample k-space center | 20% | 20% |
Image Analysis
Perfusion images were reconstructed by the proposed BLOSM algorithm. Image quality was graded on a 5-point scale (1-excellent, 5-poor) independently by two experienced cardiologists blinded to acquisition method by zooming in the full FOV images to the same size of rFOV images. Statistical analysis on the image scores from the two reviewers were analyzed using the Wilcoxon signed rank tests. Image quality of the full FOV and rFOV sequence was analyzed using the Mann-Whitney U test.
Results
Simulation and Phantom Results
The 2D spatial profile of the spiral tip-back pulse is shown in Figure 1 (b) and a profile along the y axis of the pulse is shown in Figure 1 (c). The FWHM of the rFOV pulse was 100 mm and the usable stopband (defined as where Mz is <5% of M0) was ±335 mm. Figure 3 shows the simulated performance of the OVS module across the B1 scale factors (a) and resonance frequency offsets (b). The OVS pulse is relatively insensitive to the off-resonance effect due to adiabatic excitation and short tip-back spiral pulse. However, the OVS performance degrades at lower B1 scale factors due to the non-adiabatic tip-back pulse, reaching 75% efficiency at a B1 scale factor of 0.6. At a B1 scale factor within 1±0.1 (within 10% of expected), the efficiency was 95%.
Figure 3.

Simulated performances of the OVS by varying the off resonance (a) and B1 scale (b).
Figure 4 shows the OVS performance in a phantom using Cartesian and spiral pulse sequences. Figure 4 (a) shows the phantom setup along with a yellow-box representing the imaging FOV and an arrow indicating the phase encoding direction for the Cartesian pulse sequence. For the Cartesian sequence without OVS (b), strong spatial aliasing resulted in wrapping artifact. This aliasing was largely suppressed in the (c) Cartesian sequence with OVS. For the highly under-sampled spiral pulse sequence without OVS (d), the aliasing pattern from the outer phantoms appears as a swirling artifact superimposed on the central water phantom. When the OVS is used with the spiral pulse sequence (e) the swirling artifacts are dramatically reduced, and the remaining aliasing arises from under-sampling of the center water bottle due to the 8x acceleration within the reduced FOV of 170 mm.
Figure 4.
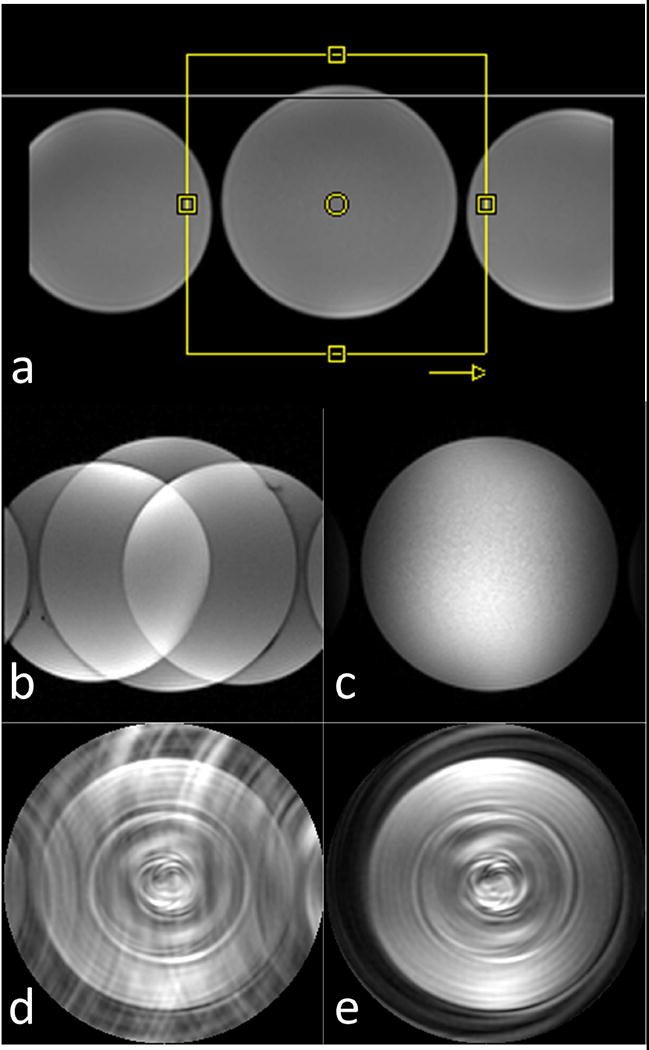
OVS performance in phantoms (T1 = 100 ms) using Cartesian and spiral pulse sequences. (a) phantom setup along with a yellow-box representing the imaging FOV and an arrow indicating the phase encoding direction for the Cartesian pulse sequence. Cartesian reduced FOV images are shown without (b) and with (c) OVS preparation. Highly under-sampled spiral reduced FOV images are shown without (d) and with (e) OVS preparation.
Human Studies
Figure 5 shows direct reconstruction with zero padding (dc/zp) (a) and BLOSM (c) images from the single-shot spiral sequence with FOV 340 mm without OVS and dc/zp (b) and BLOSM (d) from the single-shot spiral sequence with rFOV 170 mm. Note the stronger aliasing artifacts in the direct reconstruction of the data without OVS (a) as compared to the data using the OVS technique (b). Without OVS, the BLOSM technique is not able to completely remove aliasing due to signal from outside of the rFOV of interest (c), whereas in the BLOSM reconstruction with OVS the residual aliasing is removed (d).
Figure 5.
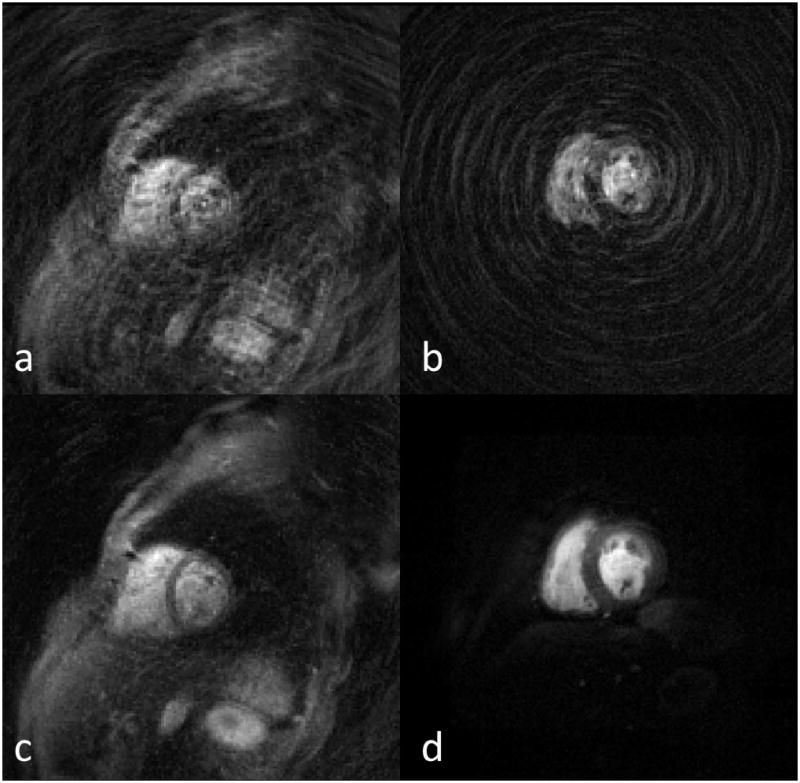
Full FOV of 340mm without OVS (a, c) and rFOV of 170mm with OVS (b, d) shown in 340 mm FOV perfusion images. Top row shows the directly gridding images with zero padding from the under-sampled data. Bottom row shows the BLOSM reconstructed images.
Figure 6 (a) illustrates the high image quality and whole-ventricle spatial coverage of the single-shot spiral pulse sequence with OVS at a middle time frame during first pass from one subject. The images demonstrate high SNR and image quality with minimal residual aliasing outside the heart region. Figure 6 (b) shows the time-intensity curves of the LV cavity from a mid-ventricular slice and the time-intensity curves from each myocardial segment averaged across slices. The corresponding movie for this subject is included as Supporting Movie 1, which is available online. Of the 16 subjects imaged, 12 of the cases had visually apparent respiratory motion present.
Figure 6.
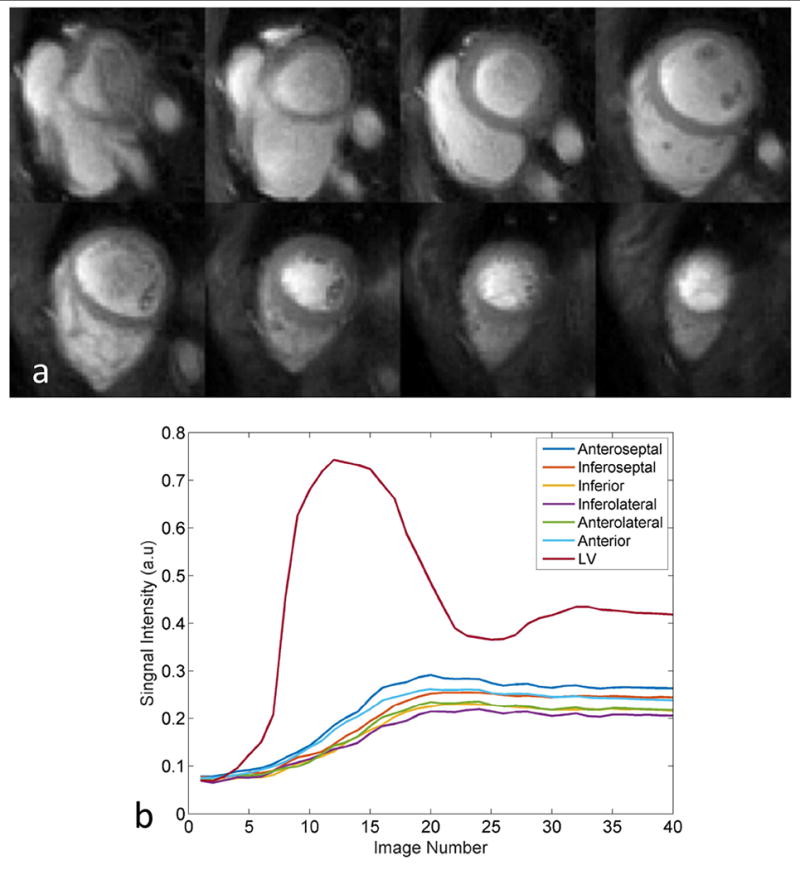
(a) Resting single-shot OVS spiral perfusion images from a clinical subject demonstrate high image quality with whole heart coverage. (b) Time intensity curves from LV cavity of middle ventricular slice and six averaged segments of myocardium.
Figure 7 shows the effect of signal recovery following OVS preparation in a sequence where two slices are acquired per SR preparation. The basal slices which are sampled immediately after the OVS preparation have nearly complete suppression of the outer-volume, whereas images acquired later after the preparation have some recovery of signal. This minimal recovery of signal does not significantly impact image reconstruction quality.
Figure 7.
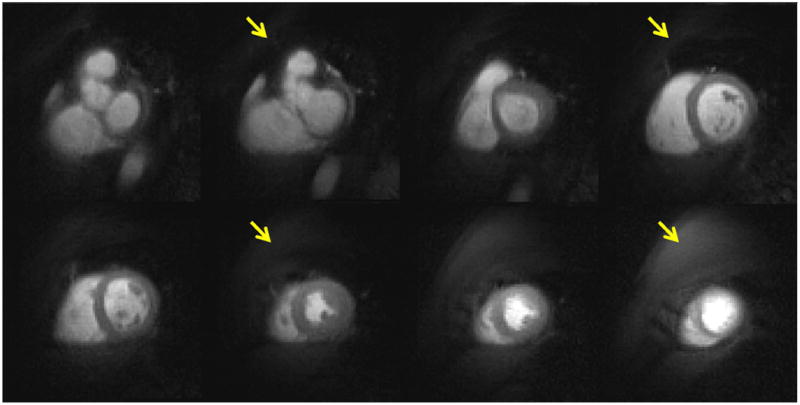
Example perfusion images of rFOV to show the different OVS performance of two slices acquired in one SR preparation. Top row images are sampled immediately after the OVS, and bottom row images are acquired after 10 ms of OVS.
Figure 8 shows resting rFOV single-shot spiral perfusion images covering the whole heart from a patient with known CAD. A subendocardial perfusion defect in the anterior and lateral walls corresponded to a region of sub-endocardial myocardial infarction on LGE images. The first-pass perfusion movie for this patient is included as Supporting Movies 2 in the online Supporting Information. Given the temporal footprint of 8 ms, fine details of the cardiac trabeculations and papillary muscles are evident which are typically not well visualized with other perfusion techniques due to temporal blurring. Four of the patients demonstrated resting perfusion defects which corresponded to regions of scar on LGE imaging.
Figure 8.
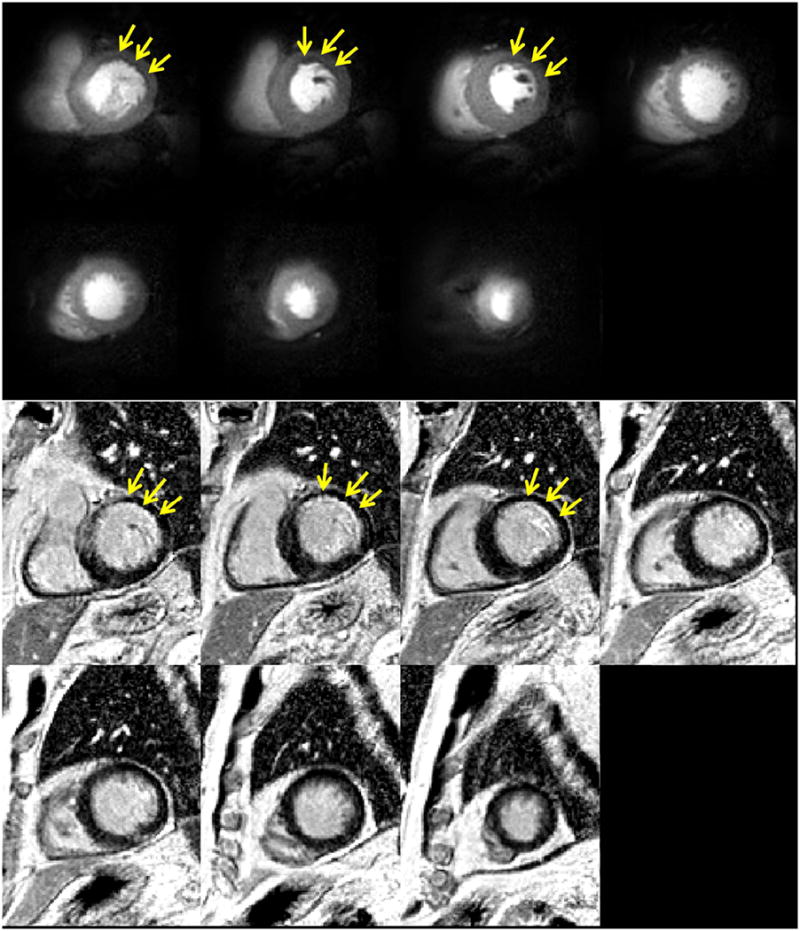
rFOV(170mm) single-shot perfusion and positive LGE images of a CAD patient.
Average image quality scores (1-excellent, 5-poor) from full FOV cases (N =8) and rFOV cases (N =8) were 3.1 ± 0.64 and 2.3 ± 0.46 (p = 0.02) from cardiologist 1, and 2.5 ± 0.54 and 1.8 ± 0.47 (p = 0.04) from cardiologist 2. Both cardiologists favored the rFOV image quality as compared to the full FOV images.
Discussion
In this study, reduced FOV spiral perfusion imaging with whole-heart coverage is achieved by fast 2D OVS preparation combined with a rapid accelerated single-shot spiral pulse sequence resulting in a temporal footprint of <10ms per slice acquisition. By using an OVS preparation, the signal outside of the desired FOV is significantly attenuated, resulting in reduced aliasing artifacts for the highly-under sampled spiral trajectory. This reduction in aliasing energy significantly improves the BLOSM reconstruction resulting in images of high image quality. The motion correction afforded by BLOSM enables robust image reconstruction even in the setting of respiratory motion. The rFOV spiral perfusion images had higher image quality then the data sets acquired with the full FOV. The circular FOV supported by the spiral tip-back pulse is ideal for spiral acquisition as it provides attenuation of all signal outside of the desired circular FOV.
The rFOV performance is dominated by the OVS module. In our design, an adiabatic BIR4 pulse was used to tip-down all spins first and a 2D spiral pulse was applied to tip-back the spins within the ROI. Based on the B0 and B1 simulations, the OVS module is relatively insensitive to the B0 due to the short duration of the tip-back pulse, but the tip-back pulse has some B1 dependence which could result in incomplete tip-back in regions of low B1. Outside of the FOV, there is good suppression of signal which results in minimal aliasing from structures around the heart. Even without complete suppression, attenuation of the signal from outside of the FOV results in significant improvement in image reconstruction. Given the very small temporal footprint of the single-shot spiral readout, multiple slices can easily be acquired following each saturation pulse. The OVS signal recovers with T1 and thus rapid data acquisition is required to ensure the signal outside of the desired FOV has not significantly recovered during readout. Practically, we have acquired 2-4 slices following each saturation and OVS preparation with excellent results.
The single-shot spiral acquisition combined with OVS can acquire a perfusion image data in under 10 ms per slice at a resolution of 2mm, which is higher than typically used clinically. The SNR loss of the single readout and thus shorter total data acquisition time as compared to multi-shot spirals is balanced by the utilization of a single 90 degree excitation per slice. With this sequence design, if 4 slices are imaged per SR block (Supporting Figure 2 and Movie 3), and two SR blocks are used, 8 slices can be acquired in acquired in 240 ms, which is in the range of the temporal footprint of 3D acquisition techniques, but with minimal artifact or blurring due to cardiac motion. This technique could enable whole-heart short-axis coverage even in patients with rapid heart rates such as during exercise, during dobutamine stress, or patients in atrial fibrillation. The high sampling efficiency and the flexibility to control the density of k-space sampling makes spiral trajectories uniquely suited to single-shot image acquisition which has not been achieved for CMR perfusion imaging with any other sampling strategies to date. Collecting the data on a single-spiral interleaf eliminates any potential artifacts which could result from changes in signal intensity or cardiac position between interleaves, and the center of k-space is acquired at a single well-defined SR time.
Perfusion images at two slice locations were acquired after the OVS module within each SR preparation in this study. The first slice was sampled immediately after the OVS resulting in completely suppressed signal outside the ROI. However, the second slice was acquired 10 ms after the OVS module and the magnetization outside the ROI will have recovered a small amount based on the T1 of the surrounding tissues. While long T1 species do not recover significantly over 10 ms, short T1 tissues such as fat the recovery would be about 5% of the total magnetization. This could be optimized by using a tip-down and tip-back pulse greater than 90° to achieve partial inversion in the outer-volume. This should have minimal effect on the signal within the rFOV.
This study has some limitations. As most of the prospective studies were acquired during a routine clinical examination, we were only able to obtain resting perfusion images with a single pulse sequence precluding the direct comparison of full FOV and rFOV pulse sequences in the same subject and for the same reason, only rest perfusion images could be obtained. However, it does provide a real-world evaluation of the performance of the accelerated-spiral approach in patients with heart disease. Resting perfusion images demonstrate both feasibility of the technique and high image quality. We did not compare different CS reconstruction methods, but BLOSM has previously been demonstrated to be a robust motion compensated CS method21.
Conclusion
We have demonstrated the feasibility of a single-shot spiral perfusion sequence which utilizes OVS and BLOSM CS reconstruction to achieve whole heart perfusion with a very short temporal footprint at any clinically relevant heart rate. Future clinical validation studies in patients with known CAD at rest and adenosine stress will be essential to further assess and optimize performance of these sequences.
Supplementary Material
Supporting Figure 1: Bloch equation simulation of the pulse sequence using SPAIR as fat suppression. To better show the water spin signal evolution with or without OVS, slightly different T1 values are chosen. The SPAIR pulse only inverts fat spins and has no effect of water spins. The fat suppression waiting time is selected to null the fat signal during image acquisition.
Supporting Figure 2: Example middle time frame perfusion images to show OVS performance of 4 slice per SR block from a clinical patient. From left to right, representing the imaging acquisition order after OVS. Dynamic movie of this case can be found in Supporting Movie 3.
Supporting Movie 1: Example first-pass perfusion images with single-shot OVS with whole heart coverage.
Supporting Movie 2: Example resting rFOV single-shot spiral perfusion images covering the whole heart from a patient with known CAD. This patient has subendocardial perfusion defect in the anterior and lateral walls.
Supporting Movie 3: rFOV single-shot spiral perfusion images with 4 slices within one SR block.
Table 2.
Image quality graded by two cardiologists (1-excellent; 5-poor)
| Full FOV (N=8) | rFOV (N=8) | |
|---|---|---|
| Cardiologist 1 | 3.1 ± 0.64 | 2.3 ± 0.46* |
| Cardiologist 2 | 2.5 ± 0.54 | 1.8 ± 0.47* |
p < 0.05
Acknowledgments
Funding Sources: NIH K23 HL112910, 5T32EB003841, NIH R01 HL079110, NIH R01 EB001763, NIH R01 HL131919, Siemens Medical Solutions
References
- 1.Mozaffarian D, Benjamin EJ, Go AS, Arnett DK, Blaha MJ, Cushman M, Das SR, de Ferranti S, Despres JP, Fullerton HJ, et al. Heart Disease and Stroke Statistics-2016 Update: A Report From the American Heart Association. Circulation. 2016;133(4):e38–e360. doi: 10.1161/CIR.0000000000000350. [DOI] [PubMed] [Google Scholar]
- 2.Salerno M, Beller GA. Noninvasive Assessment of Myocardial Perfusion. Circulation-Cardiovascular Imaging. 2009;2(5):412–424. doi: 10.1161/CIRCIMAGING.109.854893. [DOI] [PubMed] [Google Scholar]
- 3.Greenwood JP, Maredia N, Younger JF, Brown JM, Nixon J, Everett CC, Bijsterveld P, Ridgway JP, Radjenovic A, Dickinson CJ, et al. Cardiovascular magnetic resonance and single-photon emission computed tomography for diagnosis of coronary heart disease (CE-MARC): a prospective trial. Lancet. 2012;379(9814):453–460. doi: 10.1016/S0140-6736(11)61335-4. [DOI] [PMC free article] [PubMed] [Google Scholar]
- 4.Lipinski MJ, McVey CM, Berger JS, Kramer CM, Salerno M. Prognostic value of stress cardiac magnetic resonance imaging in patients with known or suspected coronary artery disease: a systematic review and meta-analysis. J Am Coll Cardiol. 2013;62(9):826–38. doi: 10.1016/j.jacc.2013.03.080. [DOI] [PMC free article] [PubMed] [Google Scholar]
- 5.Jaarsma C, Leiner T, Bekkers SC, Crijns HJ, Wildberger JE, Nagel E, Nelemans PJ, Schalla S. Diagnostic Performance of Noninvasive Myocardial Perfusion Imaging Using Single-Photon Emission Computed Tomography, Cardiac Magnetic Resonance, and Positron Emission Tomography Imaging for the Detection of Obstructive Coronary Artery Disease A Meta-Analysis. Journal of the American College of Cardiology. 2012;59(19):1719–1728. doi: 10.1016/j.jacc.2011.12.040. [DOI] [PubMed] [Google Scholar]
- 6.Di Bella EV, Parker DL, Sinusas AJ. On the dark rim artifact in dynamic contrast-enhanced MRI myocardial perfusion studies. Magn Reson Med. 2005;54(5):1295–9. doi: 10.1002/mrm.20666. [DOI] [PMC free article] [PubMed] [Google Scholar]
- 7.Manka R, Paetsch I, Kozerke S, Moccetti M, Hoffmann R, Schroeder J, Reith S, Schnackenburg B, Gaemperli O, Wissmann L, et al. Whole-heart dynamic three-dimensional magnetic resonance perfusion imaging for the detection of coronary artery disease defined by fractional flow reserve: determination of volumetric myocardial ischaemic burden and coronary lesion location. Eur Heart J. 2012;33(16):2016–24. doi: 10.1093/eurheartj/ehs170. [DOI] [PubMed] [Google Scholar]
- 8.Manka R, Wissmann L, Gebker R, Jogiya R, Motwani M, Frick M, Reinartz S, Schnackenburg B, Niemann M, Gotschy A, et al. Multicenter Evaluation of Dynamic Three-Dimensional Magnetic Resonance Myocardial Perfusion Imaging for the Detection of Coronary Artery Disease Defined by Fractional Flow Reserve. Circulation-Cardiovascular Imaging. 2015;8(5) doi: 10.1161/CIRCIMAGING.114.003061. [DOI] [PubMed] [Google Scholar]
- 9.Jogiya R, Kozerke S, Morton G, De Silva K, Redwood S, Perera D, Nagel E, Plein S. Validation of dynamic 3-dimensional whole heart magnetic resonance myocardial perfusion imaging against fractional flow reserve for the detection of significant coronary artery disease. J Am Coll Cardiol. 2012;60(8):756–65. doi: 10.1016/j.jacc.2012.02.075. [DOI] [PubMed] [Google Scholar]
- 10.Fair MJ, Gatehouse PD, DiBella EV, Firmin DN. A review of 3D first-pass, whole-heart, myocardial perfusion cardiovascular magnetic resonance. J Cardiovasc Magn Reson. 2015;17:68. doi: 10.1186/s12968-015-0162-9. [DOI] [PMC free article] [PubMed] [Google Scholar]
- 11.Salerno M, Sica C, Kramer CM, Meyer CH. Improved first-pass spiral myocardial perfusion imaging with variable density trajectories. Magn Reson Med. 2013;70(5):1369–79. doi: 10.1002/mrm.24569. [DOI] [PMC free article] [PubMed] [Google Scholar]
- 12.Salerno M, Sica CT, Kramer CM, Meyer CH. Optimization of spiral-based pulse sequences for first-pass myocardial perfusion imaging. Magn Reson Med. 2011;65(6):1602–10. doi: 10.1002/mrm.22746. [DOI] [PMC free article] [PubMed] [Google Scholar]
- 13.Salerno M, Taylor A, Yang Y, Kuruvilla S, Ragosta M, Meyer CH, Kramer CM. Adenosine stress cardiovascular magnetic resonance with variable-density spiral pulse sequences accurately detects coronary artery disease: initial clinical evaluation. Circ Cardiovasc Imaging. 2014;7(4):639–46. doi: 10.1161/CIRCIMAGING.113.001584. [DOI] [PMC free article] [PubMed] [Google Scholar]
- 14.Yang Y, Kramer CM, Shaw PW, Meyer CH, Salerno M. First-pass myocardial perfusion imaging with whole-heart coverage using L1-SPIRiT accelerated variable density spiral trajectories. Magn Reson Med. 2015 doi: 10.1002/mrm.26014. [DOI] [PMC free article] [PubMed] [Google Scholar]
- 15.Smith TB, Nayak KS. Reduced field of view MRI with rapid, B1-robust outer volume suppression. Magn Reson Med. 2012;67(5):1316–23. doi: 10.1002/mrm.23116. [DOI] [PubMed] [Google Scholar]
- 16.Luo J, Addy NO, Ingle RR, Hargreaves BA, Hu BS, Nishimura DG, Shin T. Combined outer volume suppression and T preparation sequence for coronary angiography. Magn Reson Med. 2014 doi: 10.1002/mrm.25575. [DOI] [PMC free article] [PubMed] [Google Scholar]
- 17.Menon RG, Miller GW, Jeudy J, Rajagopalan S, Shin T. Free breathing three-dimensional late gadolinium enhancement cardiovascular magnetic resonance using outer volume suppressed projection navigators. Magn Reson Med. 2016 doi: 10.1002/mrm.26234. [DOI] [PMC free article] [PubMed] [Google Scholar]
- 18.Tsai CM, Nishimura DG. Reduced aliasing artifacts using variable-density k-space sampling trajectories. Magnetic Resonance in Medicine. 2000;43(3):452–458. doi: 10.1002/(sici)1522-2594(200003)43:3<452::aid-mrm18>3.0.co;2-b. [DOI] [PubMed] [Google Scholar]
- 19.Pauly J, Nishimura D, Macovski A. A k-space analysis of small-tip-angle excitation. 1989. J Magn Reson. 2011;213(2):544–57. doi: 10.1016/j.jmr.2011.09.023. [DOI] [PubMed] [Google Scholar]
- 20.Staewen RS, Johnson AJ, Ross BD, Parrish T, Merkle H, Garwood M. 3-D FLASH imaging using a single surface coil and a new adiabatic pulse, BIR-4. Invest Radiol. 1990;25(5):559–67. doi: 10.1097/00004424-199005000-00015. [DOI] [PubMed] [Google Scholar]
- 21.Chen X, Salerno M, Yang Y, Epstein FH. Motion-compensated compressed sensing for dynamic contrast-enhanced MRI using regional spatiotemporal sparsity and region tracking: block low-rank sparsity with motion-guidance (BLOSM) Magn Reson Med. 2014;72(4):1028–38. doi: 10.1002/mrm.25018. [DOI] [PMC free article] [PubMed] [Google Scholar]
- 22.Pruessmann KP, Weiger M, Scheidegger MB, Boesiger P. SENSE: sensitivity encoding for fast MRI. Magn Reson Med. 1999;42(5):952–62. [PubMed] [Google Scholar]
- 23.Walsh DO, Gmitro AF, Marcellin MW. Adaptive reconstruction of phased array MR imagery. Magnetic Resonance in Medicine. 2000;43(5):682–690. doi: 10.1002/(sici)1522-2594(200005)43:5<682::aid-mrm10>3.0.co;2-g. [DOI] [PubMed] [Google Scholar]
- 24.Combettes PL, Wajs VR. Signal recovery by proximal forward-backward splitting. Multiscale Modeling & Simulation. 2005;4(4):1168–1200. [Google Scholar]
Associated Data
This section collects any data citations, data availability statements, or supplementary materials included in this article.
Supplementary Materials
Supporting Figure 1: Bloch equation simulation of the pulse sequence using SPAIR as fat suppression. To better show the water spin signal evolution with or without OVS, slightly different T1 values are chosen. The SPAIR pulse only inverts fat spins and has no effect of water spins. The fat suppression waiting time is selected to null the fat signal during image acquisition.
Supporting Figure 2: Example middle time frame perfusion images to show OVS performance of 4 slice per SR block from a clinical patient. From left to right, representing the imaging acquisition order after OVS. Dynamic movie of this case can be found in Supporting Movie 3.
Supporting Movie 1: Example first-pass perfusion images with single-shot OVS with whole heart coverage.
Supporting Movie 2: Example resting rFOV single-shot spiral perfusion images covering the whole heart from a patient with known CAD. This patient has subendocardial perfusion defect in the anterior and lateral walls.
Supporting Movie 3: rFOV single-shot spiral perfusion images with 4 slices within one SR block.


