

Abstract
Previous investigations of sequence-specific DNA binding by model minor groove-binding compounds showed that the ligand/DNA complex was destabilized in the presence of compatible co-solutes. Inhibition was interpreted in terms of osmotic stress theory as the uptake of significant numbers of excess water molecules from bulk solvent upon complex formation. Here, we interrogated the AT-specific DNA complex formed with the symmetric heterocyclic diamidine DB1976 as a model for minor groove DNA recognition using both ionic (NaCl) and non-ionic cosolutes (ethylene glycol, glycine betaine, maltose, nicotinamide, urea). While the non-ionic cosolutes all destabilized the ligand/DNA complex, their quantitative effects were heterogeneous in a cosolute- and salt-dependent manner. Perturbation with NaCl in the absence of non-ionic cosolute showed that preferential hydration water was released upon formation of the DB1976/DNA complex. As salt probes counter-ion release from charged groups such as the DNA backbone, we propose that preferential hydration uptake in DB1976/DNA binding observed in the presence of osmolytes reflects the exchange of preferentially bound cosolute with hydration water in the environs of the bound DNA, rather than a net uptake of hydration waters by the complex.
Keywords: Osmotic pressure, drug/DNA interactions, co-solute, heterocyclic dications, molecular hydration, Wyman linkages
Graphical abstract
INTRODUCTION
Drug-DNA complexes represent attractive model systems for the biophysical investigations of molecular hydration. For minor-groove binding compounds, the network of structured hydration waters observed in narrow AT-rich regions of DNA [1, 2] indicates that the displacement of these well-ordered water molecules should comprise a major favorable entropic contribution that drives drug/DNA association [3–5]. However, solution studies have found that compatible cosolutes destabilized the DNA-bound states of these compounds, and attributed this destabilization to the net uptake of hydration upon binding [6–9]. In addition, co-crystal structures of classic minor groove compounds such as 4′,6-diamidino-2-phenylindole (DAPI), netropsin, pentamidine, and Hoescht 33258 show ordered water molecules mediating contacts between terminal cationic N of the compounds and DNA [10–12]. Prompted by the prominent and well-conserved role of water-mediated contacts with cationic N of minor groove compounds, we became interested in the electrostatic and hydration properties of heterocyclic dications, which represent one major class of minor groove-binding compounds. Here, we addressed this question using the sequence-specific interactions of such a dication, DB1976, with an AT-rich target. Specific interest in heterocyclic diamidines is also inspired by independent research demonstrating the potential of DB1976 and several analogs in inhibiting transcription factors that share similar DNA site selectivity [13–15].
Using a chemically diverse set of compatible non-ionic co-solutes (osmolytes), we probed the hydration energetics of site-specific DB1976 binding as a function of bulk osmolyte and salt concentrations. While all the osmolytes tested destabilized DB1976 binding, their quantitative effects were heterogeneous and in some cases indicated coupled osmolyte interactions in a salt-dependent manner. Taking advantage of the intrinsically high affinity of DB1976 for its DNA target, and its meek dependence on salt concentrations, we showed, using NaCl to high concentrations without osmolyte, that DNA binding was in fact coupled with water release. Substitution of H2O with D2O resulted in a stronger interaction, but did not otherwise alter the dependence of the binding affinity on Na+ concentrations. Finally, all-atom molecular simulations of free and bound DB1976 and DNA in the absence of osmolytes showed a deficit of ~60 water contacts in the complex relative to the unbound states. Taken together, the results indicate that salt and osmolytes probe disparate surfaces of the compound and DNA, and suggest that the peculiar uptake of preferential hydration in the presence of osmolytes reflect the thermodynamic exchange of preferentially bound cosolute around the compound with hydration water upon compound/DNA binding, rather than an actual increase in hydration of the complex.
MATERIALS AND METHODS
Nucleic acids and compounds
A synthetic 23-nt DNA oligo harboring the sequence 5′-GCGAATAAGAGGAAGTGAAACCG-3′ and its complement were purchased from Integrated DNA Technologies (Coralville, IA) and annealed at a 1:1 molar ratio. The synthesis and characterization of DB1976, an AT-specific DNA-binding heterocyclic diamidine, has been previously described [13]. Stock solutions (1 mM) of the compound (as the diamidinium HCl salt) were prepared in water and stored at −20 °C in the dark. Salts and co-solutes were purchased at the highest available grade and used without further purification.
Osmometry
Solution osmolality was directly measured by freezing-point depression osmometry using an Osmomat 3000 instrument (Gonotech, Germany). The osmometer was routinely calibrated prior to measurement with commercial NaCl standards (Advanced Instruments, Norward, MA) bracketing the range of interest.
Fluorescence polarization titrations
Apparent binding affinity of DB1976 for the DNA target was measured under ambient conditions using a PerkinElmer LS-55 fluorescence spectrometer essentially as described [14]. In brief, DB1976 (ex/em = 365/445 nm) was titrated at up to 10 nM with duplex DNA in 10 mM TrisHCl, pH 7.5, containing NaCl and co-solute as indicated in the text. The titration schedule was designed such that the total volume increment did not exceed 5% of the initial volume (2.25 mL). After each addition of DNA, samples were mixed and excited at 365 nm. Steady-state fluorescence intensities parallel and perpendicular to the incident light were aqcuired at 445 nm. Parallel and perpendicular counts were converted to anisotropy values with adjustment by a grating factor determined by the instrument. Background parallel and perpendicular intensities of a buffer-only control were subtracted from the emisison counts prior to calculation of anisotropy. Measurements were acquired with an integration time of 1800 s and excitation/emission slit widths of 15/20 nm, and taken as averages of five consecutive measurements. Dissociation constants of the compound-DNA complexes were estimated ± S.E. by fitting observed anisotropies as a function of total DNA concentration to a 1:1 model as previously described [14]. Where possible, titration data from related experiments are fitted simultaneously with shared parameters (such as the free and bound anisotropies) as warranted.
Thermal melting experiments
Duplex DNA was monitored by UV absorption at 260 nm from 25 to 95 °C at 1 °C/min in a Cary 300 Bio UV-vis spectrophotometer. Each sample contained 1.4 μM duplex (~0.5 OD260 in 1 cm) in 10 mM NaH2PO4/Na2HPO4, pH 7.5, containing NaCl and osmolytes as indicated in the text. The melting data was fitted with a standard bimolecular two-state transition. Nicotinamide-containing (0.778 M) samples were measured by differential scanning calorimetry from 10 to 100 °C at 45 °C/h using a MicroCal VP-DSC instrument (Malvern). After buffer and baseline subtraction, melting temperatures were taken at the maximal heat capacity signal.
Docking and molecular dynamics simulations
The initial DNA structure was generated from NAB using the DNA sequence used in the experiments. DB1976 was created using Gaussian 09; geometry optimization and single point energy calculations were done using Hartree-Fock/6-31G*. Parameterization of DB1976 was done following the RESP method to fit the partial charges from Gaussian to the compound, while the remaining parameters were described using GAFF2 in Antechamber from AmberTools16 [16, 17]. The compound was then docked into the DNA at the minor groove binding site (5′-AATAA/TTATT-3′) by Autodock Vina over 100 iterations, and the lowest scoring conformation selected to produce the complex [18]. A total of three systems were constructed: the DB1976/DNA complex, the corresponding unbound DNA sequence, and the unbound DB1976. Each system was solvated in an octahedral box of TIP3 waters with a minimum of 10.0 Å from any edge of the box to the solute. Counter ions were added to neutralize the system, and excess NaCl added to bring the salt concentration to 0.15 M. The modified OL15 forcefield was used for the DNA, and GAFF2 for DB1976 [19]. All subsequent molecular dynamics were done using Amber16. The particle mesh Ewald (PME) method was used to treat long-range electrostatic interactions, with a cutoff for non-bonded interactions as 10 Å [20]. SHAKE was used to constrain all bonds involving hydrogen atoms. Each system was first minimized for 5,000 steps of steepest descent and 2,500 steps of conjugate gradient with restraints (500 kcal/mol Å2) placed on the solute. Afterwards, restraints were removed and the systems minimized for an additional 7,500 steps of steepest descent and 5,000 conjugate gradient. The systems were then heated to 300K over 100 ps in the NVT ensemble using the Langevin thermostat with restraints on the solute (100 kcal/mol Å2). A timestep of 1 fs was used for both heating and initial equilibration. Afterwards, the restraints were relaxed iteratively (−25 kcal/mol Å2) over multiple steps using the NPT ensemble for a total of 5 ns. Subsequent production runs were performed by the CUDA implementation of Amber16 for 100 ns with a 2 fs timestep, saving frames every 4 ps. The resulting trajectories were analyzed using cpptraj from AmberTools16.
RESULTS
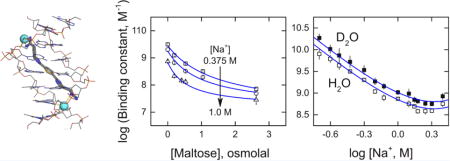
The minor groove-binding compound DB1976 is a symmetric diamidine bearing a selenophene-bis(benzimidazole) scaffold [Figure 1A]. The benzimidazole units are designed to hydrogen-bond with pyrimidine O2 and purine N3 of the DNA, as in the case of DAPI, while the 5-membered selenophene provides an isohelical curvature favorable for minor groove binding. Typical of diamidines of this type, DB1976 is a strongly AT-selective ligand. Like other minor groove compounds, co-crystal structures of designed heterocyclic diamidines consistently show structured water-mediated contacts with charged or polar groups of the DNA target [21, 22]. We were therefore interested in whether this hydration could be detected in sequence-specific DNA recognition by DB1976 in solution [Figure 1B]. Our target sequence is a cognate DNA site for the transcription factor PU.1 that harbors a contiguous 5-bp AT-track. We have previously shown by DNA footprinting that this sequence binds a single equivalent of DB1976 as well as several of its analogues [13, 14].
Figure 1. DB1976 is a symmetric, heterocyclic dication that recognizes A/T-rich regions of duplex DNA.

A, Structure of DB1976 in its expected ionization state at pH 7.4. B, Energy-minimized docked structure of dicationic DB1976 in complex with a 23-bp DNA oligomer harboring the sequence 5′-GCGAATAAGAGGAAGTG-3′ (compound binding)
Experimentally, we used the blue fluorescence of heterocyclic diamidines such as DB1976 as a convenient intrinsic spectroscopic probe for measuring DNA binding. We have previously established that the large increase in polarization upon binding by even small DNA oligos afforded ~10-fold superior sensitivity to binding relative to total intensity [14]. Given the high intrinsic affinity of DB1976 for AT-rich DNA, we used the lowest probe concentration possible to minimize the effects of ligand depletion on the titration curves. At 10−9 M DB1976, we were able to determine dissociation constants down to KD ~10−10 M and up to ~10−6 M (limited by DNA consumption), affording 4 decades of range with which to probe the effects of solution conditions on DB1976/DNA binding.
Non-ionic cosolutes inhibit DNA binding by DB1976 heterogeneously in a cosolute-dependent manner
The use of compatible, non-ionic cosolutes (osmolytes) is an established method for probing preferential interactions associated with biomolecular interactions or transitions. The simplest analysis, known as osmotic stress, interprets the effect of osmolytes on the equilibrium constant in terms of their effects on osmotic pressure [23]. When expressed in terms of osmolality:
| (1) |
where 55.5 is the molal volume of pure water and Δvw is the preferential hydration change between the bound and free states. With the binding constant (−log KD) taken as the equilibrium constant, and assuming complete exclusion of the osmolyte from the compound and DNA [24, 25], positive values of Δvw are formally interpreted as preferential uptake of hydration water and negative values as net release. Initially, we used three chemically diverse cosolutes, namely ethylene glycol, betaine, and maltose, to perturb DNA binding by DB1976 at 25°C. Additionally, to examine the extent to which osmolyte action might interact and be distinguished from ionic perturbations, we tracked the binding affinity over a range of NaCl concentrations from 0.15 to 1.0 M [Figures 2A to 2I, Table 1].
Figure 2. Binding of DB1976 to DNA responds to osmotic pressure in a heterogeneous manner using chemically distinct osmolytes.
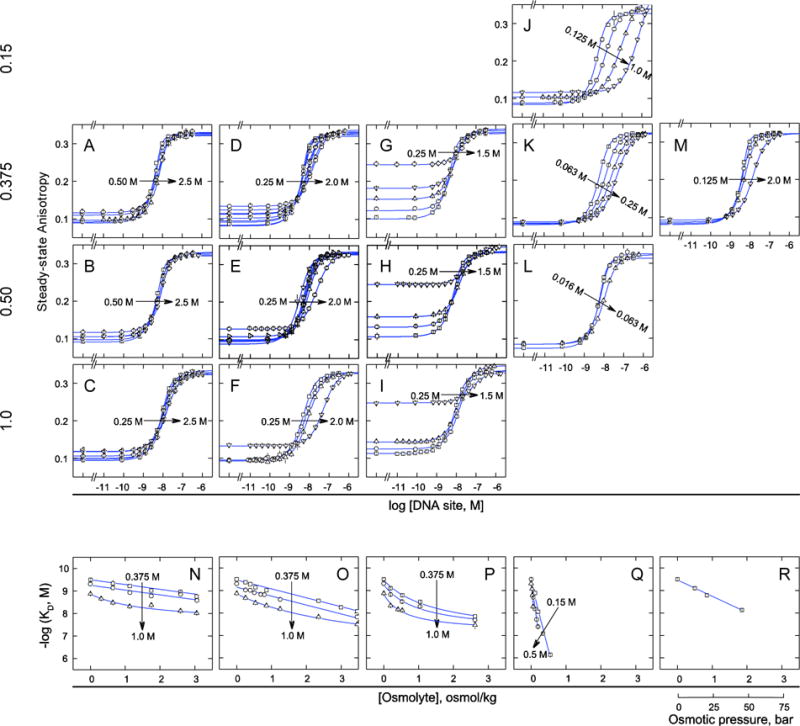
A to M, Fluorescence polarization titrations of DB1976 with DNA sites in the presence of graded concentrations of osmolytes and fixed NaCl concentrations as indicated by the arrows. Parametric values of apparent equilibrium dissociation constants are given in Table 1. Changes in pre- and post-transition baselines were observed in some cases (particularly with maltose) due to viscosity and other physicochemical effects on fluorescence polarization. N to R, Summary of DB1976/DNA binding affinities as a function of osmolyte concentration in osmolal units. Lines represent linear least-square fits to the data; curves are splines to guide the eye only. Fitted and limiting slopes are given in Table S1 (Supplemental Information).
Table 1. Inhibition of DB1976/DNA binding by osmolytes.
DB1976 was titrated with target duplex DNA oligo at 25°C in the presence of NaCl and/or osmolytes at concentrations as indicated. Binding was measured by fluorescence polarization and fitted to a 1:1 model. Equilibrium dissociation constants (KD) were expressed as the logarithm of the binding constants ± S.E.
| [NaCl], M | −log (KD, M) No osmolyte | [EG], osmolal | −log (KD, M) | [Betaine], osmolal | −log (KD, M) | [Maltose], osmolal | −log (KD, M) | [Nicotinamide], osmolal | −log (Kd, M) | [Urea], osmolal | −log (KD, M) |
|---|---|---|---|---|---|---|---|---|---|---|---|
| 0.109 | 8.89 ± 0.11 | ||||||||||
| 0.195 | 8.06 ± 0.04 | ||||||||||
| 0.15 | N.D.a | 0.340 | 7.08 ± 0.01 | ||||||||
| 0.551 | 6.13 ± 0.03 | ||||||||||
|
| |||||||||||
| 0.646 | 9.33 ± 0.15 | 0.253 | 9.36 ± 0.08 | 0.194 | 9.09 ± 0.02 | 0.057 | 8.70 ± 0.01 | 0.502 | 9.10 ± 0.03 | ||
| 1.13 | 9.22 ± 0.08 | 0.394 | 9.28 ± 0.08 | 0.528 | 8.79 ± 0.02 | 0.109 | 8.18 ± 0.01 | 0.842 | 8.78 ± 0.03 | ||
| 1.75 | 9.01 ± 0.10 | 0.539 | 9.14 ± 0.07 | 1.04 | 8.50 ± 0.02 | 0.154 | 7.71 ± 0.01 | 1.85 | 8.13 ± 0.01 | ||
| 0.375 | 9.50 ± 0.01 | 2.59 | 8.96 ± 0.02 | 0.856 | 9.01 ± 0.06 | 1.81 | 8.44 ± 0.03 | 0.195 | 7.39 ± 0.01 | ||
| 3.06 | 8.75 ± 0.11 | 2.35 | 8.54 ± 0.05 | ||||||||
| 2.99 | 8.25 ± 0.06 | ||||||||||
| 3.46 | 8.07 ± 0.05 | ||||||||||
|
| |||||||||||
| 0.646 | 9.14 ± 0.09 | 0.253 | 9.02 ± 0.05 | 0.194 | 8.82 ± 0.02 | 0.027 | 9.07 ± 0.03 | ||||
| 1.13 | 8.93 ± 0.10 | 0.394 | 9.00 ± 0.07 | 0.528 | 8.51 ± 0.02 | 0.030 | 8.79 ± 0.02 | ||||
| 1.75 | 8.78 ± 0.06 | 0.510 | 8.90 ± 0.06 | 1.04 | 8.29 ± 0.02 | 0.057 | 8.28 ± 0.02 | ||||
| 0.5 | 9.30 ± 0.03 | 2.59 | 8.85 ± 0.08 | 0.695 | 8.83 ± 0.04 | ||||||
| 3.06 | 8.58 ± 0.09 | 0.791 | 8.80 ± 0.04 | ||||||||
| 1.25 | 8.60 ± 0.04 | ||||||||||
| 3.46 | 7.82 ± 0.03 | ||||||||||
|
| |||||||||||
| 0.313 | 8.66 ± 0.04 | 0.253 | 8.66 ± 0.03 | 0.194 | 8.33 ± 0.03 | ||||||
| 0.646 | 8.48 ± 0.04 | 0.539 | 8.45 ± 0.02 | 0.411 | 8.16 ± 0.02 | ||||||
| 1.0 | 8.87 ± 0.01 | 1.13 | 8.31 ± 0.04 | 0.856 | 8.32 ± 0.03 | 0.528 | 8.11 ± 0.03 | ||||
| 1.75 | 8.36 ± 0.06 | 1.25 | 8.18 ± 0.03 | ||||||||
| 2.59 | 8.12 ± 0.04 | 2.35 | 7.83 ± 0.04 | ||||||||
| 3.06 | 8.02 ± 0.02 | 3.46 | 7.49 ± 0.02 | ||||||||
Not determined: binding was too tight to determine in the absence of osmolyte.
In all cases, we observed that the osmolytes inhibited DB1976/DNA binding. When cast as a function of osmolality of the osmolyte, the gradients of the DB1976/DNA binding affinity were linear for ethylene glycol and betaine at 0.375 M and 0.5 M Na+ out to high osmotic pressure (>2 osmolal), with slopes that were independent of salt concentrations. Application of Eq. (1) gave Δvw of +27 ± 1 for ethylene glycol and +51 ± 1 for betaine. The presence of 1.0 M salt induced significant concave up curvature for both osmolytes [Figures 2N and 2O]. Fitting the curvilinear data with spline lines gave substantially higher limiting values of Δvw at 0 osmolal than the linear slopes at lower NaCl concentrations [Table S1, Supplemental Information]. Similar analysis with the maltose data, which exhibited concave up curvature at all NaCl concentrations tested [Figure 2P], also gave large positive Δvw values relative to ethylene glycol and betaine.
The dependence of the binding affinity gradients on osmolyte identity indicated a breakdown of osmotic stress theory’s assumption of complete osmolyte exclusion. In addition, the appearance of curvilinear gradients suggested changes in preferential binding by osmolytes in DB1976/DNA interactions under those conditions. We therefore considered a more general Wyman linkage that explicitly included the role of coupled osmolyte (L) binding or release:
| (2) |
Upon approximating aL with molality mL, integration of Eq. (2) yields:
| (3) |
Eqs. (2) and (3) return the limiting osmotic stress formulation, Eq. (1), if ΔvL = 0. In the Wyman regime, the coefficients ΔvL and Δvw are coupled indicators of preferential binding and exclusion of osmolytes (the latter equivalent to preferential hydration). If preferentially bound osmolyte is released upon DB1976/DNA binding (ΔvL < 0), Eqs. (2) and (3) show that the binding constant decreases monotonically if no net change (Δvw = 0) or uptake (Δvw > 0) of preferential hydration takes place [Figure 3A]. A release of preferential hydration (Δvw < 0) leads to concavity as the coefficients oppose in the Wyman relation.
Figure 3. Coupled disposition of osmolyte and hydration water in DB1976/DNA binding.
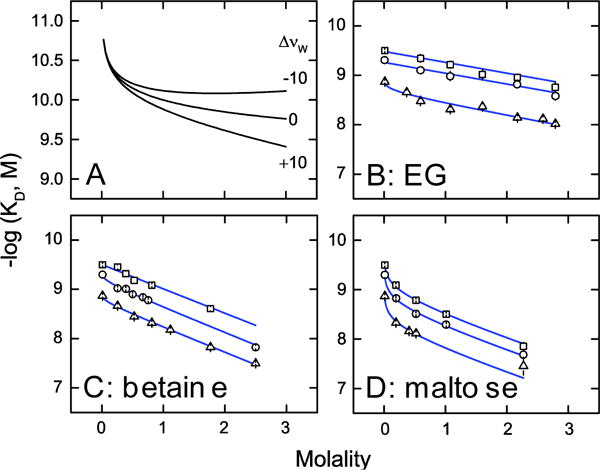
A, Simulation of Eq. (3) to illustrate the Wyman linkage between coupled preferential osmolyte release and hydration changes. Curves represent coupled preferential hydration release (Δvw < −10), uptake (Δvw > 10), or no net disposition (Δvw = 0). For all curves, Δvw = −1 (without including the correction term for salt activity). B to D, The data for ethylene glycol, betaine, and maltose from Figures 2N through 2P is replotted in terms of molality and fitted to Eq. (3). The concentration corresponding to the absence of osmolyte was taken as 0.01
Applicability of Eqs. (2) and (3) to our data requires constant salt activity, but the osmolality gradients of the binding constant were taken at constant NaCl molalities (m±) as osmolyte concentration was varied. To control for salt activity we adopted the approach by Record and coworkers [26], who showed that the molality gradient of the equilibrium constant could be transformed as follows:
| (4) |
where represents a correction term for salt activity. In , (the molar salt dependence of the observed binding constant, vide infra), ΔOsm≡ΔOsm(mL, m±)−Osm(mL)−Osm(m±), and (see [26] and Appendix 1 therein). For the range of osmolyte and salt molalities used in our experiments (c.f. Figure 2), the constituent parameters and variables showed strong mutual compensation such that ϒ(mL, m±) was range-bound at −0.2 ± 0.1 for ethylene glycol and maltose, and 0.2 ± 0.1 for betaine. Negative values of ϒ(mL, m±) reflected suppression of NaCl activity by the osmolyte (ethylene glycol [27] and maltose [28]), while positive values reflected favorable effects on NaCl activity [26]. For the purpose fitting the binding data at constant salt molality, we treated ϒ as a constant for flagging the direction of change in the preferential disposition of osmolyte. Defining Δv′L≡ΔvL−ϒ, Eqs. (2) and (3) become:
| (5) |
where the direction of change in preferential osmolyte disposition occurs at Δv′L = −ϒ.
Global analysis of the DB1976/DNA binding constants as functions of molality by Eq. (5) gave negative values of Δv′L [Figures 3B to D, Table 2]. For ethylene glycol and maltose, Δv′L < −ϒ so fractional osmolyte was preferentially released (in the thermodynamic sense) upon DB1976/DNA binding. For betaine, the similar magnitudes of Δv′L and −ϒ indicated that enhanced NaCl activity accounted for the curvilinear osmolality gradient for betaine at 1 M NaCl. The coupled changes in preferential hydration were Δvw = +28 ± 2, +63 ± 2 and +50 ± 4 waters for ethylene glycol, betaine, and maltose, respectively. The preferential hydration uptake for ethylene glycol was in agreement with the value obtained from only the linear gradients at lower NaCl concentrations (Table S1, Supplemental Information); the overestimate in the case of betaine was expected from approximating activity with molality in Eq. (3).
Table 2. Preferential interaction of osmolytes in DB1976/DNA binding.
Molality gradients of apparent DB1976/DNA binding constants (Figure 3) were globally fitted by a Wyman linkage relation, Eq. (5), to estimate (± S.E.) the coupled changes in the preferential binding of osmolyte (given as Δv′L=ΔvL−ϒ, where ϒ ± 0.1 is a correction term for NaCl activity [26] under the present experimental conditions) and hydration water (Δvw). The value of Av Δv′L was set to 0 for data sets showing linear gradients. Note that the NaCl-activity correction term implies that ΔvL = ϒ when Δv′L = 0.
| [NaCl], M | Ethylene glycol | Betaine | Maltose | |||
|---|---|---|---|---|---|---|
| Δv′L ϒ = −0.2 |
Δvw | Δv′L ϒ = +0.2 |
Δvw | Δv′L ϒ = −0.2 |
Δvw | |
| 0.375 | 0 | 28 ± 2 | 0 | 63 ± 2 | −0.32 ± 0.02 | 50 ± 4 |
| 0.5 | 0 | −0.08 ± 0.04 | ||||
| 1.0 | −0.10 ± 0.01 | −0.07 ± 0.02 | ||||
In addition to ethylene glycol, betaine, and maltose, we evaluated the effect of two other osmolytes on the effect of DB1976/DNA binding, specifically those expected to be strongly perturbative on the compound or DNA. Nicotinamide is a hydrotrope known to interact with and enhance the aqueous solubility of hydrophobic compounds. Inhibition of DB1976/DNA binding by nicotinamide was an order of magnitude stronger than the other three osmolytes [Figures 2J to 2L], but gave linear osmolality gradients at all NaCl concentrations tested [Figure 2Q]. The formal preferential hydration changes were correspondingly large [Table S1, Supporting Information]. We also examined urea which inhibited DB1976/DNA binding at up to 2 M with large preferential hydration uptake (+93 ± 4) and no detectable change in preferential binding [Figures 2M and 2R, Table S1], suggesting that at sub-denaturing concentrations, urea behaves similarly to more “compatible” osmolytes on DB1976/DNA binding.
To ensure that the effects of the cosolutes on DB1976/DNA binding at 25°C were not due to perturbations on DNA conformational stability, and therefore its suitability for minor groove recognition, we characterized the helix-coil transitions of the DNA target by UV absorption under conditions representative of the titrations [Figure 4]. At 1.4 μM (~0.5 OD260 in the absence of osmolyte), the 23-bp duplex DNA target exhibited two-state melting temperatures (Tm) from 66 to 74°C in phosphate buffer (pH 7.4) containing 0.15 to 1 M of NaCl. As nicotinamide absorbed strongly throughout the UV, duplex stability in the presence of this osmolyte was determined by differential scanning calorimetry. The addition of the osmolytes used in the binding experiments to a common total solution osmolality of 1.2 osmolal (consisting of 0.5 to 0.6 m osmolyte) lowered Tm by less than 5°C, except for nicotinamide, which reduced Tm by over 10°C. The distinct effect of nicotinamide suggested stronger interactions with single-stranded DNA. Thus, although osmolytes destabilized the oligo DNA duplex, as expected from known effects of osmolytes on polymeric DNA stability [30], the effect was not sufficient to explain their perturbation of DB1976/DNA binding at 25°C barring extraordinary structural distortions unfavorable for minor groove binding or interactions with the unbound compound.
Figure 4. Perturbation of duplex stability of the DNA target by osmolytes.
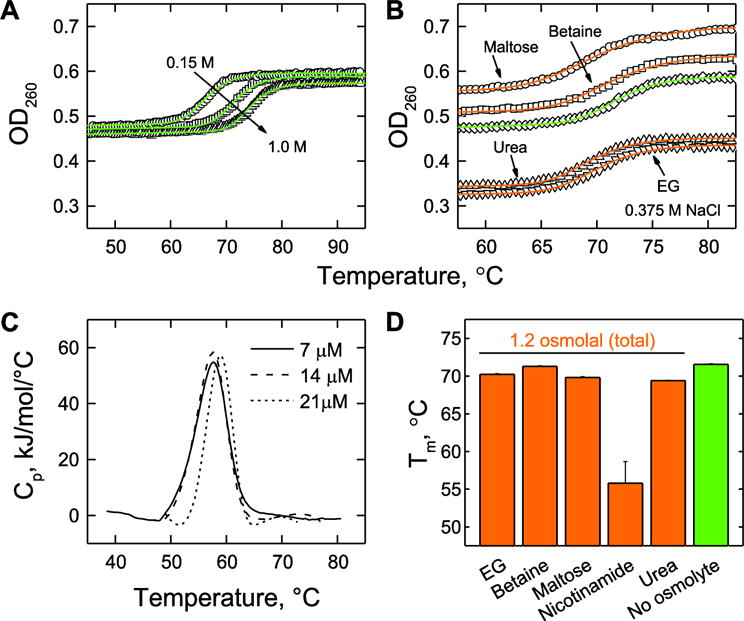
A, Salt-dependence (0.15, 0.375, and 1 M NaCl) of the helix-coil transition as measured by UV thermal melting. B, Effect of EG, betaine, maltose, and urea on DNA duplex stability in the presence of 0.375 M NaCl. Samples containing osmolytes were 1.2 osmolal in total osmolality. The molal concentrations of the osmolytes were 0.52 m (EG), 0.53 m (betaine), 0.45 m (maltose), and 0.63 m (urea). The green curve is without osmolyte. C, DSC thermograms of DNA melting in the presence of 0.69 m nicotinamide and 0.375 M NaCl, corresponding to 1.2 total osmolal. D, Summary of the effects of osmolytes on thermal stability of 1.4 μM duplex DNA. The Tm in nicotinamide was back-extrapolated to 1.4 μM duplex via Tm−1 vs. the logarithm of duplex concentration.
Perturbation of osmotic pressure by NaCl indicates release of hydration water upon DB1976/DNA binding
Since counter-ion release from charged moieties (e.g. DNA backbone phosphate) occurs upon binding whether osmolytes are present or not, we explored the use of NaCl as sole perturbing cosolute. The Wyman linkage for salt and water coupling is [31]:
| (6) |
Ionic perturbation of osmotic pressure is generally not used in hydration changes of interactions involving nucleic acids, particularly with proteins, due to the strongly unfavorable effects that salts inflict on electrostatic attraction. The concentrations of monovalent ion generally required to exert sufficient osmotic pressure, unless the hydration change is unusually large, is prohibitive for most binding measurements. However, in the case of DNA minor groove binders, their very strong intrinsic affinity for DNA combined with the low salt dependence of their binding constants make perturbation with salt an attractive approach. Moreover, since the release of thermodynamically bound cations due to backbone neutralization in DNA has an independent theoretical basis [31, 32], one may physically interpret the Wyman coefficient for the summed Na+ and Cl− released from the neutralization of z phosphates and k positive moieties as Δv±=−(ψz+k), where ψ = 0.88 is a characteristic screening factor for B-form DNA [33]. DNA binding by minor groove-binding dications has been established with netropsin [34] and a furan analogue of DB1976 [14] as z = 2. With independent specification of Na+ release, the curvature to the log-log dependence at high salt indicates the coupled excess hydration change. As the coefficients in Eq. (6) oppose, concave up behavior indicates coupled water and ion release. Conversely, concave down curvature indicates water uptake.
We carried out titrations of DB1976/DNA binding at graded concentrations of NaCl from 0.2 to 3.0 M [Figure 5A]. Over this broad range of Na+ concentrations, the initially linear log-log relationship relented at ~1 M and curved, concave upward, up to 3.0 M [Table 3]. Approximating molality with molarity c±, the integrated form of Eq. (6) to the data afforded an excellent fit:
| (7) |
Least-square estimates of Δv± and Δvw were −2.2 ± 0.1 and −29 ± 2, and indicated coupled hydration release to DB1976 binding in the absence of osmolytes. Given the structural value of z= 2 neutralized backbone phosphates, Δv± also included a fractional contribution from Cl− release, presumably from the amidiniums of the compound (k = − Δv± − ψz = 2.2 − 0.88 × 2 = 0.4).
Figure 5. Perturbation with NaCl reveals net hydration release from the DB1976-DNA complex.

A and B, Representative titrations of DNA into DB1976 at several NaCl concentrations in H2O and D2O. C, Summary of the binding affinities in H2O (open symbols) and D2O (closed symbols). Curves represent a global fit of both sets of data to Eq. (7).
Table 3. Salt-dependent DNA binding affinity of DB1976 in H2O and D2O.
DB1976/DNA titrations were carried out in the absence of osmolyte at the indicated NaCl concentrations. The salt-dependent data was globally fitted to Eq. (7) to estimate the excess ion (ΔvL) and hydration (Δvw) changes that attend DB1976/DNA binding; negative values denote net release upon complex formation.
| [NaCl], M | −log (Kd, M), H2O | −log (Kd, M), D2O | |
|---|---|---|---|
| 0.20 | 9.90 ± 0.12 | 10.27 ± 0.09 | |
| 0.25 | 9.79 ± 0.09 | 10.01 ± 0.10 | |
| 0.30 | 9.64 ± 0.10 | 9.87 ± 0.16 | |
| 0.375 | 9.50 ± 0.01 | 9.72 ± 0.14 | |
| 0.50 | 9.30 ± 0.03 | 9.53 ± 0.11 | |
| 0.625 | 9.04 ± 0.05 | 9.27 ± 0.08 | |
| 0.75 | 8.90 ± 0.07 | 9.16 ± 0.07 | |
| 1.0 | 8.87 ± 0.01 | 9.02 ± 0.05 | |
| 1.4 | 8.70 ± 0.05 | 8.85 ± 0.06 | |
| 1.5 | 8.58 ± 0.05 | 8.81 ± 0.05 | |
| 2.0 | 8.59 ± 0.03 | 8.75 ± 0.05 | |
| 2.5 | 8.76 ± 0.07 | 8.93 ± 0.07 | |
| 3.0 | 8.72 ± 0.05 | 8.93 ± 0.06 | |
|
| |||
| −log K0 (1 M Na+) | 8.33 ± 0.04 | 8.56 ± 0.05 | |
| Δvw | −29 ± 2 | ||
| ΔvL | −2.2 ± 0.1 | ||
To further probe the coupling of ion and hydration effects on binding, we repeated the experiments in D2O [35], a more cohesive hydrogen-bonding medium than H2O [Figure 5B]. Over the same range of salt concentrations, binding in D2O was stronger than in H2O, but the salt dependence of the binding affinity did not deviate measurably from that observed in H2O [Figure 5C]. A global linear regression of the data yielded a normal equilibrium deuterium effect (offset in the ordinate) of Kd(H2O)/Kd(D2O) = 1.5 ± 0.1.
Molecular dynamics simulations of the DB1976/DNA complex formation
As the structure of the DB1976/DNA complex has not been solved experimentally, we carried out all-atom molecular dynamics simulations to gain a more detailed understanding of the structural and hydration changes that attend minor groove binding. DB1976 and the experimental DNA target in the free or bound state were explicitly hydrated in the presence of 0.15 M NaCl, without osmolyte, and simulated for 100 ns. The dynamics of unbound DB1976, unbound DNA, and the DB1976/DNA complex, the latter constructed from a docked structure (c.f. Figure 1B), rapidly converged as judged by RMS deviation from initial coordinates [Figure 6A]. To estimate the excess hydration number, we enumerated the time-averaged (± S.D.) number of water contacts within 3.4 Å of unbound DB1976, unbound DNA, and the bound complex [Figure 6B]. The dynamics simulations were carried out in sufficiently large box sizes (at least 10 Å to the periodic boundary) that ensured at least two layers of hydration around each target to mitigate the risk of artefactual hydration by imaged water molecules. Based on these counts, the DB1976/DNA complex had 58 ±14 fewer water contacts than the summed water contacts of the unbound components. Consistent with the apparent deficit in hydration, the solvent accessible surface area (SASA) of the DB1976/DNA complex was 503 ± 81 Å2 smaller than the summed SASA of the unbound constituents [Figure 6C].
Figure 6. Molecular dynamics simulations of DB1976 and DNA in their free and bound states show a hydration deficit but presence of persistent water-mediated contacts in the complex.

A, RMS deviation from initial coordinates for unbound DB1976 (blue), DNA target (orange, same sequence as the experimental construct), and complex (gray). B, Average water count (± S.D.) within 3.4 Å from unbound DB1976 (blue, 44 ± 4), unbound DNA (orange, 527 ± 10), and complex (gray, 513 ± 10). The difference in hydration between the complex and its unbound constituents translates to a deficit of 58 ± 14 waters in the complex (magenta). C, Solvent accessible surface areas (SASA) for unbound DB1976 (468 ± 6 Å2), unbound DNA (5,869 ± 51 Å2), and complex (5,833 ± 63 Å2). These estimates imply a deficit of 503 ± 81 Å2 in the complex relative to the unbound components. D, Two snapshots of the DB1976/DNA complex showing water-mediated contacts bridging amidinium N and the target DNA. Cyan dashes denote hydrogen bonds within a 2.8 ± 0.4 Å window. E, Distribution of the lifetimes of water contacts within 3.4 Å of the amidinium N (see atom numbering in Panel F) of DB1976 in the unbound and DNA-bound state. The cumulative period was 100 ns, the duration of the simulation. F, Paired distances between amidinium N and closest ring C tracked as a marker of rotational freedom on the terminal amidiniums. These distances change by up to 1 Å with rotation of the amidinium termini. G, Two-state rotameric oscillation for all four amidinium N in unbound DB1976, and absence of oscillation by any N in the amidinium substituents in the DNA-bound state.
Despite a hydration deficit relative to the unbound states, the DB1976/DNA complex was associated with water molecules bridging an amidinium N and a polar group or backbone phosphate on the DNA [Figure 6D]. Estimates of persistence water molecules contacting the amidinium N in DB1976 showed major differences in the dynamics of the bound and unbound states. Taking one of the buried amidinium N as an example [Figure 6E], the unbound state was associated with short-lived water contacts in the unbound state, up to ~200 ps, while the lifetime of hydration water in the DNA-bound state extended out to almost 700 ps. The presence of these persistent water-mediated contacts suggested that the DNA-bound compound was conformationally restricted to a high degree relative to the unbound state. To explore this possibility, we analyzed the distances between each amidinium N and their nearest ring carbons in the compound [Figure 6F]. For unbound DB1976, each set of N-C distances oscillated on the ns-timescale between two rotameric states at ~3.0 and ~3.7 Å of separation [Figure 6G]. In the complex, no rotameric transition was observed throughout the 100-ns simulation period, indicating that DNA-bound compound was highly confined in the DNA minor groove. In addition, we computed the configurational entropy of the compound’s free (67 J/mol/K) and DNA-bound (28 J/mol/K) states [Figure S1, Supplemental Information], corresponding to a change of −39 J/mol/K upon binding. This estimate is lower than reported values for netropsin (−127 J/mol/K) and distamycin (−104 J/mol/K), which have similar numbers of bonds as DB1976. Unlike the other compounds, DB1976 has a symmetric structure and is dominated by fused ring systems which provide fewer rotatable bonds. In summary, molecular dynamics simulations indicated that the DB1976/DNA complex was overall less hydrated than the unbound components and also harbored persistent water-mediated contacts that appeared to help restrain the compound configurationally in the DNA minor groove.
DISCUSSION
Reconciling the heterogeneous preferential hydration changes in DNA minor groove binding
In stark contrast with perturbation by osmolytes, we observed that water was thermodynamically net-released into bulk solvent upon DNA binding by DB1976 using only NaCl to exert osmotic pressure. The feasibility of our approach to probe preferential hydration changes without osmolytes depended on several features specific to DNA binding by minor-groove compounds. The very high intrinsic affinity of the interaction combined with its relatively weak dependence on salt allowed sampling of a sufficiently wide range of bulk salt concentrations to make effective use of NaCl as an osmotic agent. In addition, the physical specification of counter-ion release in nucleic acid interactions [31–33] offered confidence in the direction of the thermodynamic disposition of water in DB1976 binding.
The dichotomy between the effects of NaCl and osmolytes on the change in preferential hydration of DB1976/DNA binding indicates that the two cosolutes probe very different biomolecular surfaces. The ions Na+ and Cl−, which serve as counter-ions from DNA backbone phosphates and amidiniums on the compound, probe their respective association interface. The coupled release of hydration upon is therefore driven to solvate the freed ions in bulk solution. For the osmolytes, the apparent change in preferential binding spans from none (betaine, after correction for NaCl activity, nicotinamide and urea) to a range in the number released (maltose > ethylene glycol). Since the osmolytes at the concentrations used did not perturb the helix-coil stability of the duplex DNA target at 25°C (c.f. Figure 4) and changes in the preferential interactions of the DNA are expected to be similar between the free and DB1976-bound states, we conclude that the changes in preferential binding of osmolytes reflect primarily differences in their interactions with the unbound compound. The observed preferential release of ethylene glycol and maltose may be due to enhanced thermodynamic binding to the unbound compound and/or enhanced release from the compound upon DNA binding. Since NaCl does not enhance the bulk activity of either osmolyte [27, 28], we conclude that release of preferentially bound osmolyte from the compound is enhanced upon DNA binding. Thus, the increase in preferential hydration induced by osmolytes may be interpreted as the preferential replacement of osmolyte surrounding the compound by water in the DNA-bound state, rather than a net uptake of hydration by the drug/DNA complex. The coupling of a higher increase in preferential hydration with a higher release of preferentially bound maltose over ethylene glycol is consistent with this interpretation.
Hydration of DNA binding by minor groove compounds: role of water-mediated contacts
Although the use of NaCl as sole perturbing cosolute establishes the preferential hydration change in DNA binding by DB1976 in the direction of water release, hydration appears to play an important structural role in binding to the DNA minor groove [36]. Our simulations of the DB1976/DNA complex show that the terminal amidiniums are engaged in long-lived water-mediated contacts with the target DNA that are not present in the unbound state. Experimentally, co-crystals of minor groove compounds bound to site-specific AT-rich DNA exhibit well-structured water-mediated contacts emanating from the cationic terminal N and other hydrogen-bonding groups [Figure 7] [10–12, 36–38]. Given the limited number of interactions available to low-MW ligands, even a modest number of water-mediated contacts could contribute a major fraction of the binding free energy. The observation of these bridging waters in the highly dehydrated environment of crystals also supports this notion. The consistency with which these observations are made, by different laboratories and with minor groove compounds of different structures, adds further support to specific interfacial hydration as a general feature of DNA minor groove recognition.
Figure 7. Localized waters that mediate ligand-DNA interactions are a general feature of A/T-specific minor-groove binders.
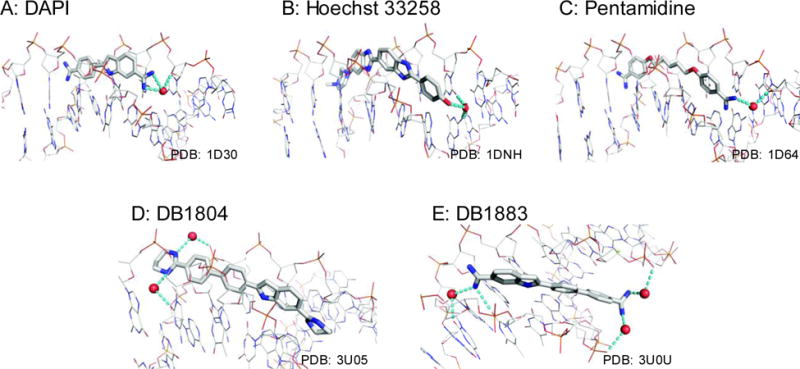
Co-crystal structures of the model minor groove compounds DAPI (A), Hoechst 33258 (B), pentamidine (C), as well as the designed heterocyclic diamidines DB1804 (D) and DB1883 (E) in complex with DNA via bridging waters emanating from their cationic N. Dashes denote hydrogen bonds within a 2.8 ± 0.4 Å cut-off. Direct ligand-DNA contacts are not shown.
An important role for water-mediated contacts in DNA minor groove binding is also supported by thermodynamic data. Preferential hydration release is consistent with negative changes in heat capacities from calorimetric measurements of minor groove binding by low-molecular weight compounds such as netropsin [39]. Sidorova and Rau [8] estimated the release of ~40 waters based on a loss of ~4 nm2 of solvent-accessible surface area for netropsin (a similar water-to-SASA ratio as our simulation results for DB1976). This level of hydration release translates to a substantial entropic gain (up to +8 kJ/mol at 25°C per water molecule, or up to +320 kJ/mol for 10 released water [40, 41]). However, with the notable exception of Hoechst 33258, minor groove binders generally show modest overall entropy changes, well below +40 kJ/mol [3]. For netropsin, the overall entropic free energy change ranges from +13 to +21 kJ/mol at 25°C depending on salt concentration [39]. In addition to hydration release, two other major sources of entropy change are from counter-ion release, which is favorable, and a loss of configuration entropy by the compound, which is unfavorable. The dilution entropy gain of Na+ release from the z = 2 backbone phosphates (neutralized by the dicationic compound) can be estimated from polyelectrolyte theory by [42]:
| (8) |
Eq. (8) adds TΔSPE = +3 to 7 kJ/mol at 25°C for the range of 0.05 to 0.3 M of Na+ concentrations used in the calorimetric experiments [39].1 The loss of configurational entropy, which has been computed for netropsin [43], gives TΔSconf = −38 kJ/mol at 25°C. Thus, configuration entropy partially compensates for the expected contribution from hydration release, but is insufficient to fully account for modest overall entropy change of binding. Even if the favorable entropic contribution from hydration release is over-estimated by 50%, a substantial gap remains. Contribution from a number of well-ordered water contacts may well fill this gap. As the Wyman linkages integrates all hydration events into one overall stoichiometry, we note that for DB1976/DNA binding, the experimentally measured hydration release with NaCl (~−30) is significantly lower than the number inferred from molecular dynamics simulation (~−60).
Statistical thermodynamic interpretation of preferential interactions
Analysis of the present data using Wyman linkages describes the effects of cosolutes on DB1976/DNA binding as changes in their preferential binding or exclusion (i.e. preferential hydration). Absent some independent definition of physical excess numbers (such as the release of Na+ from DNA backbone phosphates by polyelectrolyte theory [32]), the magnitude of the binding coefficients (Δv) can only be interpreted in terms of coupled water and cosolute exchange as in the case with osmolytes [44]. The role of water-mediated contacts that seem essential to DNA minor groove binding does not fit well in the thermodynamic binding picture, which caters to weak, nonspecific interactions and assumes an equivalence between water and cosolute [45]. The affinity of bridging waters is expected to be much higher than their loosely hydrating counterparts and, in addition, they can unlikely be replaced 1:1 with cosolute. Heterogeneity in affinities of hydration water has been considered at length in the literature for protein conformational equilibria [44]. The situation with water-mediated contacts is different in that the bridging waters are presumably coupled to the biomolecular complex itself such that they become a specific part of that component (“2”) in addition to their general role as solvent (component “1”).
A more general statistical thermodynamic interpretation is rendered by the Kirkwood-Buff (KB) theory [46–48]. Instead of treating the disposition of water and cosolute as a stoichiometric coupling, the KB framework treats preferential hydration of a solute of interest in terms of excess hydration within the volume surrounding the solute from which the osmolyte is excluded (i.e., bounded by the osmotic dividing surface). Thus, the observed differences in preferential hydration change due to the various osmolytes, even in the absence of change in their own preferential interactions, reflect corresponding differences in the dividing surface among the free and bound components. Using the KB approach, Shimizu and co-workers have shown that preferential hydration values can be resolved to yield physical excess hydration numbers via the partial molar volume change of the interaction. Efforts to interpret the osmolyte- induced preferential hydration changes in DB1976/DNA in light of the attendant physical changes in hydration via direct volumetric measurements in H2O and D2O are underway.
CONCLUSION
Using both ionic and non-ionic cosolutes, we probed the hydration energetics of DNA recognition by the minor groove compounds DB1976, a heterocyclic diamidine anchored on a symmetric selenophene-bis(benzimidazole) scaffold, to an AT-rich DNA site. Perturbation using only NaCl to high osmotic pressure showed a coupled release of hydration water, in agreement with a loss of water contacts and solvent-accessible surface area as computed from all-atom molecular dynamics simulations. Our complementary approach of exerting osmotic pressure with non-ionic solutes or its complete substitution by salt may be useful for further understanding the hydration changes in other binding modes, such as intercalation, for which osmotic stress also suggests significant water uptake [35, 49, 50].
Supplementary Material
HIGHLIGHTS.
The hydration change in DNA binding by minor-groove ligands is presently controversial.
Inhibition of DB1976/DNA binding by osmolytes shows a strong non-osmotic component.
Perturbation with NaCl alone to high osmotic pressure reveals net hydration release.
Simulations show overall hydration deficit and loss of surface area in the complex.
Implications of water release in the thermodynamics of minor groove binding are discussed.
Acknowledgments
We thank Drs. W. David Wilson and Ananya Paul for experimental assistance, Dr. Yanyi Chen for assistance with fluorescence equipment, and the reviewers for their insightful comments. N.E. is an NSF Louis Stokes Alliance for Minority Participation in Research Fellow and acknowledges support from the University Assistantship Program at Georgia State University. This investigation was supported by NSF grant MCB 15451600 and NIH grant R21 HL129063 to G.M.K.P.
Footnotes
Publisher's Disclaimer: This is a PDF file of an unedited manuscript that has been accepted for publication. As a service to our customers we are providing this early version of the manuscript. The manuscript will undergo copyediting, typesetting, and review of the resulting proof before it is published in its final citable form. Please note that during the production process errors may be discovered which could affect the content, and all legal disclaimers that apply to the journal pertain.
Eq. (8) does not include an additional favorable contribution from anion release from the dicationic compound.
DEDICATION
The authors wish to celebrate the life and work of Dr. Donald C. Rau (1947–2015), who advanced the theory and practice of osmotic stress, nucleic acids biophysics, and the professional development of early-career scientists.
References
- 1.Kubinec MG, Wemmer DE. NMR evidence for DNA bound water in solution. J Am Chem Soc. 1992;114:8739–8740. [Google Scholar]
- 2.Liepinsh E, Otting G, Wuthrich K. NMR observation of individual molecules of hydration water bound to DNA duplexes: direct evidence for a spine of hydration water present in aqueous solution. Nucleic acids research. 1992;20:6549–6553. doi: 10.1093/nar/20.24.6549. [DOI] [PMC free article] [PubMed] [Google Scholar]
- 3.Chaires JB. A thermodynamic signature for drug-DNA binding mode. Arch Biochem Biophys. 2006;453:26–31. doi: 10.1016/j.abb.2006.03.027. [DOI] [PubMed] [Google Scholar]
- 4.Haq I, Jenkins TC, Chowdhry BZ, Ren J, Chaires JB. Parsing free energies of drug-DNA interactions. Methods Enzymol. 2000;323:373–405. doi: 10.1016/s0076-6879(00)23374-0. [DOI] [PubMed] [Google Scholar]
- 5.Chaires JB. Energetics of drug-DNA interactions. Biopolymers. 1997;44:201–215. doi: 10.1002/(SICI)1097-0282(1997)44:3<201::AID-BIP2>3.0.CO;2-Z. [DOI] [PubMed] [Google Scholar]
- 6.Degtyareva NN, Wallace BD, Bryant AR, Loo KM, Petty JT. Hydration Changes Accompanying the Binding of Minor Groove Ligands with DNA. Biophysical Journal. 2007;92:959–965. doi: 10.1529/biophysj.106.097451. [DOI] [PMC free article] [PubMed] [Google Scholar]
- 7.Kiser JR, Monk RW, Smalls RL, Petty JT. Hydration Changes in the Association of Hoechst 33258 with DNA. Biochemistry. 2005;44:16988–16997. doi: 10.1021/bi051769x. [DOI] [PMC free article] [PubMed] [Google Scholar]
- 8.Sidorova NY, Rau DC. The osmotic sensitivity of netropsin analogue binding to DNA. Biopolymers. 1995;35:377–384. doi: 10.1002/bip.360350405. [DOI] [PubMed] [Google Scholar]
- 9.Anuradha A, Alam MS, Chaudhury NK. Osmolyte changes the binding affinity and mode of interaction of minor groove binder hoechst 33258 with calf thymus DNA. Chem Pharm Bull (Tokyo) 2010;58:1447–1454. doi: 10.1248/cpb.58.1447. [DOI] [PubMed] [Google Scholar]
- 10.Larsen TA, Goodsell DS, Cascio D, Grzeskowiak K, Dickerson RE. The structure of DAPI bound to DNA. J Biomol Struct Dyn. 1989;7:477–491. doi: 10.1080/07391102.1989.10508505. [DOI] [PubMed] [Google Scholar]
- 11.Teng MK, Usman N, Frederick CA, Wang AH. The molecular structure of the complex of Hoechst 33258 and the DNA dodecamer d(CGCGAATTCGCG) Nucleic acids research. 1988;16:2671–2690. doi: 10.1093/nar/16.6.2671. [DOI] [PMC free article] [PubMed] [Google Scholar]
- 12.Edwards KJ, Jenkins TC, Neidle S. Crystal structure of a pentamidine-oligonucleotide complex: implications for DNA-binding properties. Biochemistry. 1992;31:7104–7109. doi: 10.1021/bi00146a011. [DOI] [PubMed] [Google Scholar]
- 13.Munde M, Wang S, Kumar A, Stephens CE, Farahat AA, Boykin DW, Wilson WD, Poon GM. Structure-dependent inhibition of the ETS-family transcription factor PU.1 by novel heterocyclic diamidines. Nucleic acids research. 2014;42:1379–1390. doi: 10.1093/nar/gkt955. [DOI] [PMC free article] [PubMed] [Google Scholar]
- 14.Stephens DC, Kim HM, Kumar A, Farahat AA, Boykin DW, Poon GMK. Pharmacologic efficacy of PU.1 inhibition by heterocyclic dications: a mechanistic analysis. Nucleic acids research. 2016;44:4005–4013. doi: 10.1093/nar/gkw229. [DOI] [PMC free article] [PubMed] [Google Scholar]
- 15.Mohamed Amine B, Melanie L, Marie-Helene D-C. Targeting Transcription Factor Binding to DNA by Competing with DNA Binders as an Approach for Controlling Gene Expression. Current Topics in Medicinal Chemistry. 2015;15:1323–1358. doi: 10.2174/1568026615666150413154713. [DOI] [PubMed] [Google Scholar]
- 16.Wang JM, Wang W, Kollman PA. Antechamber: An accessory software package for molecular mechanical calculations. Abstr Pap Am Chem S. 2001;222 [Google Scholar]
- 17.Wang J, Cieplak P, Kollman PA. How well does a restrained electrostatic potential (RESP) model perform in calculating conformational energies of organic and biological molecules? J Comp Chem. 2000;21 [Google Scholar]
- 18.Trott O, Olson AJ. AutoDock Vina: improving the speed and accuracy of docking with a new scoring function, efficient optimization, and multithreading. J Comput Chem. 2010;31:455–461. doi: 10.1002/jcc.21334. [DOI] [PMC free article] [PubMed] [Google Scholar]
- 19.Zgarbova M, Sponer J, Otyepka M, Cheatham TE, 3rd, Galindo-Murillo R, Jurecka P. Refinement of the Sugar-Phosphate Backbone Torsion Beta for AMBER Force Fields Improves the Description of Z- and B-DNA. J Chem Theory Comput. 2015;11:5723–5736. doi: 10.1021/acs.jctc.5b00716. [DOI] [PubMed] [Google Scholar]
- 20.Essmann U, Perera L, Berkowitz ML, Darden T, Lee H, Pedersen LG. A Smooth Particle Mesh Ewald Method. J Chem Phys. 1995;103:8577–8593. [Google Scholar]
- 21.Munde M, Lee M, Neidle S, Arafa R, Boykin DW, Liu Y, Bailly C, Wilson WD. Induced Fit Conformational Changes of a “Reversed Amidine” Heterocycle: Optimized Interactions in a DNA Minor Groove Complex. J Am Chem Soc. 2007;129:5688–5698. doi: 10.1021/ja069003n. [DOI] [PMC free article] [PubMed] [Google Scholar]
- 22.Wei D, Wilson WD, Neidle S. Small-molecule Binding to the DNA Minor Groove Is Mediated by a Conserved Water Cluster. J Am Chem Soc. 2013;135:1369–1377. doi: 10.1021/ja308952y. [DOI] [PMC free article] [PubMed] [Google Scholar]
- 23.Parsegian VA, Rand RP, Rau DC. Macromolecules and water: probing with osmotic stress. Methods Enzymol. 1995;259:43–94. doi: 10.1016/0076-6879(95)59039-0. [DOI] [PubMed] [Google Scholar]
- 24.Timasheff SN. Protein-solvent preferential interactions, protein hydration, and the modulation of biochemical reactions by solvent components. Proc Natl Acad Sci U S A. 2002;99:9721–9726. doi: 10.1073/pnas.122225399. [DOI] [PMC free article] [PubMed] [Google Scholar]
- 25.Timasheff SN. In disperse solution, “osmotic stress” is a restricted case of preferential interactions. Proc Natl Acad Sci U S A. 1998;95:7363–7367. doi: 10.1073/pnas.95.13.7363. [DOI] [PMC free article] [PubMed] [Google Scholar]
- 26.Hong J, Capp MW, Saecker RM, Record MT., Jr Use of urea and glycine betaine to quantify coupled folding and probe the burial of DNA phosphates in lac repressor-lac operator binding. Biochemistry. 2005;44:16896–16911. doi: 10.1021/bi0515218. [DOI] [PMC free article] [PubMed] [Google Scholar]
- 27.Li S, Tang J, Ma Y, Zhai Q, Jiang Y, Hu M. Activity Coefficients of NaCl in Ethylene Glycol-Water Mixtures Using Potentiometric Measurements at 288.15, 298.15 and 308.15 K, Chinese. Journal of Chemistry. 2011;29:2007–2013. [Google Scholar]
- 28.Hernandez-Luis F, Amado-Gonzalez E, Esteso MA. Activity coefficients of NaCl in trehalose–water and maltose-water mixtures at 298.15 K. Carbohydrate Research. 2003;338:1415–1424. doi: 10.1016/s0008-6215(03)00177-0. [DOI] [PubMed] [Google Scholar]
- 29.Courtenay ES, Capp MW, Anderson CF, Record MT. Vapor Pressure Osmometry Studies of Osmolyte–Protein Interactions: Implications for the Action of Osmoprotectants in Vivo and for the Interpretation of “Osmotic Stress” Experiments in Vitro†. Biochemistry. 2000;39:4455–4471. doi: 10.1021/bi992887l. [DOI] [PubMed] [Google Scholar]
- 30.Spink CH, Chaires JB. Effects of Hydration, Ion Release, and Excluded Volume on the Melting of Triplex and Duplex DNA. Biochemistry. 1999;38:496–508. doi: 10.1021/bi9820154. [DOI] [PubMed] [Google Scholar]
- 31.Thomas Record M, Jr, Zhang W, Anderson CF. Analysis of Effects of Salts and Uncharged Solutes on Protein and Nucleic Acid Equilibria and Processes: A Practical Guide to Recognizing and Interpreting Polyelectrolyte Effects, Hofmeister Effects, and Osmotic Effects of Salts. In: Enrico Di C, editor. Advances in Protein Chemistry, Academic Press. 1998. pp. 281–353. [DOI] [PubMed] [Google Scholar]
- 32.Record MT, Jr, Anderson CF, Lohman TM. Thermodynamic analysis of ion effects on the binding and conformational equilibria of proteins and nucleic acids: the roles of ion association or release, screening, and ion effects on water activity. Q Rev Biophys. 1978;11:103–178. doi: 10.1017/s003358350000202x. [DOI] [PubMed] [Google Scholar]
- 33.Record MT, Jr, Lohman ML, De Haseth P. Ion effects on ligand-nucleic acid interactions. J Mol Biol. 1976;107:145–158. doi: 10.1016/s0022-2836(76)80023-x. [DOI] [PubMed] [Google Scholar]
- 34.Marky LA, Breslauer KJ. Origins of netropsin binding affinity and specificity: correlations of thermodynamic and structural data. Proc Natl Acad Sci U S A. 1987;84:4359–4363. doi: 10.1073/pnas.84.13.4359. [DOI] [PMC free article] [PubMed] [Google Scholar]
- 35.Qu X, Chaires JB. Hydration changes for DNA intercalation reactions. J Am Chem Soc. 2001;123:1–7. doi: 10.1021/ja002793v. [DOI] [PubMed] [Google Scholar]
- 36.Nguyen B, Neidle S, Wilson WD. A Role for Water Molecules in DNA-Ligand Minor Groove Recognition. Accounts of Chemical Research. 2009;42:11–21. doi: 10.1021/ar800016q. [DOI] [PMC free article] [PubMed] [Google Scholar]
- 37.Miao Y, Lee MP, Parkinson GN, Batista-Parra A, Ismail MA, Neidle S, Boykin DW, Wilson WD. Out-of-shape DNA minor groove binders: induced fit interactions of heterocyclic dications with the DNA minor groove. Biochemistry. 2005;44:14701–14708. doi: 10.1021/bi051791q. [DOI] [PubMed] [Google Scholar]
- 38.Wei D, Wilson WD, Neidle S. Small-molecule binding to the DNA minor groove is mediated by a conserved water cluster. J Am Chem Soc. 2013;135:1369–1377. doi: 10.1021/ja308952y. [DOI] [PMC free article] [PubMed] [Google Scholar]
- 39.Wang S, Kumar A, Aston K, Nguyen B, Bashkin JK, Boykin DW, Wilson WD. Different thermodynamic signatures for DNA minor groove binding with changes in salt concentration and temperature. Chem Commun (Camb) 2013;49:8543–8545. doi: 10.1039/c3cc44569k. [DOI] [PMC free article] [PubMed] [Google Scholar]
- 40.Dunitz JD. The Entropic Cost of Bound Water in Crystals and Biomolecules. Science. 1994;264:670–670. doi: 10.1126/science.264.5159.670. [DOI] [PubMed] [Google Scholar]
- 41.Holdgate GA, Tunnicliffe A, Ward WH, Weston SA, Rosenbrock G, Barth PT, Taylor IW, Pauptit RA, Timms D. The entropic penalty of ordered water accounts for weaker binding of the antibiotic novobiocin to a resistant mutant of DNA gyrase: a thermodynamic and crystallographic study. Biochemistry. 1997;36:9663–9673. doi: 10.1021/bi970294+. [DOI] [PubMed] [Google Scholar]
- 42.Record MT, DeHaseth PL, Lohman TM. Interpretation of monovalent and divalent cation effects on the lac repressor-operator interaction. Biochemistry. 1977;16:4791–4796. doi: 10.1021/bi00641a005. [DOI] [PubMed] [Google Scholar]
- 43.Dolenc J, Baron R, Oostenbrink C, Koller J, van Gunsteren WF. Configurational Entropy Change of Netropsin and Distamycin upon DNA Minor-Groove Binding. Biophysical Journal. 91:1460–1470. doi: 10.1529/biophysj.105.074617. [DOI] [PMC free article] [PubMed] [Google Scholar]
- 44.Timasheff SN. Control of protein stability and reactions by weakly interacting cosolvents: the simplicity of the complicated. Adv Protein Chem. 1998;51:355–432. doi: 10.1016/s0065-3233(08)60656-7. [DOI] [PubMed] [Google Scholar]
- 45.Schellman JA. The relation between the free energy of interaction and binding. Biophysical Chemistry. 1993;45:273–279. [Google Scholar]
- 46.Shimizu S. Estimating hydration changes upon biomolecular reactions from osmotic stress, high pressure, and preferential hydration experiments. Proceedings of the National Academy of Sciences of the United States of America. 2004;101:1195–1199. doi: 10.1073/pnas.0305836101. [DOI] [PMC free article] [PubMed] [Google Scholar]
- 47.Shimizu S, Matubayasi N. Preferential solvation: dividing surface vs excess numbers. J Phys Chem B. 2014;118:3922–3930. doi: 10.1021/jp410567c. [DOI] [PubMed] [Google Scholar]
- 48.Shimizu S, Stenner R, Matubayasi N. Gastrophysics: Statistical thermodynamics of biomolecular denaturation and gelation from the Kirkwood-Buff theory towards the understanding of tofu. Food Hydrocolloids. 2017;62:128–139. [Google Scholar]
- 49.Kenney RM, Buxton KE, Glazier S. Investigating the impacts of DNA binding mode and sequence on thermodynamic quantities and water exchange values for two small molecule drugs. Biophys Chem. 2016;216:9–18. doi: 10.1016/j.bpc.2016.05.002. [DOI] [PubMed] [Google Scholar]
- 50.Yu H, Ren J, Chaires JB, Qu X. Hydration of Drug–DNA Complexes: Greater Water Uptake for Adriamycin Compared to Daunomycin. Journal of Medicinal Chemistry. 2008;51:5909–5911. doi: 10.1021/jm800826y. [DOI] [PMC free article] [PubMed] [Google Scholar]
Associated Data
This section collects any data citations, data availability statements, or supplementary materials included in this article.