

Abstract
Aims
To test the hypothesis that high‐intensity interval training (HIIT) and moderate‐intensity continuous training (MICT) improve brown adipose tissue (BAT) insulin sensitivity.
Participants and methods
Healthy middle‐aged men (n = 18, age 47 years [95% confidence interval {CI} 49, 43], body mass index 25.3 kg/m2 [95% CI 24.1‐26.3], peak oxygen uptake (VO2peak) 34.8 mL/kg/min [95% CI 32.1, 37.4] ) were recruited and randomized into six HIIT or MICT sessions within 2 weeks. Insulin‐stimulated glucose uptake was measured using 2‐[18F]flouro‐2‐deoxy‐D‐glucose positron‐emission tomography in BAT, skeletal muscle, and abdominal and femoral subcutaneous and visceral white adipose tissue (WAT) depots before and after the training interventions.
Results
Training improved VO2peak (P = .0005), insulin‐stimulated glucose uptake into the quadriceps femoris muscle (P = .0009) and femoral subcutaneous WAT (P = .02) but not into BAT, with no difference between the training modes. Using pre‐intervention BAT glucose uptake, we next stratified subjects into high BAT (>2.9 µmol/100 g/min; n = 6) or low BAT (<2.9 µmol/100 g/min; n = 12) groups. Interestingly, training decreased insulin‐stimulated BAT glucose uptake in the high BAT group (4.0 [2.8, 5.5] vs 2.5 [1.7, 3.6]; training*BAT, P = .02), whereas there was no effect of training in the low BAT group (1.5 [1.2, 1.9] vs 1.6 [1.2, 2.0] µmol/100 g/min). Participants in the high BAT group had lower levels of inflammatory markers compared with those in the low BAT group.
Conclusions
Participants with functionally active BAT have an improved metabolic profile compared with those with low BAT activity. Short‐term exercise training decreased insulin‐stimulated BAT glucose uptake in participants with active BAT, suggesting that training does not work as a potent stimulus for BAT activation.
Keywords: brown adipose tissue, exercise training, glucose uptake, free fatty acid uptake, positron emission tomography
1. INTRODUCTION
Brown adipose tissue (BAT) has an exceptional thermogenic potential attributable to mitochondrial uncoupling protein 1 (UCP‐1).1, 2 BAT is suggested to regulate energy balance in humans, and enhance glucose homeostasis and insulin sensitivity, and thus may be a potential therapeutic target for obesity and insulin resistance.3, 4 BAT is activated by cold exposure, and other stimuli, including insulin.5, 6 The effects of exercise training on BAT activity in humans are incompletely understood.
It is well known that regular exercise improves skeletal muscle insulin sensitivity and whole‐body homeostasis. We have shown that high‐intensity interval training (HIIT) and moderate‐intensity continuous training (MICT) improve both whole‐body and skeletal muscle insulin‐stimulated glucose uptake.7 Limited studies have investigated the effects of exercise on BAT glucose uptake in humans, and the data, thus far, have not been consistent. One study showed higher BAT glucose uptake in people with cancer who had higher self‐reported physical activity compared with those who were sedentary.8 Another study showed significantly lower cold‐induced BAT glucose uptake in trained athletes compared with sedentary men.9 Both of these studies, however, were cross‐sectional investigations, and studies directly determining the effects of exercise training on BAT glucose uptake are lacking. In addition, while there has been considerable investigation into the effects of exercise training on glucose metabolism in humans, data on the effects of exercise training on fatty acid metabolism in white adipose tissue (WAT) and BAT have been much more limited.
The aim of the present study was to determine if exercise training alters insulin‐stimulated glucose uptake in BAT. In addition, we determined if the intensity and duration of exercise training affected BAT metabolism. Sedentary middle‐aged men (n = 18) completed 2 weeks of HIIT or MICT training. Pre‐ and post‐training insulin‐stimulated glucose uptake and fasting free fatty acid (FFA) uptake were determined in BAT, WAT depots and skeletal muscle using 2‐[18F]flouro‐2‐deoxy‐D‐glucose (FDG) and 14(R,S)‐[18F]fluoro‐6‐thia‐heptadecanoic acid (FTHA) and positron‐emission tomography (PET)/computed tomography (CT). We hypothesized that HIIT exercise training activates BAT, resulting in enhanced insulin‐stimulated glucose uptake, and that MICT exercise training increases BAT activity to a lesser extent. Furthermore, we investigated whether BAT activity was related to metabolic profile.
2. PARTICIPANTS AND METHODS
A total of 28 healthy middle‐aged sedentary men (age 40‐55 years, body mass index 18.5‐30 kg/m2, peak oxygen uptake [VO2Peak] 40 mL/kg/min) were randomized into two groups: HIIT (n = 14) or MICT (n = 14). The study was approved by the local ethics committee of the hospital district of South‐Western Finland and was carried out in compliance with the Declaration of Helsinki. Informed consent was obtained before any measurements were performed. The recruitment process, and inclusion and exclusion criteria have been described previously.10 In 7 participants supraclavicular PET scanning was not possible because of technical difficulties. During the training intervention, 2 participants withdrew from the HIIT group; 1 because of training‐induced hip pain, and 1 because of illness. One participant from the MICT group withdrew for personal reasons (total n = 18; HIIT, n = 7 and MICT, n = 11; Figure 1A,B). The present study is part of a larger study titled, “The effects of short‐term high intensity interval training on tissue glucose and fat metabolism in healthy subjects and in patients with type 2 diabetes” (Clinicaltrials.gov #NCT01344928).
Figure 1.
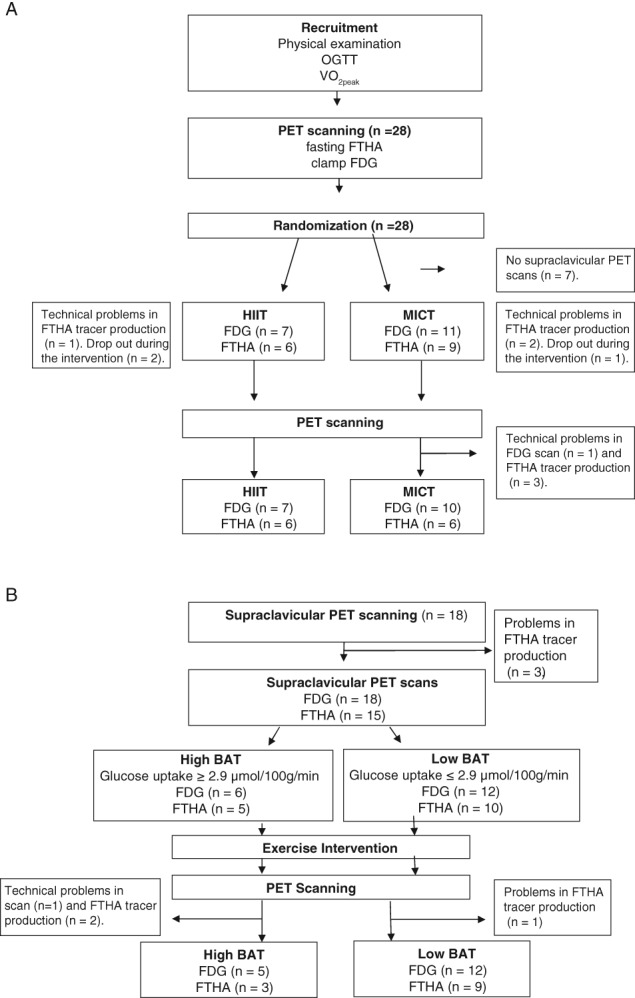
A, Study design for the sub‐study of the larger HITPET (NCT01344928) study project including 18 healthy middle‐aged men randomized into two training programmes, HIIT and MICT. B, Study design showing the division of subjects into high BAT and low BAT activity groups. OGTT, oral glucose tolerance test
2.1. Study design
At the initial screening visit, physical examination, ECG, blood sampling, a fasting 2‐hour 75‐g oral glucose tolerance test, and VO2peak were performed. On the first study day, MRI and fasting [18F]FTHA‐PET/CT scanning were performed, and on the second day we performed [18F]FDG‐PET/CT scanning during a euglycaemic–hyperinsulinaemic clamp. These studies were repeated after the 2‐week exercise intervention, starting with the [18F]‐FTHA‐PET study at ~48 hours, followed by a [18F]FDG‐PET study at ~72 hours and an oral glucose tolerance test, and VO2peak test ~96 hours after the last training session.
2.2. PET studies
The PET/CT images were acquired using GE Discovery TM ST System (General Electric Medical Systems, Milwaukee, Wisconsin). The participants fasted ≥12 hours before the PET studies, and avoided physical activity and both caffeinated and alcoholic drinks for 48 hours before the PET scans. More detailed information is provided in Appendix S1.
2.3. Euglycaemic–hyperinsulinaemic clamp, exercise intervention, VO2peak test and indirect calorimetry
The euglycaemic–hyperinsulinaemic clamp technique was used as described previously.7 The FDG‐PET study was performed when the participant reached the stable glucose concentrations at the level of 5 mmol/L (within 5% range for at least 15 minutes) after positioning into the PET scanner. Whole‐body insulin‐stimulated glucose uptake rate (M‐value) was calculated from the measured glucose values collected at steady‐state during the PET scan. Participants were randomized into HIIT and MICT exercise intervention protocols. These protocols consisted of 6 training sessions over a period of 2 weeks. Sessions 1 and 2 consisted of 4 × 30 seconds of all‐out cycling bouts with 4 minutes of recovery between the bouts (Monark Ergomedic 828E; Monark, Vansbro, Sweden). Sessions 3 and 4 consisted of 5 bouts and sessions 5 and 6 consisted of 6 bouts. Each bout started with 5‐second acceleration to maximum cadence without any resistance, followed by an immediate increase of the load (7.5% of whole‐body weight in kg) for 30 seconds. A MICT session consisted of cycling at an intensity of 60% of VO2peak (Tunturi E85; Tunturi Fitness, Almere, The Netherlands). The duration of cycling was 40 minutes for sessions 1 and 2, 50 minutes for sessions 3 and 4, and 60 minutes for sessions 5 and 6.10 VO2peak was determined 1 week before the exercise intervention started and ~96 hours after the last exercise session, as described previously.7 The open‐system indirect calorimetry (Deltatrac) was used for the measurement of O2 consumption (VO2) and CO2 production (VCO2) to calculate whole‐body energy expenditure and substrate oxidation rates.11, 12
2.4. BAT mass calculation
The BAT mass was analysed by thresholding the voxels from all the potential sites of BAT (cervical, supraclavicular and axillary adipose depots) based on Hounsfield units (HU) in the CT image (‐250 and ‐50 HU). All voxels above 2.9 µmol/100 g/min glucose uptake on parametric PET images were included. Lastly, the volume of all these voxels (cm3) was converted into mass using BAT density of 0.92 g/cm3.6, 13, 14
2.5. Body composition
The MRI scans were carried out using Philips Gyroscan Intera 1.5T CV Nova Dual scanner (Philips, Amsterdam, the Netherlands). Abdominal area axial T1‐weighted dual fast field echo images (TE 2.3 and 4.7 ms, TR 120 ms, slice thickness 10 mm without gap) were obtained. Abdominal subcutaneous and visceral adipose tissue masses were analysed using SliceOmatic software v.4.3 (http://www.tomovision.com/products/sliceomatic.htm). To obtain the tissue mass, the pixel surface area was multiplied by the slice thickness and the density of adipose tissue 0.9196 kg/L.15 A bioimpedance monitor (InBody 720; Mega Electronics, Kuopio, Finland) was used to measure body fat percentage.
2.6. Other measurements
Serum adipokine concentration of nerve growth factor (NGF), interleukin (IL)‐6, IL‐8, leptin, hepatocyte growth factor (HGF), MCP‐1, and tumour necrosis factor (TNF)‐α were analysed using the Adipokine Magnetic Bead Panel 2 (Cat#HADK2MAG‐61K; Millipore, Billerica, Massachusetts) on the Luminex‐Multiplex analyser (Millipore). Plasma catecholamines were analysed using a Chromsystems reagent kit for HPLC analysis (Chromsystems Instruments and Chemicals GmbH, Munich, Germany) with the Agilent ChemStation chromatography program. Plasma total and HDL cholesterol, triglycerides and glucose were measured from the venous blood samples with an automatized enzymatic assay and insulin using automatized electro‐chemiluminescence immunoassay (Cobas 8000; Roche Diagnostics GmbH, Mannheim, Germany). LDL cholesterol concentration was calculated using the Friedewald formula.
2.7. Statistical methods
Descriptive statistics are given as model‐based means and 95% confidence intervals (CIs). Normal distribution of the variables was assessed using the Shapiro–Wilk test, and logarithmic transformation was carried out for non‐normally distributed values (glucose uptake data, muscle and abdominal visceral adipose tissue FFA uptake, BAT mass, insulin levels, HDL, IL‐6, TNFα, whole‐body resting energy expenditure and catecholamines). Statistical analyses were performed with hierarchical linear mixed models compound symmetry covariance structure, including 1 within‐factor (training; before and after intervention in the whole group) interaction term (training*group; the HIIT and MICT groups behaved differently for the change in variable, with significant differences between the training modes) and (training*BAT; the high BAT and low BAT groups behaved differently for the change in variable, with significant difference between them). Missing data points were accounted for by restricted maximum likelihood estimation within the linear mixed models. Correlation analyses were performed between the variables on a whole‐group level (n = 18) using Pearson's correlation. All values are reported as model‐based mean (SAS least squares means) values from all of the variables measured before and after training. P values < .05 were taken to indicate statistical significance. The analyses were performed using SAS System, version 9.3 for Windows (SAS Institute Inc., Cary, North Carolina).
3. RESULTS
3.1. Effects of HIIT and MICT
There were no differences in anthropometrics and glucose and lipid profiles between HIIT and MICT groups before the intervention (Table S1A,B, Appendix S1). After training, aerobic capacity increased by 6% (training P = .0005), and this tended to be higher after HIIT (9.2%) compared with MICT (3.5%) training (training*group P = .06). HIIT training lowered LDL cholesterol (training P = .0003; training*group P = .01), and tended to lower total cholesterol more than MICT training (training P = .002; training*group P = .06). Both training modes reduced whole‐body fat percentage by 4% (training P = .0005) and visceral fat by 8% (training P = .009).
Training improved insulin‐stimulated glucose uptake in the quadriceps femoris muscle (training P = .0009) and in femoral WAT, but training effect was not significantly different between the groups (training P = .02; Figure S1A,B, Appendix S1). Training did not change the insulin‐stimulated glucose uptake rate in BAT, abdominal subcutaneous WAT, or in visceral adipose tissue (Figure S1B, Appendix S1). Exercise training or training mode did not alter FFA uptake in muscle or BAT (Figure S1C,D, Appendix S1). FFA uptake tended to decrease in visceral adipose tissue (training P = .07; training*group P = .11) and in abdominal subcutaneous WAT, with a trend towards greater decrease after MICT than HIIT (training P = .08; training*group P = .06; Figure S1D, Appendix S1).
At baseline, BAT glucose uptake correlated inversely with body mass index (r = ‐0.55, P = .02), body weight (r = ‐0.61, P = .01), and waist circumference (r = ‐0.52, P = .03), and positively with HDL cholesterol (r = 0.62, P = .01). BAT glucose uptake also correlated with whole‐body insulin sensitivity (M‐value; r = 0.64, P = .004), quadriceps muscle glucose uptake (r = 0.47, P = .04), and visceral fat glucose uptake (r = ‐0.55, P = .02). A positive correlation was found between BAT FFA uptake and muscle FFA uptake (r = 0.73, P = .002).
3.2. Participants with low and high BAT activity
Brown adipose tissue activity is highly variable between individuals and we have previously proposed that glucose uptake >2.9 µmol/100 g/min represents functionally active BAT during euglycaemic—hyperinsulinaemic clamp.5, 6 All participants were, therefore, re‐stratified into high BAT activity (n = 6) and low BAT activity (n = 12) groups, based on the baseline insulin‐stimulated BAT glucose uptake threshold of 2.9 µmol/100 g/min (Figure 2A,B).6 Compared with participants with low BAT activity, those with high BAT activity had lower body adiposity and leptin concentration, greater whole‐body insulin sensitivity, and higher HDL cholesterol levels at baseline, suggesting a healthier metabolic phenotype (Table 1). Participants with high BAT activity also showed lower IL‐6 levels, but higher circulating MCP‐1 levels. During insulin stimulation, oxidation of carbohydrates was significantly higher in the high BAT than in the low BAT activity groups (Table 2), which is consistent with better M‐values. Despite the higher BAT glucose uptake, no difference was observed in BAT FFA uptake (Figure 2D), BAT mass, BAT radiodensity (Table 1), or quadriceps muscle glucose uptake (Figure 3A) between groups at baseline. By contrast, visceral adipose tissue glucose uptake was significantly higher (Figure 3B), and quadriceps muscle FFA uptake tended to be higher in the high BAT than the low BAT activity group (P = .06, Figure 3C).
Figure 2.
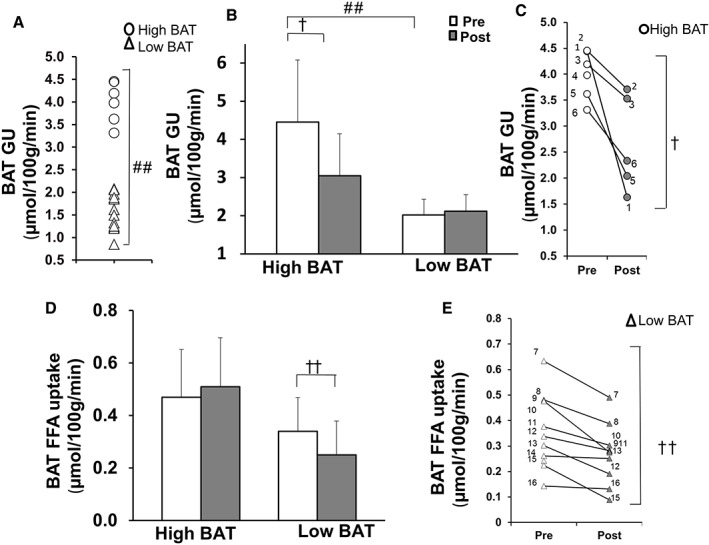
A, Division of subjects into high BAT (circles) and low BAT activity groups (triangles) with a threshold of 2.9 µmol/100 g/min at baseline. B, BAT insulin‐stimulated glucose uptake (GU) before (white bars) and after the exercise intervention (grey bars). C, Insulin‐stimulated BAT glucose uptake in each individual in the high BAT group before and after the exercise intervention. D, Fasting FFA uptake in high BAT and low BAT activity groups before and after the exercise intervention. E, Fasting FFA uptake in each individual in the low BAT activity group before and after the exercise intervention. ##P < .0001, #P = .03 difference between the groups at baseline, ††P = .01, †P = .02 indicates whether high BAT and low BAT activity groups behaved differently for the change in variable, with significant difference between them (training*BAT)
Table 1.
Characteristics of high BAT and low BAT activity groups before (Pre) and after exercise training (Post)
| High BAT activity (n = 6) | Low BAT activity (n = 12) | P | ||||
|---|---|---|---|---|---|---|
| Pre | Post | Pre | Post | Training | Training*BAT | |
| Anthropometrics | ||||||
| Body mass index, kg/m2 | 23.6 (22, 25)# | 23.7(22, 26)# | 26.9 (26, 28) | 26.8 (26, 28) | .93 | .75 |
| Fat percentage | 18.7 (15, 23)# | 17.6 (14, 22) | 24.1 (21, 26) | 23.7 (21, 26) | .04 | .37 |
| Waist, cm | 87.1 (81, 93)# | 86.3 (80, 93)# | 98.7 (94, 103) | 98.1 (94, 102) | .08 | .68 |
| VO2peak , mL/kg/min | 36.1 (32, 41) | 39.1 (35, 44) | 33.4 (31, 36) | 34.9 (32, 38) | .0005 | .16 |
| Systolic blood pressure, mm Hg | 120 (113, 127) | 122 (116, 129)# | 127 (122, 133) | 131 (127, 135) | .13 | .61 |
| Diastolic blood pressure, mm Hg | 77 (71, 83) | 76 (69, 81) | 77 (73, 81) | 78 (74, 82) | .80 | .53 |
| Subcutaneous fat mass, kg | 3.3 (1.9, 4.6)(#) | 3.2 (1.9, 4.5) | 4.8 (3.9, 5.7) | 4.7 (3.8, 5.6) | .15 | .85 |
| Visceral fat mass, kg | a1.2 (0.7, 2.1)# | 1.1 (0.6, 1.1) | 3.0 (2.0, 4.3) | 2.8 (1.9, 4.1) | .009 | .30 |
| Glucose profile | ||||||
| M value | 48.9 (36, 62)# | 49.3 (36, 62) | 31.1 (22, 40) | 36.8 (28, 46) | .13 | .18 |
| Glucosefasting, mmol/L | 5.3 (5.1, 5.6) | 5.8 (5.4, 6.2) | 5.5 (5.3, 5.7) | 5.7 (5.5, 5.9) | .05 | .34 |
| Glucoseclamp, mmol/L | 5.1 (4.5, 5.7) | 5.3 (4.8, 5.8) | 5.5 (5.3, 5.8) | 5.5 (5.2, 5.7) | .47 | .35 |
| Insulinfasting, mmol/L | a3.6 (2.5, 5.4)# | 3.9 (2.7, 5.8) | 5.7 (4.4, 7.4) | 5.7 (4.4, 7.5) | .54 | .62 |
| Insulinclamp, mmol/L | 79.5 (64, 95) | 81.7(66, 98) | 72.3 (62, 83) | 74.3 (64, 85) | .59 | .99 |
| HbA1c, % | 5.3 (5.0, 5.6) | 5.1 (4.8, 5.4) | 5.7 (5.5, 5.9) | 5.4 (5.2, 5.6) | .003 | .70 |
| Lipid profile | ||||||
| FFAfasting | 0.82 (0.5, 1.1) | 0.91 (0.6, 1.2) | 0.65 (0.4, 0.9) | 0.61 (0.4, 0.8) | .80 | .47 |
| FFAclamp | 0.46 (0.3, 0.6) | 0.51 (0.4, 0.7) | 0.41 (0.3, 0.5) | 0.37 (0.3, 0.5) | .93 | .38 |
| Cholesterol, mmol/L | 4.85 (4.0, 5.7) | 4.24 (3.4, 5.1) | 5.09 (4.5, 5.7) | 4.61 (4.0, 5.2) | .002 | .66 |
| LDL cholesterol, mmol/L | 2.90 (2.2, 3.6) | 2.46 (1.7, 3.2) | 3.40 (2.9, 3.9) | 3.03 (2.5, 3.5) | .004 | .77 |
| HDL cholesterol, mmol/L | a1.57 (1.4,1.8)## | 1.50 (1.3, 1.7)# | 1.17 (1.1, 1.3) | 1.12 (1.0, 1.2) | .27 | .99 |
| Triglycerides, mmol/L | 0.80 (0.5, 1.1) | 0.59 (0.3, 0.9)# | 1.10 (0.9, 1.3) | 1.00 (0.8, 1.2) | .08 | .51 |
| Others | ||||||
| Epinephrine | a0.14 (0.09, 0.23) | 0.17 (0.11, 0.27) | 0.14 (0.10, 0.19) | 0.25 (0.18, 0.34) | .02 | .19 |
| Norepinephrine | a1.67 (1.2, 2.2) | 2.09 (1.6, 2.8) | 1.95 (1.6, 2.4) | 2.17 (1.8, 2.6) | .13 | .57 |
| NGF, pmol/L | a0.02 (0.01, 0.06) | 0.01 (0.01, 0.05) | 0.04 (0.02, 0.07) | 0.05 (0.03, 0.09) | .95 | .37 |
| IL‐6, pmol/L | a0.01 (0.002, 0.04)# | 0.01 (0.02, 0.06) | 0.06 (0.02, 0.14) | 0.02 (0.01, 0.04) | .27 | .04 |
| IL‐8, pmol/L | 0.44 (0.2, 0.6) | 0.40 (0.2, 0.6) | 0.58 (0.5, 0.7) | 0.55 (0.4, 0.7) | .48 | .87 |
| Leptin, pmol/L | 87 (58, 232)# | 95 (61, 252) | 276 (189, 363) | 235 (150, 320) | .59 | .43 |
| HGF, pmol/L | 4.2 (1.5, 6.8) | 3.8 (0.9, 6.6) | 5.3 (3.8, 6.9) | 4.3 (2.7, 5.8) | .17 | .55 |
| MCP‐1, pmol/L | 22.0 (16, 28)# | 23.1 (17, 30) | 15.5 (12, 19) | 16.6 (13, 20) | .20 | .99 |
| TNF‐α, pmol/L | a0.16 (0.1, 0.3) | 0.15 (0.1, 0.3) | 0.29 (0.2, 0.4) | 0.25 (0.2, 0.3) | .27 | .53 |
| BAT mass (g) | a80.1 (43, 148) | 81.5 (42, 157) | 64.9 (43, 98) | 61.8 (41, 94) | .95 | .89 |
| BAT radiodensity (CT HU) | −87.5 (−93, −82) | −88.4 (−94, −83) | −91.6 (−95, −88) | −91.0 (−95, −87) | .93 | .58 |
Abbreviation: HbA1c, glycated haemoglobin.
Values are means and 95% CIs.
Log transformation was done to achieve normal distribution.
#P < .05, ##P < .01 and (#)P = .052 significant difference between groups in corresponding time point. P value (training) indicates the mean changes in before (pre) and post intervention measurements in the whole group, P‐value (training*BAT) indicates whether high BAT and low BAT activity groups behaved differently for the change in variable with significant difference between them.Statistically significant values P < .05 are marked as bold.
Table 2.
Energy expenditure of high BAT and low BAT groups when fasting and during hyperinsulinaemia
| High BAT (n = 6) | Low BAT (n = 12) | P | ||||
|---|---|---|---|---|---|---|
| Pre | Post | Pre | Post | Training | Training*BAT | |
| Energy oxidation | ||||||
| Adj REEfasting, MJ/d | a6.62 (6.1, 7.2) | 6.62 (6.1, 7.2)# | 6.81 (6.4, 7.2) | 6.86 (6.5, 7.3) | .88 | .88 |
| Adj REEclamp, MJ/d | a7.09 (6.6, 7.6) | 6.99 (6.5, 7.5) | 7.19 (6.8, 7.6) | 7.15 (6.8, 7.5) | .58 | .85 |
| Carbohydratefasting, g/min | 2.27 (1.6, 3.0) | 1.80 (1.1, 2.5) | 2.18 (1.7, 2.7) | 2.32 (1.8, 2.9) | .58 | .32 |
| Carbohydrateclamp, g/min | 3.66 (2.9, 4.4)# | 3.08 (2.3, 3.8) | 2.86 (2.3, 3.4) | 2.91 (2.3, 3.4) | .34 | .26 |
| Fatfasting, g/min | 2.33 (1.6, 3.0) | 2.82 (2.1, 3.5) | 2.65 (2.1, 3.2) | 2.82 (2.0, 3.1) | .54 | .34 |
| Fatclamp, g/min | 0.98 (0.2, 1.7)# | 1.51 (0.8, 2.2) | 2.36 (1.8, 2.9) | 2.22 (1.7, 2.7) | .47 | .27 |
| Proteinfasting, g/min | 1.13 (1.1, 1.2) | 1.18 (1.1, 1.2) | 1.15 (1.1, 1.2) | 1.14 (1.1, 1.2) | .44 | .25 |
| Proteinclamp, g/min | 1.02 (1.0, 1.1)# | 1.07 (1.0, 1.1) | 1.11 (1.1, 1.1) | 1.10 (1.1, 1.1) | .36 | .22 |
Abbreviation: REE, resting energy expenditure.
Values are means and 95% CIs.
Log transformation was done to achieve normal distribution.
#P < .05 difference between groups in corresponding time point. P value (training) indicates the mean changes in pre and post measurements in whole group, P value (training*BAT) indicates whether high BAT and low BAT groups behaved differently for the change in variable with significant difference between them.
Figure 3.
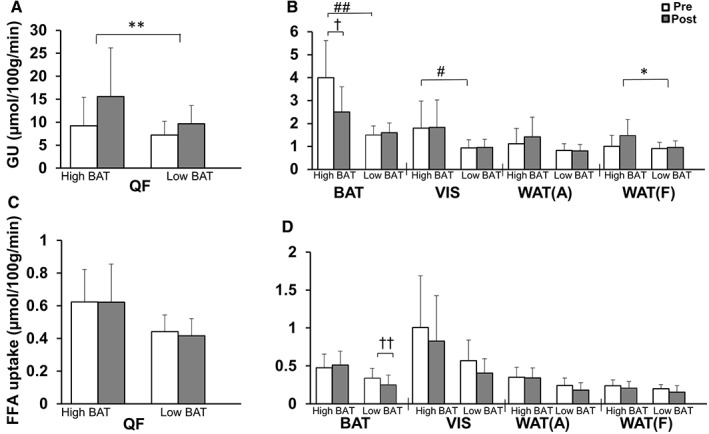
Differences between high BAT and low BAT activity groups in insulin‐stimulated glucose uptake (GU) (A and B) and fasting FFA uptake rates (C and D) in muscle and different adipose tissue depots pre‐ and post‐training. Data are means and (95% CI). #P < .0001 differences between the groups at baseline, *P = .02, **P = .0009 mean changes in pre‐ and post‐measurements in whole group (training), †P = .02, ††P = .01 indicates whether high BAT and low BAT activity groups behaved differently for the change in variable, with significant difference between them (training*BAT). QF, quadriceps femoris muscle; WAT(A), abdominal subcutaneous WAT; WAT(F), femoral subcutaneous WAT; VIS, abdominal visceral adipose tissue
3.3. Exercise training changes substrate metabolism in participants with high BAT and those with low BAT
Two weeks of training decreased insulin‐stimulated BAT glucose uptake in participants with high BAT activity, whereas there was no change in participants with low BAT activity (training*BAT P = .02; Figure 2B,C). By contrast, training decreased BAT FFA uptake in the low BAT activity group, but not in the high BAT activity group (training*BAT P = .01; Figure 2D,E). There were also no changes in BAT mass or radiodensity (Table 1) before and after training. There was no association between the changes in BAT glucose uptake and changes in VO2peak, or between the changes in BAT glucose uptake and M‐value.
Exercise training resulted in similar increases in quadriceps muscle glucose uptake in participants with both high and low BAT activity (training P = .0009, training *BAT, P = .25, Figure 3A). By contrast, exercise‐induced increases in glucose uptake in femoral WAT tended to be higher in the high BAT compared with the low BAT activity group (training P = .02; training*BAT P = .07; Figure 3B). Training had no effect on muscle FFA uptake in either group (Figure 3C). Interestingly, training affected IL‐6 concentrations differently in the high BAT and low BAT activity groups, with the high BAT activity group having an increase and the low BAT activity group having a decrease in IL‐6 (training*BAT P = .04; Table 1). Epinephrine concentrations increased in both groups after training (training P = .01, training*BAT P = .53; Table 2).
4. DISCUSSION
We investigated the effects of short‐term exercise training (HIIT and MICT) on BAT metabolism in sedentary men using FTHA and FDG PET/CT‐scanning. Training increased aerobic capacity and muscle insulin sensitivity, but, interestingly, decreased BAT insulin‐stimulated glucose uptake in participants who had highly active BAT to start with. We also showed that participants with high BAT activity had a better metabolic profile compared with participants with low BAT activity before training.
To our knowledge, this is the first study in which BAT metabolism has been quantitated before and after a controlled exercise training intervention. Contrary to our hypothesis, we found that 2 weeks of exercise training decreases insulin‐stimulated BAT glucose uptake in participants with high BAT activity before the intervention. Our results are in line with recent cross‐sectional data, showing reduced cold‐stimulated BAT glucose uptake in athletes compared with sedentary subjects.9 Notably, all the participants in the study by Vosselman et al.9 seemed to have high BAT activity based on 18‐FDG uptake values measured using semi‐quantitative standard uptake values. In the present study, instead of standard uptake values, we used quantitative dynamic PET data and performed an intervention study for sedentary participants.16 While most BAT glucose uptake studies in humans use cold exposure, we studied BAT glucose uptake during hyperinsulinaemia, which has been shown to be associated with cold‐induced BAT glucose uptake.17 Insulin stimulation has been shown to increase BAT glucose uptake 5‐fold compared with the fasting state at room temperature in people with functional BAT.6 Indeed, it can be speculated that the participants with high BAT have higher BAT insulin sensitivity.
Although the intervention period in the present study was short, it markedly increased the aerobic capacity and the insulin‐stimulated muscle glucose uptake (muscle insulin sensitivity). As BAT is an insulin‐sensitive tissue, we hypothesized that training would also improve the BAT insulin sensitivity (BAT glucose uptake during insulin stimulation). Interestingly, the results showed that training decreased BAT glucose uptake in the group with higher BAT insulin sensitivity at baseline. BAT is probably not a source of energy during exercise; thus, the question arises of why the human body would reduce BAT substrate uptake after training. We found no change in whole‐body energy consumption and only a tendency towards improved whole‐body insulin sensitivity; thus, to maintain whole‐body homeostasis, one reason for the decreased BAT glucose uptake after the exercise training might be that the body decreases BAT glucose uptake in order to provide substrate to the increased skeletal muscle glucose uptake;18, 19 however, when we tested skeletal muscle glucose uptake as a covariate, we found that the change in skeletal muscle glucose uptake did not explain the decrease in BAT glucose uptake.
In rodents, we have shown that exercise‐trained rats have more glycogen in BAT compared with non‐trained animals (Jessen and Goodyear, unpublished data). Thus, if this is also true in humans, the increased glycogen levels post‐training may inhibit the insulin‐stimulated glucose uptake into BAT, explaining the observed reduction in BAT glucose uptake after the training in the present study.
In rats, 8 weeks of endurance training decreased BAT mass, UCP‐1 expression, and BAT thermogenic activity.20 Thus, it was suggested that the changes in BAT activity after exercise may be attributable to a decreased need for BAT heat production since, during exercise, working muscles produce excess heat.20 In the present study, we did not find any correlation between BAT glucose uptake and BAT mass at baseline or a change in BAT mass after 2 weeks of training intervention.
The radiodensity of BAT is used as a marker of BAT intracellular triglyceride content.21 Lower BAT radiodensity in overweight people with type 2 diabetes compared with healthy lean control subjects has been suggested to indicate a shift towards BAT lipid storage or a lipolytic dysfunction of BAT.22, 23 Acute cold exposure increases BAT radiodensity, indicating a decrease in BAT lipid content.21, 24 We did not find any change in BAT radiodensity, suggesting no exercise‐induced effect on BAT lipid content.
We found that exercise training increased skeletal muscle insulin‐stimulated glucose uptake, but not FFA uptake, which is consistent with previous data.18, 25 Here, we also found that insulin‐stimulated glucose uptake increased in femoral subcutaneous adipose tissue, and the improvement tended to be higher in the HIIT than in the MICT group. Previously, moderate‐ or high‐intensity exercise training has not been found to directly improve insulin‐stimulated glucose uptake in the abdominal or femoral subcutaneous adipose tissue; however, adipose tissue GLUT4 protein expression has been shown to increase in people with type 2 diabetes after 4 weeks of bicycle training26 and previous cross‐sectional studies show that endurance athletes have higher abdominal subcutaneous adipose tissue insulin sensitivity than untrained subjects.27 It is noteworthy that, in the present study, the insulin‐stimulated glucose uptake increased only in femoral subcutaneous adipose tissue and not in other fat depots. Femoral subcutaneous adipose tissue is not involved in muscle contraction as such, but is located in close vicinity to the exercising muscles. It is possible, therefore, that exercising skeletal muscles releases myokines to local adipose tissue depots,19 which may mediate local adipose tissue glucose uptake.
Interestingly, after stratifying participants based on our previously defined cut‐off criteria for BAT activity, we found that those with high BAT and those with low BAT had clear differences in baseline characteristics before the training intervention. The high BAT group in the present study had lower body adiposity and visceral fat mass, along with markedly higher insulin sensitivity and HDL cholesterol concentration, which have all been shown to associate with BAT glucose uptake.4, 28, 29, 30, 31 The high BAT group also had higher whole‐body and muscle insulin sensitivity, as well as higher carbohydrate and lower fat oxidation during hyperinsulinaemia, indicating improved metabolic flexibility in changing from fat oxidation during fasting to carbohydrate oxidation during hyperinsulinaemia. These data support the concept that high baseline BAT activity may protect against adiposity and insulin resistance.
The high BAT group also had lower levels of IL‐6 and leptin, possibly as a result of lower body adiposity and higher levels of MCP‐1. IL‐6 and MCP‐1 are secreted from macrophages, among other tissues, and can have both pro‐ and anti‐inflammatory effects. Elevated levels of these cytokines associate with insulin resistance and are seen in obesity and type 2 diabetes in humans.32, 33 In line with previous studies, the high BAT activity group had lower levels of leptin compared with the low BAT activity group in the present study.34 Indeed, the present study cannot determine whether high BAT activity contributes to a positive profile of adipokines or the opposite; however, the present study highlights that BAT can be a key player in metabolic regulation and a possible target for pharmacological treatment of insulin resistance.
In rodents, BAT has been shown to secrete IL‐6, and exercise‐induced IL‐6 activates subcutaneous adipose tissue beiging.35 Stanford et al.36 have shown that BAT transplantation into the visceral cavity in mice increased circulating IL‐6 levels, which was accompanied by enhanced energy consumption, reduced adiposity and improved glucose homeostasis in the recipient wild‐type but not in IL‐6 knockout mice, indicating that these effects were IL‐6‐dependent. They hypothesized that the IL‐6‐dependent effects may lead to the promotion of lipolysis and increased insulin sensitivity in WAT and the heart through an increase in GLUT1 protein expression.36 In contrast to our findings, Vosselman et al.9 did not find a correlation between IL‐6 and cold‐induced BAT activity in humans.9 Thus, the role of IL‐6 in BAT metabolism and function in humans warrants further investigation.
In summary, the present study suggests that humans with active BAT exhibit a metabolically more favourable phenotype compared with those without active BAT. BAT appears to behave differently from skeletal muscle in response to short‐term exercise training, decreasing insulin‐stimulated BAT glucose uptake. Thus, exercise training may downregulate BAT glucose metabolism in humans. The physiological role for the decreased BAT activation with exercise training will be important to understand given the attention to developing novel activators of BAT for increased energy expenditure and weight loss. The number of participants in the present study was small, and further investigations are warranted to confirm its findings.
Supporting information
Supporting Information
ACKNOWLEDGEMENTS
We thank all the volunteers who participated in this study, the study nurse Mikko Koivumäki, and the staff of the Turku PET Centre and Paavo Nurmi Centre for their excellent assistance in the study.
Conflict of interest
None of the authors has any conflict of interest regarding any aspect of this manuscript.
Author contributions
P. M. contributed to the analysis, results interpretation and writing of the manuscript. V. S., J. J. E., R. J. M., A. M., J. C. H., K. A. V. and J. K. contributed to the acquisition of data. K. K. M., J. J. E., E. L., R. J. M., M. U. D. contributed to data analysis. P. N., L. J. G., R. J. M., J. J., R. P., J. K. and K. K. K. contributed to the study design and critical revision of the manuscript for important intellectual content. J. C. H. contributed to the study design, writing and drafting the manuscript. All authors approved the last version of the manuscript. J. C. H. is the guarantor of this work and, as such, had access to all study data and takes responsibility for the integrity of the data and the data analysis.
Motiani P, Virtanen KA, Motiani KK, Eskelinen JJ, Middelbeek RJ, Goodyear LJ, Savolainen AM, Kemppainen J, Jensen J, Din MU, Saunavaara V, Parkkola R, Löyttyniemi E, Knuuti J, Nuutila P, Kalliokoski KK and Hannukainen JC. Decreased insulin‐stimulated brown adipose tissue glucose uptake after short‐term exercise training in healthy middle‐aged men. Diabetes Obes Metab. 2017;19:1379–1388. https://doi.org/10.1111/dom.12947
Funding Information This study was supported by the Academy of Finland, the University of Turku, Turku University Hospital, and Åbo Akademi University. The study was also financially supported by the European Foundation for the Study of Diabetes, the Emil Aaltonen Foundation, the Hospital District of Southwest Finland, the Orion Research Foundation, the Finnish Diabetes Foundation, the Ministry of Education of the State of Finland, the Academy of Finland (grants 251399 and 256470), EU FP7 project DIABAT (HEALTH‐F2‐2011‐278373), the Paavo Nurmi Foundation, the Novo Nordisk Foundation, and National Institutes of Health Grants R01‐DK099511 and RO1‐DK112283 (to L. J. G.), 5P30DK36836 (Joslin Diabetes Center DERC) and T32‐DK‐07260‐038 (to R. J. W. M)
REFERENCES
- 1. Villarroya J, Cereijo R, Villarroya F. An endocrine role for brown adipose tissue? Am J Physiol Endocrinol Metab. 2013;305:E567‐E572. [DOI] [PubMed] [Google Scholar]
- 2. Klaus S, Casteilla L, Bouillaud F, Ricquier D. The uncoupling protein UCP: a membraneous mitochondrial ion carrier exclusively expressed in brown adipose tissue. Int J Biochem. 1991;23:791‐801. [DOI] [PubMed] [Google Scholar]
- 3. Cinti S. The role of brown adipose tissue in human obesity. Nutr Metab Cardiovasc Dis. 2006;16:569‐574. [DOI] [PubMed] [Google Scholar]
- 4. Chondronikola M, Volpi E, Borsheim E, et al. Brown adipose tissue improves whole‐body glucose homeostasis and insulin sensitivity in humans. Diabetes. 2014;63:4089‐4099. [DOI] [PMC free article] [PubMed] [Google Scholar]
- 5. Virtanen KA, Lidell ME, Orava J, et al. Functional brown adipose tissue in healthy adults. N Engl J Med. 2009;360:1518‐1525. [DOI] [PubMed] [Google Scholar]
- 6. Orava J, Nuutila P, Lidell ME, et al. Different metabolic responses of human brown adipose tissue to activation by cold and insulin. Cell Metab. 2011;14:272‐279. [DOI] [PubMed] [Google Scholar]
- 7. Eskelinen JJ, Heinonen I, Loyttyniemi E, et al. Muscle‐specific glucose and free fatty acid uptake after sprint interval and moderate‐intensity training in healthy middle‐aged men. J Appl Physiol (1985). 2015;118:1172‐1180. [DOI] [PubMed] [Google Scholar]
- 8. Dinas PC, Nikaki A, Jamurtas AZ, et al. Association between habitual physical activity and brown adipose tissue activity in individuals undergoing PET‐CT scan. Clin Endocrinol (Oxf). 2015;82:147‐154. [DOI] [PubMed] [Google Scholar]
- 9. Vosselman MJ, Hoeks J, Brans B, et al. Low brown adipose tissue activity in endurance trained compared to lean sedentary men. Int J Obes (Lond). 2015;39:1696‐1702. [DOI] [PubMed] [Google Scholar]
- 10. Kiviniemi AM, Tulppo MP, Eskelinen JJ, et al. Cardiac autonomic function and high‐intensity interval training in middle‐age men. Med Sci Sports Exerc. 2014;46:1960‐1967. [DOI] [PubMed] [Google Scholar]
- 11. Merilainen PT. Metabolic monitor. Int J Clin Monit Comput. 1987;4:167‐177. [DOI] [PubMed] [Google Scholar]
- 12. Harris JA, Benedict FG. A biometric study of human basal metabolism. Proc Natl Acad Sci U S A. 1918;4:370‐373. [DOI] [PMC free article] [PubMed] [Google Scholar]
- 13. Ouellet V, Routhier‐Labadie A, Bellemare W, et al. Outdoor temperature, age, sex, body mass index, and diabetic status determine the prevalence, mass, and glucose‐uptake activity of 18 F‐FDG‐detected BAT in humans. J Clin Endocrinol Metab. 2011;96:192‐199. [DOI] [PubMed] [Google Scholar]
- 14. Muzik O, Mangner TJ, Leonard WR, Kumar A, Janisse J, Granneman JG. 15O PET measurement of blood flow and oxygen consumption in cold‐activated human brown fat. J Nucl Med. 2013;54:523‐531. [DOI] [PMC free article] [PubMed] [Google Scholar]
- 15. Abate N, Burns D, Peshock RM, Garg A, Grundy SM. Estimation of adipose tissue mass by magnetic resonance imaging: validation against dissection in human cadavers. J Lipid Res. 1994;35:1490‐1496. [PubMed] [Google Scholar]
- 16. Muzi M, O'Sullivan F, Mankoff DA, et al. Quantitative assessment of dynamic PET imaging data in cancer imaging. Magn Reson Imaging. 2012;30:1203‐1215. [DOI] [PMC free article] [PubMed] [Google Scholar]
- 17. Orava J, Nuutila P, Noponen T, et al. Blunted metabolic responses to cold and insulin stimulation in brown adipose tissue of obese humans. Obesity (Silver Spring). 2013;21:2279‐2287. [DOI] [PubMed] [Google Scholar]
- 18. Reichkendler MH, Auerbach P, Rosenkilde M, et al. Exercise training favors increased insulin‐stimulated glucose uptake in skeletal muscle in contrast to adipose tissue: a randomized study using FDG PET imaging. Am J Physiol Endocrinol Metab. 2013;305:E496‐E506. [DOI] [PubMed] [Google Scholar]
- 19. Pedersen BK, Akerstrom TC, Nielsen AR, Fischer CP. Role of myokines in exercise and metabolism. J Appl Physiol (1985). 2007;103:1093‐1098. [DOI] [PubMed] [Google Scholar]
- 20. Wu MV, Bikopoulos G, Hung S, Ceddia RB. Thermogenic capacity is antagonistically regulated in classical brown and white subcutaneous fat depots by high fat diet and endurance training in rats: impact on whole‐body energy expenditure. J Biol Chem. 2014;289:34129‐34140. [DOI] [PMC free article] [PubMed] [Google Scholar]
- 21. Ouellet V, Labbe SM, Blondin DP, et al. Brown adipose tissue oxidative metabolism contributes to energy expenditure during acute cold exposure in humans. J Clin Invest. 2012;122:545‐552. [DOI] [PMC free article] [PubMed] [Google Scholar]
- 22. Blondin DP, Labbe SM, Noll C, et al. Selective impairment of glucose but not fatty acid or oxidative metabolism in brown adipose tissue of subjects with type 2 diabetes. Diabetes. 2015;64:2388‐2397. [DOI] [PubMed] [Google Scholar]
- 23. Pasarica M, Sereda OR, Redman LM, et al. Reduced adipose tissue oxygenation in human obesity: evidence for rarefaction, macrophage chemotaxis, and inflammation without an angiogenic response. Diabetes. 2009;58:718‐725. [DOI] [PMC free article] [PubMed] [Google Scholar]
- 24. Baba S, Jacene HA, Engles JM, Honda H, Wahl RL. CT Hounsfield units of brown adipose tissue increase with activation: preclinical and clinical studies. J Nucl Med. 2010;51:246‐250. [DOI] [PubMed] [Google Scholar]
- 25. Hannukainen JC, Nuutila P, Kaprio J, et al. Relationship between local perfusion and FFA uptake in human skeletal muscle‐no effect of increased physical activity and aerobic fitness. J Appl Physiol (1985). 2006;101:1303‐1311. [DOI] [PubMed] [Google Scholar]
- 26. Hussey SE, McGee SL, Garnham A, Wentworth JM, Jeukendrup AE, Hargreaves M. Exercise training increases adipose tissue GLUT4 expression in patients with type 2 diabetes. Diabetes Obes Metab. 2011;13:959‐962. [DOI] [PubMed] [Google Scholar]
- 27. Stallknecht B, Larsen JJ, Mikines KJ, Simonsen L, Bulow J, Galbo H. Effect of training on insulin sensitivity of glucose uptake and lipolysis in human adipose tissue. Am J Physiol Endocrinol Metab. 2000;279:E376‐E385. [DOI] [PubMed] [Google Scholar]
- 28. Saito M, Okamatsu‐Ogura Y, Matsushita M, et al. High incidence of metabolically active brown adipose tissue in healthy adult humans: effects of cold exposure and adiposity. Diabetes. 2009;58:1526‐1531. [DOI] [PMC free article] [PubMed] [Google Scholar]
- 29. Matsushita M, Yoneshiro T, Aita S, Kameya T, Sugie H, Saito M. Impact of brown adipose tissue on body fatness and glucose metabolism in healthy humans. Int J Obes (Lond). 2014;38:812‐817. [DOI] [PubMed] [Google Scholar]
- 30. Wang Q, Zhang M, Xu M, et al. Brown adipose tissue activation is inversely related to central obesity and metabolic parameters in adult human. PLoS ONE. 2015;10:e0123795. [DOI] [PMC free article] [PubMed] [Google Scholar]
- 31. Cypess AM, Lehman S, Williams G, et al. Identification and importance of brown adipose tissue in adult humans. N Engl J Med. 2009;360:1509‐1517. [DOI] [PMC free article] [PubMed] [Google Scholar]
- 32. Dela F, Stallknecht B. Effect of physical training on insulin secretion and action in skeletal muscle and adipose tissue of first‐degree relatives of type 2 diabetic patients. Am J Physiol Endocrinol Metab. 2010;299:E80‐E91. [DOI] [PubMed] [Google Scholar]
- 33. Wellen KE, Hotamisligil GS. Obesity‐induced inflammatory changes in adipose tissue. J Clin Invest. 2003;112:1785‐1788. [DOI] [PMC free article] [PubMed] [Google Scholar]
- 34. Zhang Q, Ye H, Miao Q, et al. Differences in the metabolic status of healthy adults with and without active brown adipose tissue. Wien Klin Wochenschr. 2013;125:687‐695. [DOI] [PubMed] [Google Scholar]
- 35. Knudsen JG, Murholm M, Carey AL, et al. Role of IL‐6 in exercise training‐ and cold‐induced UCP1 expression in subcutaneous white adipose tissue. PLoS ONE. 2014;9:e84910. [DOI] [PMC free article] [PubMed] [Google Scholar]
- 36. Stanford KI, Middelbeek RJ, Townsend KL, et al. Brown adipose tissue regulates glucose homeostasis and insulin sensitivity. J Clin Invest. 2013;123:215‐223. [DOI] [PMC free article] [PubMed] [Google Scholar]
Associated Data
This section collects any data citations, data availability statements, or supplementary materials included in this article.
Supplementary Materials
Supporting Information