Abstract
Sickle cell disease (SCD) is an inherited blood disorder caused by a β globin gene mutation of hemoglobin (HbS). The polymerization of deoxyHbS and its subsequent aggregation (into long fibers) is the primary molecular event which leads to red blood cell (RBC) sickling and ultimately hemolytic anemia. We have recently suggested that HbS oxidative toxicity may also contribute to SCD pathophysiology due to its defective pseudoperoxidase activity. As a consequence, a persistently higher oxidized ferryl heme is formed which irreversibly oxidizes “hotspot” residues (particularly βCys93) causing protein unfolding and subsequent heme loss. In this report we confirmed first, the allosteric effect of a newly developed reagent (Di(5-(2,3-dihydro-1,4-benzodioxin-2-yl)-4H-1,2,4-triazol-3-yl)disulfide (TD-1) on oxygen affinity within SS RBCs. There was a considerable left shift in oxygen equilibrium curves (OECs) representing treated SS cells. Under hypoxic conditions, TD-1 treatment of HbS resulted in an approximately 200 sec increase in the delay time of HbS polymerization over the untreated HbS control. The effect of TD-1 binding to HbS was also tested on oxidative reactions by incrementally treating HbS with increasing hydrogen peroxide (H2O2) concentrations. Under these experimental conditions, ferryl levels were consistently reduced by approximately 35% in the presence of TD-1. Mass spectrometric analysis confirmed that upon binding to βCys93, TD-1 effectively blocked irreversible oxidation of this residue. In conclusion, TD-1 appears to shield βCys93 (the end point of radical formation in HbS) and when coupled with its allosteric effect on oxygen affinity may provide new therapeutic modalities for the treatment of SCD.
Graphical abstract

Introduction
Sickle cell disease (SCD) is caused by a single amino acid substitution (Glu→Val) at position 6 in the β globin chain of hemoglobin (Hb). By reducing deoxygenated sickle Hb (deoxyHbS) solubility, this hydrophobic substitution triggers polymer formation inside red blood cells (RBCs) (1). Specifically, intracellular HbS polymerizes (at low oxygen tension) when a hydrophobic Val6 of one deoxy β subunit comes in close proximity to another β subunit with similar hydrophobic amino acids (e.g. Phe85 and Leu88) (2). The resulting Hb polymers cause biconcave RBCs to collapse into “sickle” shaped cells; sickling and unsickling cycles lead to irreversibly sickled cells (ISCs) which are more prone to hemolysis.
SCD pathophysiology is clinically characterized by chronic hemolysis, intermittent vaso-occlusion and increased susceptibility to infection (3). Several molecular mechanisms involving HbS have recently been proposed to contribute to a high oxidative burden in sickle cell patients (4). Studies have indicated that oxidative stress caused by these mechanisms may also play a significant role in the pathophysiology of SCD-related microvascular dysfunction, vaso-occlusion, and development of organ damage (4).
An early report documented that HbS is oxidatively less stable than HbA to heat, oxidants, and mechanical shaking (4). These oxidation-related mechanisms were suggested to contribute to disease pathophysiology and have recently been shown in another study to also occur in transgenic SS mice (HbSS). In these experiments, the effects of Hb oxidation on venules (as they undergo stasis with little or no blood flow) were monitored in the microcirculation (5). Infusion of Hb or hemin/heme1 triggered vaso-occlusion in Townes sickle cell mice but not in control wild type mice (HbAA-Townes control mice) (5). Furthermore, an infusion of metHb (but not cyanometHb in which the iron is blocked by cyanide) also induced vaso-occlusion. Free heme (released from metHb) elicited vaso-occlusion (stasis) in transgenic SS mice by binding to the endothelial Toll-like receptor-4 (TLR4) (5).
In the presence of H2O2 (a major oxidant) Hb oxidizes to higher oxidation states (ferryl), as it consumes H2O2. However, Hb, unlike classic peroxidases (e.g. cytochrome oxidase, prostaglandin H synthase), is unable to harness its own damaging radicals and has thus been classified as a pseudoperoxidase (6). In a recent study, we have found that HbS exhibits unique oxidative chemistry (7). When HbS recycles between ferric and ferryl iron in the presence of H2O2 (unlike HbA) it tends to remain in solutions longer in the ferryl state. This slower reduction means a greater concentration of the reactive ferryl form which not only oxidizes subunits within the Hb protein but also target cellular components within close proximity (7). However, in the case of HbA (where autoreduction is rapid) lesser damage may occur to the protein and other molecules. A persistent ferryl heme and its radical creates an oxidative milieu leading to the following: (a) heme attachment to nearby amino acids, (b) irreversible oxidation of “hotspot” amino acids including βCys93, (c) structural instability that leads to heme loss, and finally (d) oxidative damage to other cell components such as mitochondria (7).
It has been previously reported that βCys93 may play a role in the redox state of the β chain heme iron. Modifying βCys93 may therefore modify the Hb oxidation rate (8). Di(5-(2,3-dihydro-1,4-benzodioxin-2-yl)-4H-1,2,4-triazol-3-yl)disulfide (TD-1) is a novel small molecule and monomeric unit of TD-1 (MU) that covalently binds to βCys93 and βCys112. This binding induces a marked increase in the oxygen affinity of human Hb and reduces hypoxia-induced sickling of RBCs (9).
In this report, we tested whether TD-1 through its binding to βCys93 (one of the major oxidative “hotspots” in the β subunit) is able to suppress Hb oxidative side reactions and therefore act as an antioxidant. We present oxygen equilibrium, photometric and mass spectrometric analyses identifying the dual allosteric and antioxidant nature of TD-1 which may have therapeutic benefits.
Experimental
Protein purification and handling
Fresh blood samples from sickle cell patients (SS) who were not given hydroxyurea and from ethnically matched volunteers attending NHLBI/NIH clinics with consent were obtained for this study after IRB approval was given. Wild type hemoglobin (HbA) used in this study was prepared as previously described (10). Sickle cell Hb (HbS) was purchased from Sigma Aldrich (St. Louise, Missouri, US) and its purity was verified by isoelectric focusing and reversed phase-HPLC. Hb concentrations were determined spectrophotometrically and were based on ε = 16.61 mM−1cm−1 at 576 nm for oxy (HbO2), 3.78 mM−1cm−1 at 630 nm for ferric (met) Hb per heme with a molecular weight of 16,000 g/mol of heme (10). Unless otherwise stated, the Hb concentration was given as heme equivalents and the final compositions of the solvent for all measurements were carried out in potassium phosphate buffer (50 mM of phosphate, pH 7.4) at 22 °C.
H2O2 (30 wt%) was purchased from Sigma. Dilute solutions of H2O2 were prepared fresh daily from stock solutions by making appropriate dilution in deionized water and kept on ice. The concentration of H2O2 was determined spectrophotometrically at 240 nm using a molar extinction coefficient of 43.6 M−1cm−1(11).
Buffer solutions were prepared by mixing solid monobasic and dibasic potassium phosphate dissolved in deionized water and the pH was adjusted appropriately. High concentration phosphate buffer, 1.8 M, was used for the gelation experiments. These solutions were made by dissolving solid monobasic and dibasic potassium phosphate in distilled, deionized water with the final pH adjusted to 7.3. For experiments under deoxygenated conditions, samples were purged with nitrogen for 30 min, and sodium dithionite (2.8 mM) was added. Unless otherwise indicated, all Hb samples were incubated for 15 minutes at 37°C with TD-1 prior to experimental studies. Fresh TD-1 solutions dissolved in dimethyl sulfoxide (DMSO) were prepared for every experiment; DMSO content in the final Hb solution for all the assays was maintained at or less than 1%.
Oxygen Equilibrium Studies
Oxygen equilibrium curves (OECs) of SS cell suspensions or Hb solutions were determined using an automated Hemox™ Analyzer (TCS Scientific Corp). HbA or HbS (240 μM), were incubated for 15 minutes with TD-1 (60 μM) at 37 °C. For OEC analysis, Hb (70 μM) samples were prepared using 10 mM potassium phosphate/0.1M NaCl pH 7.4 buffer. For RBCs OEC analysis, whole blood was washed with PBS and re-suspended with the patient plasma to a hematocrit value of approximately 20%. The RBC suspensions (120 μL) were then incubated with TD-1 (2 mM) at 37°C for 15 minutes and mixed with 3 mL of the Hemox buffer solution (TCS scientific Corp), 135 mM NaCl, 5 mM KCl, and 30 mM Tes, pH 7.4. The Hemox solution also contained D-Glucose-6-Phosphate, Glucose-6-Phosphate Dehydrogenase + β-Nicotinamide adenine dinucleotide phosphate Monosodium Salt, Ferredoxin, Ferredoxin-NADP+ Reductase, Catalase (Bovine). 120 μL of the 20% RBC suspension with 3 mL Hemox buffer solution was used as a control. The oxygenation parameters, P50 (the partial pressure of oxygen at which Hb is half-saturated) and n (the Hill coefficient) were derived from these curves. Data analysis was performed using nonlinear least-squares curve fitting of the Adair equations derived from the Hemox Analyzer software (P50 Plus, Version 2.00.14) provided by the manufacturer.
Polymerization Kinetic Measurements
To determine the effects of TD-1 on the delay time, polymerization progress curves were carried out using a temperature-jump technique following a previously described method (12). OxyHbS (150 μM/heme) solutions were incubated for 15 min at 37°C with and without TD-1 (450 μM) and the mixture was cooled down to 0°C. Anaerobic photometric cuvettes (with a 1-cm path length) and a rubber cap were used for the photometric study. A 1 ml phosphate buffer (1.8 M, pH 7.3) and Sodium dithionite (Na2S2O4) (0.5 mg) were added to the cuvette and sealed. Two needles were inserted into the rubber cap for gas inlet and outlet. A flow of nitrogen gas was then bubbled through the needle into the solution for 30 min with gentle shaking to ensure that Na2S2O4 was dissolved. The temperature of the cuvette was brought to 0°C immediately. A stock Hb solution was treated with TD-1 (parallel with a non-treated control) and then aliquoted (at 0°C) in the cuvettes through a rubber septum with a Hamilton gas-tight syringe. The cuvette was then placed in a preheated sample holder in the spectrophotometer (30°C). The change in turbidity was measured with a temperature-controlled photodiode array spectrophotometer (Agilent 8453, Santa Clara, California, US) at 700 nm. Optical density at 700 nm (on the y-axis) was plotted against time (on the x-axis abscissa). The intercept of the slope with the abscissa was determined as the polymerization delay time (td) (13).
Spectrophotometry
Oxidative stability of HbS with and without TD-1 treatment was examined using a temperature-controlled photodiode array spectrophotometer (Agilent 8453, Santa Clara, California, US).
Autooxidation Kinetics
To monitor spontaneous oxidation of ferrous to ferric form, Hb solutions (60 μM) were incubated at 37°C in a sealed cuvette in air equilibrated 50 mM phosphate, buffer (pH 7.4) with or without TD-1 (60 μM) (14). Absorbance spectra between 350 and 700 nm were recorded every 5 minutes for 24 h during incubation time. The absorbance changes at 576 nm due to oxidation of oxyHb were plotted over time and were then analyzed by nonlinear least-square curve fitting to single exponential equations using Microsoft Excel program to obtain autooxidation rate constants. Rate constants with standard deviations were obtained by averaging data from at least three different sets of experiments.
Hydrogen Peroxide-mediated Oxidation
H2O2-induced ferryl Hb species formation was evaluated following our previously-described method (10). First, TD-1 (60 μM) was mixed with HbS (60 μM) in a cuvette and incubated for 15 min at 37 °C. The mixture was then brought to room temperature and subsequently treated with increasing concentrations of H2O2 (0, 60 μM, 150 μM, 300 μM, or 600 μM) for 5 min of incubation at 25°C. Catalase (200 units/mL) was added to the solution to terminate the oxidation reactions. Absorbance spectra between 350 and 700 nm were measured to monitor the reactions. For verification of the ferryl intermediate, 2 mM sodium sulfide (Na2S) was added immediately to derivatize the ferryl heme into sulfHb that could then be monitored by the appearance of an absorbance band at 620 nm. A stock solution of 2 mM sodium sulfide (Na2S) in phosphate a buffer solution (50 mM, pH 7.4) was first prepared using a molar mass of 240.18 g/mol for Na2S. The concentration of sulfHb was calculated using an extinction coefficient of ε(620nm) = 24.0 mM−1cm−1 (15).
Reverse Phase HPLC (RP-HPLC)
RP-HPLC analyses were performed on a Zorbax 300 SB C3 column (4.6 × 250 mm) using a Waters HPLC system which consists of a Waters 626 pump, 2487 dual-wavelength detector and a 600 s controller installed with Empower 2 software (Waters Corp, Milford, MA). The mobile phase consisted of solvent A (0.1% trifluoroacetic acid in water) and solvent B (0.1% trifluoroacetic acid in acetonitrile). The HPLC software was configured to deliver a mobile phase gradient consisting of 65% (A)/35% (B) to 53% (A)/47 % (B) over 80 minutes. Hb (25 μg) was injected into the C3 column with a mobile phase flow rate set of 1mL/min and absorbance was monitored at 280 nm and 405 nm for protein and heme respectively.
Mass Spectrometric Analysis
Binding studies of TD-1
TD-1 binding studies were performed on three separate samples including 1) a βCys93 synthetic peptide GTFATLSELHCDKLHVDPENFR (synthesized by FDA Core Facility for Biotechnology Resources) 2) intact HbS and 3) trypsinized HbS. The synthetic peptide is a tryptic mimic representing residues 82–104 (contains Cys93) that result from trypsin digestion of the β subunit. HbS (control) and HbS incubated with a 2:1 molar ratio of TD-1 were typically digested, desalted, and analyzed by LC/MS/MS as previously described (16) with the modification of excluding DTT from the trypsinization prep.
Spin trap labeling experiments
Spin trap labeling experiments (with a 2:1 molar ratio of TD-1 to HbS in 100 mM ammonium bicarbonate, pH 8.0) were subjected to a ten molar excess of H2O2 in the presence of 5,5-dimethyl-1-pyrroline N-oxide (DMPO) (100 mM) at 37 °C for 2 h. Briefly, the βCys93 containing tryptic mimic and trypsinized HbS mixture were analyzed (three technical replicates for each sample) by reverse phase liquid chromatography mass spectrometry (RP LC/MS/MS) using an Easy nLC II Proxeon nanoflow HPLC system coupled online to a Q-Exactive Orbitrap mass spectrometer (Thermo Scientific). Data were acquired using a top 10 method (for 65 minutes), dynamically choosing the most abundant precursors (scanned at 400–2000 m/z) from the survey scans for HCD fragmentation. Hb tryptic data (used to identify TD-1, oxidation and DMPO modifications) were searched against the human Swiss-Prot database (20,202) sequences; downloaded July 10th 2016 with a 20 ppm parent and fragment ion mass tolerance using the Mascot search engine and Scaffold 4.40 software as previously described (16) with the following criteria set to Mascot searches: variable modifications including the monomer molecular mass of TD-1 (234 Da), cysteine trioxidation (+48 Da), tyrosine oxidation (+16 Da), and methionine oxidation (+16) for identifying “hotspot” oxidation and DMPO (5,5-dimethyl-1-pyrroline N-oxide) labeled cysteine and tyrosine (+111Da) were included as variable modifications for all DMPO treated samples.
Intact Mass Analysis
Subunits of intact HbS (with and without the treatment of TD-1) were isolated using RP-HPLC and then lyophilized prior to LC-MS analysis. Samples were analyzed using the LC/MSMS setup described above accept that the Q-Exactive was configured to acquire data in Full-MS mode. Isotopically resolved charge state envelopes (multiply charged ions of intact monomers) representing mass spectra of intact Hb subunits were deconvoluted using the protein deconvolution software Xtract (Thermo Scientific). The deconvoluted mass spectrum yielded a measured molecular mass that was within 0.025 Da (3 ppm) of the calculated value.
Results
Oxygen equilibrium studies
In the presence of TD-1 both HbA and HbS solutions revealed similar left shift in their OECs. When HbS or HbA (240 μM) were mixed with TD-1 (60 μM) at 37 °C, the P50 value decreased by approximately 6 mmHg compared to control non-treated samples (data not shown). Figure 1A shows typical OECs representing suspension of normal adult human red cells (AA) with and without TD-1. There was an approximate 13 mmHg drop in the P50 value of AA cells afterTD-1 addition; the sigmoidal nature of the curve was clearly maintained with a Hill coefficient (n = 2.07). OECs representing suspensions of blood from SCD patients are shown in Figure 1B. There was an approximate 20 mmHg drop in the P50 values of SS cells with slightly reduced cooperativity in the OECs (from n= 1.75 to 1.58). The data in Figure 1 collectively show that TD-1 induced changes in the position and OEC shape of both SS and AA suspensions in agreement with previously reported observations on the oxygen affinity lowering effects of this compound (9). The P50 and n values for both AA and SS cells are summarized in Table 1. These tabulated results confirm the ability of TD-1 to permeate the RBC membrane to interact with intracellular Hb and modifying its oxygen affinity.
Figure 1. TD-1 effects on normal and sickle red blood cells oxygen equilibrium curves (OECs).
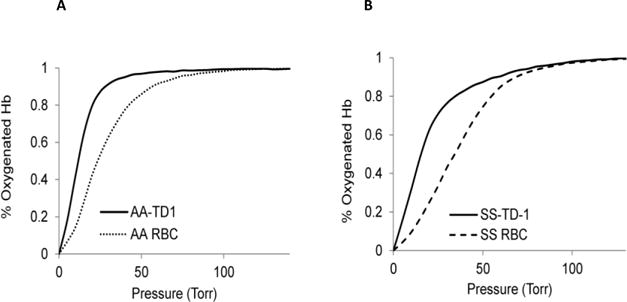
(A) A representative OEC of whole blood (AA) with or without TD-1. (B) The OEC of whole SS blood with or without TD-1. Hematocrit was adjusted to 20% and cells were incubated with 2mM TD-1 at 37°C for 15 min prior to determination of the OEC. 120 μl of this solution was mixed with 3ml of Hemox buffer solution. The control is non treated 20% hematocrit solution mixed with the Hemox buffer solution.
Table 1.
Effects of TD-1 treatment on oxygen binding characteristics and autoxidation rates of hemoglobin and red blood cells
| Sample | P50 of RBCs (mmHg) | Hill Coefficient (n) | Rate constant of autooxidation of Hb (h−1) |
|---|---|---|---|
| HbS without TD-1 | 35.30 | 1.75 | 0.039 ± 0.01 |
| HbS with TD-1 | 15.36 | 1.58 | 0.045 ± 0.02 |
| HbA without TD-1 | 25.22 | 1.98 | 0.035 ± 0.02 |
| HbA with TD-1 | 11.68 | 2.07 | 0.05 ± 0.01 |
Whole blood samples from a sickle cell patient and ethnically matched control (approximately 20% Hct) were incubated with TD-1 (2 mM) for 15 min in Hemox buffer, pH 7.4. The rate constant of autoxidation for HbS and HbA (n=3) were determined in 50mM phosphate buffer, pH 7.4.
Polymerization kinetic measurements
Delay time is defined as the time between introduction of deoxygenation and the appearance of polymers (13, 17). The kinetic results reported here were derived from temperature-jump experiments measured during light scattering (at 700 nm) which reflects Hb polymerization. For each experiment spectrophotometric analysis was used (at time zero) to confirm complete deoxygenation of Hb (10). The increase in turbidity (at 700 nm) at various time points (for each protein concentration) was plotted as a function of time to generate typical sigmoidal curves shown in Figure 2A as previously reported; the polymerization delay time (td) decreased as the protein concentration increased and was further prolonged upon Hb dilution. A 300 μM Hb solution began to aggregate in about 60 seconds while 80 μM Hb began aggregating after approximately 1500 seconds. As illustrated in Figure 2B, TD-1 (450 μM) addition to HbS (150 μM) solution resulted in an increase in delay time as reflected by a right shift in the curve. The polymerization of native deoxyHbS in the absence of TD-1 aggregated after approximately 300 seconds while in the presence of TD-1 it aggregated approximately after 500 seconds. These results suggest that TD-1 induces longer delay in the polymerization of HbS solution by 200 seconds.
Figure 2. TD-1 effects on the kinetics of deoxyHbS polymer formation.
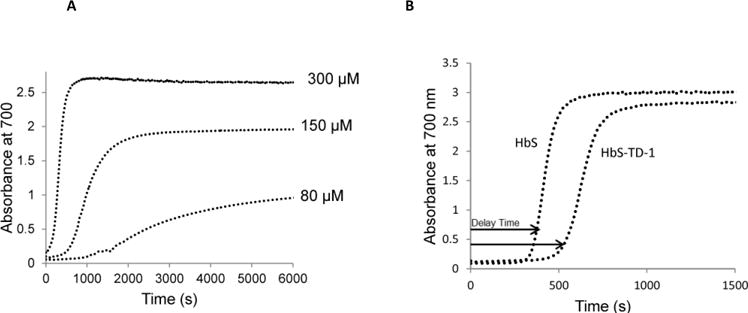
(A) Concentration dependent aggregation of deoxyHbS in 1.8 M phosphate buffer. Solutions of deoxyHb in a range of concentrations (80 μM, 150 μM, 300 μM) were rapidly heated from 0°C to 30°C. Turbidity was measured spectrophotometrically by recording the absorbance at 700 nm. (B) Polymerization of deoxyHbS solution (150 μM) in the presence and absence of TD-1 (450 μM) were measured from 0°C to 30°C. Turbidity was measured spectrophotometrically by recording the absorbance at 700 nm.
Effects of TD-1 on the autooxidation of sickle cell hemoglobin
OxyHb (HbO2) undergoes autooxidation, in which the oxygen-bound ferrous heme iron atom spontaneously oxidizes to the ferric state, generating a mixture of protonated and anionic superoxide radicals. H2O2 is produced during the Hb autooxidation by superoxide dismutation (18, 19). We studied the effects of TD-1 binding on HbS autooxidation by following the formation of metHb via spectral changes in the visible wavelength region (Figure 3A) for 24 h. Individual autooxidation rate constant estimates were obtained by fitting the initial phase of the normalized absorbance decreases at 576 nm to single-exponential expressions (Figure 3B). Table 1 summarizes the initial averaged autooxidation rate constants (for the first 8 h). Under experimental conditions, the absence of TD-1 resulted in an HbS autoxidation rate constant of 0.039 h−1; whereas in the presence of TD-1 the autooxidation rate constant increased to 0.045 h−1. Similarly, in the presence and absence of TD-1, the autooxidation rates of HbA were 0.05 h−1 and 0.035 h−1, respectively. Overall, TD-1 appears to have little or no effects on Hb autooxidation kinetics.
Figure 3. HbS autooxidation kinetic reactions in the presence and absence of TD-1.
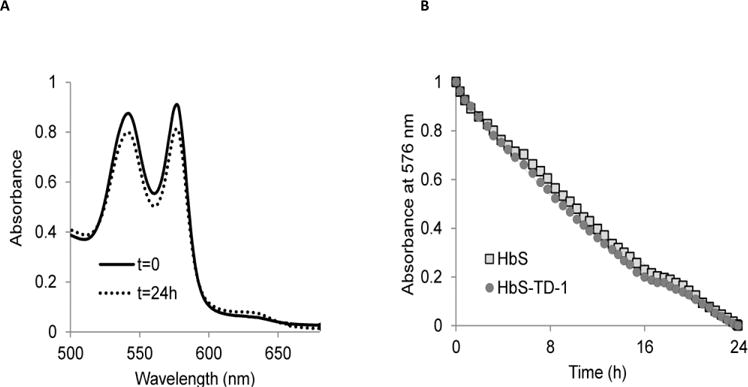
(A) A typical time-dependent spectra recorded during HbS autooxidation (60 μM, heme) at time 0 (solid line) and after 24h incubation (dotted line) in 50mM potassium phosphate buffer pH 7.4 at 25 °C for 24h. Spectral changes were measured during HbS autooxidation in the presence and absence of TD-1 (60 μM). (B) Time courses for HbS autooxidation in the presence and absence of TD-1. Normalized absorbance decreases at 576 nm were fitted to a single-exponential expression to calculate the rate of autooxidation (circles and squares represent time courses in the presence and absence of TD-1 respectively).
Effects of TD-1 on hydrogen Peroxide-induced oxidation of sickle cell hemoglobin
The reaction of HbO2 with bolus amount of H2O2 results in the formation of a transient oxyferryl Hb intermediate (HbFe4+) (20). In our experiments, this transient ferryl heme was captured prior to its decay to metHb; the addition of sodium sulfide (Na2S) was utilized to convert the ferryl species to a spectrally more distinct and stable sulfHb, which exhibits a strong and unique optical absorbance band with a wavelength maximum (λmax) of 620 nm. (15). Figure 4A shows a typical spectral transition in the reaction of ferrous HbS (60 μM) with H2O2 (150 μM) representing ferryl formation before Na2S addition to the reaction mixture. The ferryl level was estimated to be 28 μM in the HbS solution (Figure 4A). After adding sodium sulfide to the sample, the spectrum pattern was changed to the pattern of sulfHb (15). Figure 4B overlays the sulfHb spectra of HbS obtained before and after treatment with TD-1. TD-1 reduced ferryl heme from 28 μM to 10 μM after 15 min incubation.
Figure 4. Spectral analysis of TD-1 effect on ferryl hemoglobin formation.
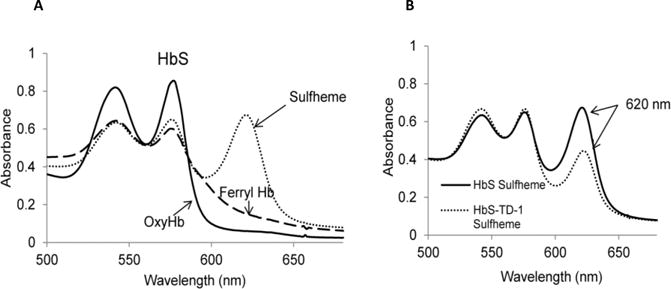
(A) Absorbance spectra obtained upon treatment of HbS (60 μM)(solid line) with 150 μM H2O2. Ferryl Hb spectrum (dashed line) was characterized by new emerging peaks at 544 nm and 585 nm respectively and a flattened region between 600 to 700 nm. Absorbance spectra were obtained immediately after addition of Na2S (2 mM) to convert HbS to sulfHb (dotted) that exhibits a characteristic strong peak at 620 nm. (B) Overlaid sulfHb spectra of HbS (60 μM) treated (dashed line) and non-treated with TD-1 (60 μM)(solid line).
Next we tested the ferryl reducing ability of TD-1 as a function of H2O2 (Figure 5A) and TD-1 concentrations (Figure 5B). The data in Figure 5A indicate a considerable reduction (ranging between approximately 30–35%) in ferryl HbS in response to TD-1 treatment. This is supported by Figure 5B which shows that ferryl Hb produced in these solutions decreased as the concentration of TD-1 increases.
Figure 5. Effects of TD-1 on the levels of ferryl hemoglobin formation.
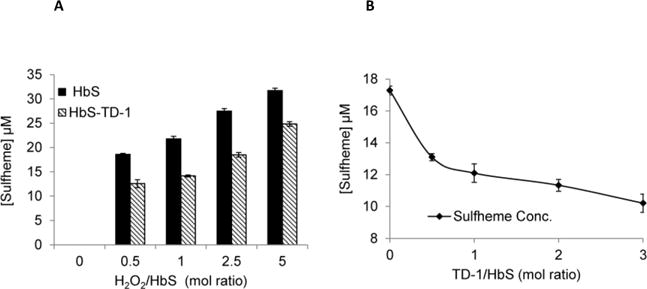
(A) Calculated values for sulfHb using extinction coefficient are plotted in a bar graph; non-treated HbS (solid black) and TD-1 treated (pattern). (B) Calculated values of sulfHb of HbS treated with various concentrations of TD-1 (30 μM, 60 μM, 120 μM or 180 μM TD-1); sulfheme concentration versus TD-1 ratio to Hb was plotted.
HPLC analysis
The covalent binding of TD-1 to HbS was evaluated using RP-HPLC by recording absorbance at 280 nm and 405 nm so as to monitor α, β chains of HbS and heme integrity, respectively. The α and β globin chains, and the heme moieties of HbS were separated into three distinct peaks, similar to early reported HbA and HbS chromatographic profiles (10) (as shown in the first two panels of Figure 6). The heme peaks for HbA, TD-1 treated and non-treated HbS all eluted at 16.7 minutes (not shown). The βs and α chain of HbS eluted at 40.0 and 44.0 minutes, respectively. After treating with 2 fold excess of TD-1 to Hb (in heme), the βs peak (40.0 minutes) completely disappeared and a new peak centered at 43.6 minutes appeared as can be seen at the bottom panel of Figure 6. This new peak is the modified β (β-TD-1) as confirmed by our mass spectrometric analysis. There was no shoulder peak at 44.0 minutes indicating that α chains were also modified by TD-1 and eluted at about 47 minutes (α-TD-1). The right shift in retention times were due to an increase in hydrophobicity of the modified globins. A small peak was observed at an elution time of 36.0 minutes representing the leaving organic molecule on TD-1 during covalent attachment with cysteine in Hb (mass spectrometer data not shown). These peak assignments are confirmed by our mass spectrometric analysis showing that two monomeric units of TD-1 (MU) are bound to the β subunit, and one MU is bound to the α subunit.
Figure 6. Reversed HPLC analysis of TD-1 treated HbS.
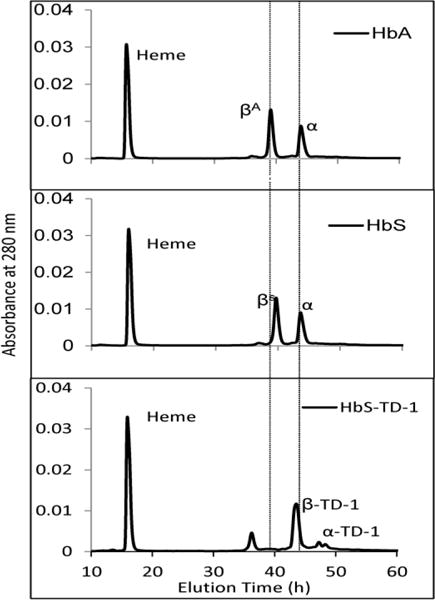
Hb (25 μg) was injected into C3 column. HbS (60 μM) was incubated with TD-1 (120 μM) for 15 min at 37 °C. The mobile phase consisted of (A) 0.1% TFA in water and (B) 0.1% TFA in acetonitrile. A gradient was programmed to deliver 65% (A)/35% (B) to 53% (A)/47 %(B) over 80 minutes. Solvents were mixed and run at a rate of 1 mL/min and absorbance was monitored at 280 nm and 405 nm. Control HbA and HbS monitored at 280 nm are shown on first and second panels, respectively, with β and α globin chains. The bottom panel shows the profile of HbS treated with TD-1.
Mass Spectrometric analysis
Mass spectrometry was utilized to specifically identify the nature of TD-1 interactions with HbS. βCys93 has previously been proposed to be one of the sites of modification by TD-1. We, therefore, performed a set of experiments to evaluate TD-1 binding to βCys93 by incubating TD-1 (2:1 molar excess) with a synthetic β tryptic peptide (residues 82-104; C93 located in center) GTFATLSELHCDKLHVDPENFR. This peptide is a mimic of the βCys93 containing peptide that occurs after trypsinization of Hb. Figure 7 shows full MS scan data representing peptide charge states for the tryptic peptide mimic control without (Panel A) and after incubation with TD-1 (Panel B). Manual calculation of the peptide charge state masses in both panels indicate that TD-1 is covalently attached; TD-1 treatment specifically resulted in a 234 Da mass shift equivalent to the TD-1 monomer (MU) molecular weight (9). Because covalent attachment of TD-1 involves a disulfide linkage the only possible modification site on this peptide is the cysteine residue (which represents Cys93 in the β subunit primary sequence). Another important outcome of TD-1 treatment is the presence of a single TD-1 modified peptide species (Panel B) which indicates that the TD-1 modification is complete.
Figure 7. Full MS scans of synthetic β tryptic peptide (residues 82-104; C93 located in center) GTFATLSELHCDKLHVDPENFR.
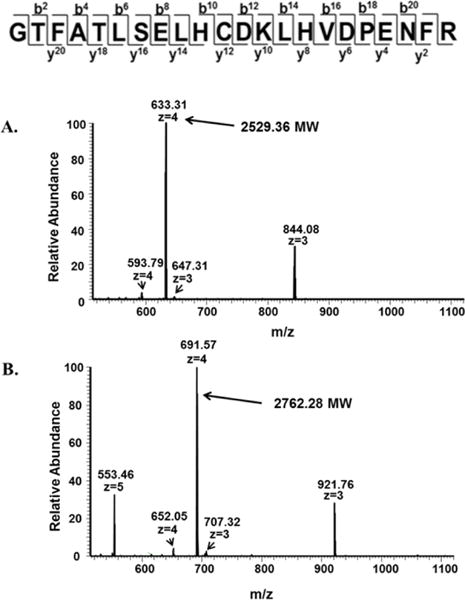
Samples representing the β tryptic mimic were analyzed by LC/MS. (A) Full MS scan data of peptide charge states for the tryptic peptide mimic control (without TD-1). (B) Full MS scan data of the β tryptic mimic incubated with two fold excess of TD-1. Manual calculation of the peptide charge state masses in both panels indicate that TD-1 is covalently attached; TD-1 treatment specifically results in a 234 Da mass shift equivalent to the TD-1 monomer molecular weight.
As a follow-up, we incubated HbS (with and without 10 fold excess H2O2 to heme equivalent) with TD-1 and trypsinized the protein to form tryptic peptides that were then analyzed by LC/MS/MS analysis. Searching these LC/MS/MS TD-1 data against the human database (using the database Mascot search engine) failed to identify the presence of βCys93 (modified or unmodified) containing tryptic peptides. The absence of any detectable HbS βCys93 (or βCys112) indicates that TD-1 attachment is likely impeding digestion of the protein possibly by perturbing trypsin’s ability to bind (increased hydrophobicity potentially reduces urea induced unfolding and subsequent exposure of tryptic sites) and and cleave at the βCys93 region. The absence of unmodified C93 (like the peptide mimic data) indicates complete TD-1 modification stoichiometry. The fact that we did not see oxidized βCys93 in samples also treated with H2O2 indicates that the TD-1 modification is blocking C93 oxidation and in the process is essentially acting as an antioxidant. This is further substantiated by the fact that we detected βC93 oxidation for the controls; the control data for HbS and HbA C93 oxidation (10X H2O2) yielded 62.9 ± 2.4% and 34.6 ± 0.7% oxidized C93 thiols (cysteic acid) respectively.
To confirm the antioxidant properties of TD-1 we utilized the spin trap DMPO. When Hb is exposed to H2O2, a highly reactive Hb centered radical is required for DMPO to form an active nitroxide radical adduct; this adduct reacts with βCys93 (sidechain thiol is tri-oxidized to cysteic acid) which is further oxidized to the corresponding globin radical derived nitrone adduct in the presence of the ferryl moiety. These adducts can be quantitatively analyzed by LC/MS/MS analysis (7). Under conditions where HbS was incubated with TD-1 (prior to addition of H2O2) we did not detect DMPO labeled βCys93 peptides. The presence of DMPO labeled peptides were only identified in control samples; the DMPO labeling control data for HbS and HbA yielded 43.7% ± 5.6% and 35.5 ± 5.4% oxidized C93 thiols respectively. We next analyzed the intact mass of HPLC separated β subunits. Figure 8 shows the deconvoluted spectra representing the intact mass of the β subunit with two TD-1 attachments (MU). The presence of a single peak (16304.42) indicates only one modified species; we were unable to identify singly or unmodified forms in the β isolated fractions. These results support earlier crystal structure data implicating βCys93 and βCys112 to be labeled by TD-1. We also identified the α subunit with a single TD-1 modification and the unmodified form that differs in mass by 234 Da (MU) (data not shown).
Figure 8. Intact Mass Analysis of HPLC isolated HbS β fractions incubated with TD-1.
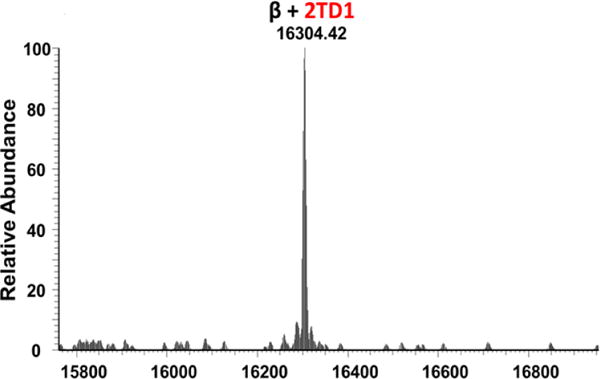
HbS subunits were separated using HPLC and then analyzed for intact mass determination. The figure shows the deconvoluted spectra representing the intact mass of a single species representing the β subunit with two MU attached.
Discussion
It is well recognized that sickling/unsickling cycles result in the production of higher levels of reactive oxygen species (ROS) within SS RBCs (4). Similarly, RBC antioxidative enzymes activities (primarily SOD and catalase) increase in response to increased oxidative stress due to buildup of ROS (21). A recent study revealed a defective oxidative environment that included the presence of up-regulated NADPH oxidase catalytic subunits (22). This unique oxidative environment within SS RBCs Hb oxidation and the build-up of associated oxidative intermediates proceed at higher rates (23). Ferryl HbS, recently detected in malaria-infected SS RBCs, was found to oxidatively damage the actin cytoskeleton within the host cell cytoplasm thus preventing parasitic infection. Although this mechanism appears to explain how HbS may confer protection against malaria, it also serves to show that Hb oxidative reactions (including the formation of the highly reactive ferryl Hb) can be detected in sickle RBCs (24). Therefore SS cells are not only a source of ROS but they can also be the target of intracellular oxidative stress (25).
A limited numbers of clinical trials (mostly on patients in clinical steady-state conditions) have described the role of oxidative stress in disease complications (26). A recent perspective study, in which 32 sickle patients were monitored during vaso-occlusive crisis showed exacerbated oxidative stress including the accumulation of harmful RBC-derived microparticles (MPs) (27). Circulating MPs were shown recently to deliver heme to the vascular system initiating inflammatory responses in a sickle mouse model (28).
In spite of our increased knowledge of the molecular basis of SCD, no effective therapy for SCD has yet been found. Therapeutic efforts so far have focused on directly or indirectly preventing HbS polymerization. In antisickling drug design, it is often difficult to separate the impact of the polymerization process from other alterations within SS RBCs, such as peroxidative changes and redox changes in the Hb molecule. We chose TD-1 for our study because it covalently binds to βCys93, increase the affinity of Hb for oxygen, and reduce hypoxia-induced sickling of SS RBCs. Blocking βCys93 by TD-1 might therefore reduce irreversible oxidation of its thiol (9).
We evaluated TD-1’s effect on SS blood and blood from ethnically matched controls and confirmed its ability to shift the allosteric equilibrium towards the higher oxygen affinity R form of Hb. From this study TD-1 binding to sickle cells Hb (but not wild type control cells) appeared to reduce cooperativity of HbS (9).
The polymerization delay time is an important criterion that any potential antisickling agent should minimally meet. Reducing HbS concentration is known to markedly increase delay times and allow more red cells to escape to larger vessels before fiber formation (29). It has also been shown that delay time measurements correlate well with the severity of sickling syndromes as seen with the administration of drugs like hydroxyurea (30, 31). Our data clearly show that the HbS polymerization delay in response to modified TD-1 treatment was approximately 1.6 times longer that native deoxyHbS in experiments using higher concentration of the reagent. This is consistent with early observations which revealed the linkage of thiol reagents to βCys93 increases in delay times (32).
The mass spectrometry in this report clearly indicates that βCys93 and βCys112 are both labeled by TD-1. Our results also indicate that the modification stoichiometry for TD-1 (a monomeric unit of TD-1) binding to the β subunit is essentially 100% thereby supporting earlier crystal structural data that also reveal βCys93 and βCys112 to be TD-1 modification sites; a mixture of modified and unmodified HbS would have likely not provided the electron density necessary for resolving a crystal structure showing TD-1 attachment (9). These MS data also show that TD-1 acts as an antioxidant by blocking oxidation at the thiol side chain; in all experiments where HbS was treated with TD-1 and then exposed to 10-fold H2O2 we were unable to detect oxidation or DMPO labeling at βCys93; we did however see DMPO labeling with the untreated controls. DMPO (unlike TD-1) has been established to react with Cys93 without perturbing the trypsin digestion reaction (7, 33)
We used RP HPLC in order to examine the effects of TD-1 binding onto β subunits specifically to βCys93 and verify the formation of a stable adduct that can be detected. It has been previously shown by crystal structure that covalent binding of βCys93 results in significant tertiary and quaternary structural changes in the molecule (9). Our data support these results; there were noticeable peak shifts for both β and α subunits due to the modification by TD-1. These peaks were right shifted indicating that TD-1 binding led to increases in subunit hydrophobicity.
We have recently investigated the commercial analogue of the compound, 5-hydrox-ymethyl-2-furfural (5-HMF), also known as AES-103 currently undergoing clinical evaluation (ClinicalTrials.gov identifier NCT019879080). 5-HMF binds outside the “hotspot” area that contains βCys93, specifically to the N-terminal valine residues of HbS α-globin chains, forming a Schiff-base adduct which likely stabilizes the R- state (34). We have found that this compound provided no oxidative protection under similar oxidative stress conditions used in this study (unpublished data). Our 5-HMF data further supports our hypothesis that βCys93 modifying compounds likely provide oxidative stability to the protein since βCys93 is an endpoint for free radical oxidation (7).
Increasing the Hb oxygen affinity coupled with increases in Hb delay times has also been observed when Hb sulfhydryl groups are modified by N-ethylmaleimide (NEM) (35). βCys93 occupies an important and crucial position at the β/α interface and is critically involved in the Hb R to T transition. Despite the fact that βCys93 is not located within close proximity to the A helix region (7) harboring the site of mutation (β6Glu→ Val), βCys93 has been shown to be a very critical amino acid for β subunit stability (7). When H2O2 reacts with the ferric form of Hb, a protein radical (·HbFe4+=O) is also formed and this radical migrates to escape via a route that leads to βCys93 (7).
It is quite feasible that shielding this “hotspot’ amino acid with an antisickling agent may therefore prevent the collapse of β subunits, unfolding of the protein and heme loss (36). Reagents such as TD-1 that can block the βCys93 thiol groups of HbS and in the same time modify the allosteric behavior of the protein may therefore provide a venue for new drug design. These investigations may ultimately suggest potential therapeutic modalities that can interrupt heme-mediated inflammation in patients with SCD and act in the same time to modifying patient’s oxygen binding properties.
Supplementary Material
Acknowledgments
The authors acknowledge the assistance of Francine Wood with Hemox Analyzer experiments and Fantao Meng for helpful discussions. This work was supported by National Institutes of Health (NIH/NHLBI). AIA acknowledges NHLBI Grant P01-HL110900 and grants from the United States Food and Drug Administration (MODSCI).
Abbreviations
- DMPO
5,5-Dimethyl-1-pyrroline N-oxide
- Hb
Hemoglobin
- OEC
Oxygen Equilibrium Curve
- RP-HPLC
Reverse Phase-High Performance Liquid Chromatography
- SCD
Sickle Cell Disease
- SulfHb
Sulfhemoglobin
- TD-1
di(5-(2,3-dihydro-1,4-benzodioxin-2-yl)-4H-1,2,4-triazol-3-yl)disulfide
- MU
Monomeric unit of TD-1
Footnotes
Conflict of interest
Massachusetts General Hospital has a patent that is related to TD-1.
Contributions
TK and AIA designed the work. TK and MBS performed the experiments and data analysis. All the authors wrote and edited the manuscript.
Heme refers to protoporphyrin IX bearing FeII,FeIII, or FeIV for simplicity. Heme is used interchangeably with hemin, a protoporphyrin IX containing a FeIII with chloride.
References
- 1.Hebbel RP. Reconstructing sickle cell disease: a data-based analysis of the “hyperhemolysis paradigm” for pulmonary hypertension from the perspective of evidence-based medicine. Am J Hematol. 2011;86(2):123–54. doi: 10.1002/ajh.21952. [DOI] [PubMed] [Google Scholar]
- 2.Pauling L, Itano HA, et al. Sickle cell anemia a molecular disease. Science. 1949;110(2865):543–8. doi: 10.1126/science.110.2865.543. [DOI] [PubMed] [Google Scholar]
- 3.Hebbel RP. Ischemia-reperfusion injury in sickle cell anemia: relationship to acute chest syndrome, endothelial dysfunction, arterial vasculopathy, and inflammatory pain. Hematol Oncol Clin North Am. 2014;28(2):181–98. doi: 10.1016/j.hoc.2013.11.005. [DOI] [PubMed] [Google Scholar]
- 4.Hebbel RP, Ney PA, Foker W. Autoxidation, dehydration, and adhesivity may be related abnormalities of sickle erythrocytes. Am J Physiol. 1989;256(3 Pt 1):C579–83. doi: 10.1152/ajpcell.1989.256.3.C579. [DOI] [PubMed] [Google Scholar]
- 5.Belcher JD, Chen C, Nguyen J, Milbauer L, Abdulla F, Alayash AI, et al. Heme triggers TLR4 signaling leading to endothelial cell activation and vaso-occlusion in murine sickle cell disease. Blood. 2014;123(3):377–90. doi: 10.1182/blood-2013-04-495887. [DOI] [PMC free article] [PubMed] [Google Scholar]
- 6.Stubbe J, Riggs-Gelasco P. Harnessing free radicals: formation and function of the tyrosyl radical in ribonucleotide reductase. Trends Biochem Sci. 1998;23(11):438–43. doi: 10.1016/s0968-0004(98)01296-1. [DOI] [PubMed] [Google Scholar]
- 7.Kassa T, Jana S, Strader MB, Meng F, Jia Y, Wilson MT, et al. Sickle Cell Hemoglobin in the Ferryl State Promotes betaCys-93 Oxidation and Mitochondrial Dysfunction in Epithelial Lung Cells (E10) J Biol Chem. 2015;290(46):27939–58. doi: 10.1074/jbc.M115.651257. [DOI] [PMC free article] [PubMed] [Google Scholar]
- 8.Mansouri A. Oxidation of human hemoglobin by sodium nitrite–effect of beta-93 thiol groups. Biochem Biophys Res Commun. 1979;89(2):441–7. doi: 10.1016/0006-291x(79)90649-1. [DOI] [PubMed] [Google Scholar]
- 9.Nakagawa A, Lui FE, Wassaf D, Yefidoff-Freedman R, Casalena D, Palmer MA, et al. Identification of a small molecule that increases hemoglobin oxygen affinity and reduces SS erythrocyte sickling. ACS Chem Biol. 2014;9(10):2318–25. doi: 10.1021/cb500230b. [DOI] [PMC free article] [PubMed] [Google Scholar]
- 10.Meng F, Alayash AI. Determination of extinction coefficients of human hemoglobin in various redox states. Anal Biochem. 2017;521:11–9. doi: 10.1016/j.ab.2017.01.002. [DOI] [PMC free article] [PubMed] [Google Scholar]
- 11.Giulivi C, Davies KJ. Hydrogen peroxide-mediated ferrylhemoglobin generation in vitro and in red blood cells. Methods Enzymol. 1994;231:490–6. doi: 10.1016/0076-6879(94)31032-7. [DOI] [PubMed] [Google Scholar]
- 12.Adachi K, Asakura T. Nucleation-controlled aggregation of deoxyhemoglobin S. Possible difference in the size of nuclei in different phosphate concentrations. J Biol Chem. 1979;254(16):7765–71. [PubMed] [Google Scholar]
- 13.Cellmer T, Ferrone FA, Eaton WA. Universality of supersaturation in protein-fiber formation. Nat Struct Mol Biol. 2016;23(5):459–61. doi: 10.1038/nsmb.3197. [DOI] [PMC free article] [PubMed] [Google Scholar]
- 14.Mollan TL, Banerjee S, Wu G, Parker Siburt CJ, Tsai AL, Olson JS, et al. alpha-Hemoglobin stabilizing protein (AHSP) markedly decreases the redox potential and reactivity of alpha-subunits of human HbA with hydrogen peroxide. J Biol Chem. 2013;288(6):4288–98. doi: 10.1074/jbc.M112.412064. [DOI] [PMC free article] [PubMed] [Google Scholar]
- 15.Berzofsky JA, Peisach J, Blumberg WE. Sulfheme proteins. I. Optical and magnetic properties of sulfmyoglobin and its derivatives. J Biol Chem. 1971;246(10):3367–77. [PubMed] [Google Scholar]
- 16.Strader MB, Hicks WA, Kassa T, Singleton E, Soman J, Olson JS, et al. Post-translational transformation of methionine to aspartate is catalyzed by heme iron and driven by peroxide: a novel subunit-specific mechanism in hemoglobin. J Biol Chem. 2014;289(32):22342–57. doi: 10.1074/jbc.M114.568980. [DOI] [PMC free article] [PubMed] [Google Scholar]
- 17.Huang Z, Hearne L, Irby CE, King SB, Ballas SK, Kim-Shapiro DB. Kinetics of increased deformability of deoxygenated sickle cells upon oxygenation. Biophys J. 2003;85(4):2374–83. doi: 10.1016/s0006-3495(03)74661-x. [DOI] [PMC free article] [PubMed] [Google Scholar]
- 18.Brantley RE, Jr, Smerdon SJ, Wilkinson AJ, Singleton EW, Olson JS. The mechanism of autooxidation of myoglobin. J Biol Chem. 1993;268(10):6995–7010. [PubMed] [Google Scholar]
- 19.Shikama K. The Molecular Mechanism of Autoxidation for Myoglobin and Hemoglobin: A Venerable Puzzle. Chem Rev. 1998;98(4):1357–74. doi: 10.1021/cr970042e. [DOI] [PubMed] [Google Scholar]
- 20.Alayash AI, Ryan BA, Eich RF, Olson JS, Cashon RE. Reactions of sperm whale myoglobin with hydrogen peroxide. Effects of distal pocket mutations on the formation and stability of the ferryl intermediate. J Biol Chem. 1999;274(4):2029–37. doi: 10.1074/jbc.274.4.2029. [DOI] [PubMed] [Google Scholar]
- 21.Chirico EN, Pialoux V. Role of oxidative stress in the pathogenesis of sickle cell disease. IUBMB Life. 2012;64(1):72–80. doi: 10.1002/iub.584. [DOI] [PubMed] [Google Scholar]
- 22.George A, Pushkaran S, Konstantinidis DG, Koochaki S, Malik P, Mohandas N, et al. Erythrocyte NADPH oxidase activity modulated by Rac GTPases, PKC, and plasma cytokines contributes to oxidative stress in sickle cell disease. Blood. 2013;121(11):2099–107. doi: 10.1182/blood-2012-07-441188. [DOI] [PMC free article] [PubMed] [Google Scholar]
- 23.Hebbel RP, Morgan WT, Eaton JW, Hedlund BE. Accelerated autoxidation and heme loss due to instability of sickle hemoglobin. Proc Natl Acad Sci U S A. 1988;85(1):237–41. doi: 10.1073/pnas.85.1.237. [DOI] [PMC free article] [PubMed] [Google Scholar]
- 24.Cyrklaff M, Sanchez CP, Kilian N, Bisseye C, Simpore J, Frischknecht F, et al. Hemoglobins S and C interfere with actin remodeling in Plasmodium falciparum-infected erythrocytes. Science. 2011;334(6060):1283–6. doi: 10.1126/science.1213775. [DOI] [PubMed] [Google Scholar]
- 25.Wood KC, Hsu LL, Gladwin MT. Sickle cell disease vasculopathy: a state of nitric oxide resistance. Free Radic Biol Med. 2008;44(8):1506–28. doi: 10.1016/j.freeradbiomed.2008.01.008. [DOI] [PubMed] [Google Scholar]
- 26.Nur E, Brandjes DP, Schnog JJ, Otten HM, Fijnvandraat K, Schalkwijk CG, et al. Plasma levels of advanced glycation end products are associated with haemolysis-related organ complications in sickle cell patients. Br J Haematol. 2010;151(1):62–9. doi: 10.1111/j.1365-2141.2010.08320.x. [DOI] [PubMed] [Google Scholar]
- 27.Hierso R, Lemonne N, Villaescusa R, Lalanne-Mistrih ML, Charlot K, Etienne-Julan M, et al. Exacerbation of oxidative stress during sickle vaso-occlusive crisis is associated with decreased anti-band 3 autoantibodies rate and increased red blood cell-derived microparticle level: a prospective study. Br J Haematol. 2017;176(5):805–13. doi: 10.1111/bjh.14476. [DOI] [PubMed] [Google Scholar]
- 28.Camus SM, De Moraes JA, Bonnin P, Abbyad P, Le Jeune S, Lionnet F, et al. Circulating cell membrane microparticles transfer heme to endothelial cells and trigger vasoocclusions in sickle cell disease. Blood. 2015;125(24):3805–14. doi: 10.1182/blood-2014-07-589283. [DOI] [PMC free article] [PubMed] [Google Scholar]
- 29.Eaton WA, Hofrichter J. Hemoglobin S gelation and sickle cell disease. Blood. 1987;70(5):1245–66. [PubMed] [Google Scholar]
- 30.Ferrone FA. Sickle cell disease: Its molecular mechanism and the one drug that treats it. Int J Biol Macromol. 2016;93(Pt A):1168–73. doi: 10.1016/j.ijbiomac.2016.09.073. [DOI] [PubMed] [Google Scholar]
- 31.Bridges KR, Barabino GD, Brugnara C, Cho MR, Christoph GW, Dover G, et al. A multiparameter analysis of sickle erythrocytes in patients undergoing hydroxyurea therapy. Blood. 1996;88(12):4701–10. [PubMed] [Google Scholar]
- 32.Domenget C, Garel MC, Rhoda MD, Caburi-Martin J, Galacteros F, Beuzard Y. Kinetics of polymerization of hemoglobin S modified by thiol reagents and by oxidation. Biochim Biophys Acta. 1985;830(1):71–9. doi: 10.1016/0167-4838(85)90133-5. [DOI] [PubMed] [Google Scholar]
- 33.Deterding LJ, Ramirez DC, Dubin JR, Mason RP, Tomer KB. Identification of free radicals on hemoglobin from its self-peroxidation using mass spectrometry and immuno-spin trapping: observation of a histidinyl radical. J Biol Chem. 2004;279(12):11600–7. doi: 10.1074/jbc.M310704200. [DOI] [PubMed] [Google Scholar]
- 34.Oder E, Safo MK, Abdulmalik O, Kato GJ. New developments in anti-sickling agents: can drugs directly prevent the polymerization of sickle haemoglobin in vivo? Br J Haematol. 2016;175(1):24–30. doi: 10.1111/bjh.14264. [DOI] [PMC free article] [PubMed] [Google Scholar]
- 35.Knee KM, Roden CK, Flory MR, Mukerji I. The role of beta93 Cys in the inhibition of Hb S fiber formation. Biophys Chem. 2007;127(3):181–93. doi: 10.1016/j.bpc.2007.02.002. [DOI] [PMC free article] [PubMed] [Google Scholar]
- 36.Mollan TL, Jia Y, Banerjee S, Wu G, Kreulen RT, Tsai AL, et al. Redox properties of human hemoglobin in complex with fractionated dimeric and polymeric human haptoglobin. Free Radic Biol Med. 2014;69:265–77. doi: 10.1016/j.freeradbiomed.2014.01.030. [DOI] [PMC free article] [PubMed] [Google Scholar]
Associated Data
This section collects any data citations, data availability statements, or supplementary materials included in this article.


